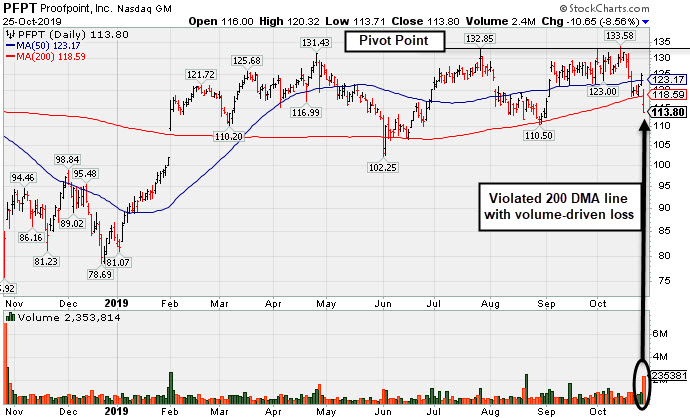
Weak Action Following Lackluster Earnings Report - Friday, October 25, 2019
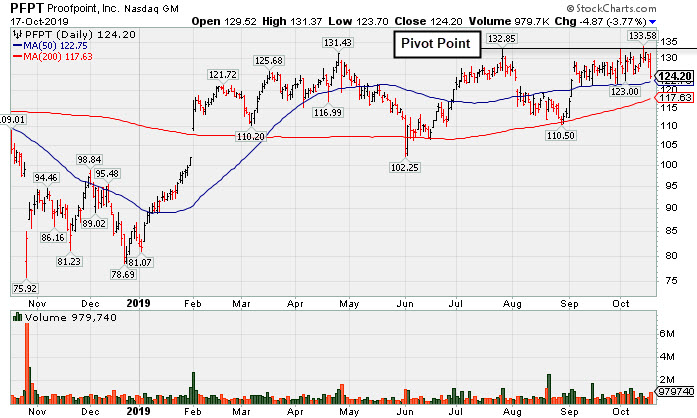
Recently Met Stubborn Resistance Near Prior Highs - Thursday, October 17, 2019
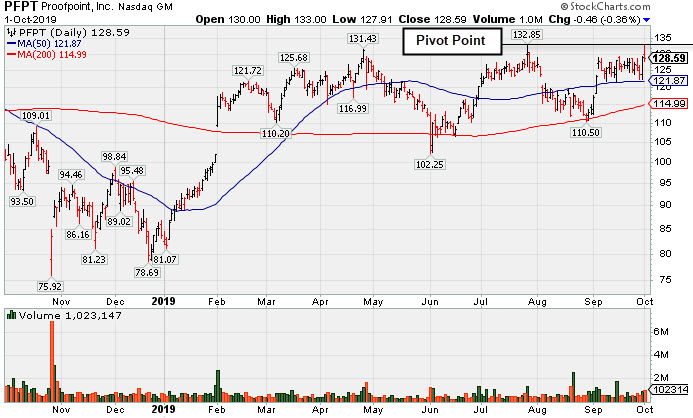
Challenging Previously Stubborn Resistance - Tuesday, October 1, 2019
Weak Action Following Lackluster Earnings Report - Friday, October 25, 2019
Proofpoint Inc (PFPT -$10.65 or -8.56% to $113.80) saw weak action after it reported earnings +23% on +23% sales revenues for the Sep '19 quarter, below the +25% minimum earnings guideline (C criteria), raising concerns. It gapped down today and violated its 200 DMA line ($118.60) with a damaging volume-driven loss triggering a technical sell signal. It will be dropped from the Featured Stocks list tonight.
PFPT was highlighted in yellow with pivot point cited based on its 7/26/19 high in the 10/01/19 mid-day report (read here). Members were reminded - "Subsequent gains above the pivot point backed by at least +40% above average volume may trigger a technical buy signal." The Computer Software-Security firm met stubborn resistance in the $132 area in recent months. Disciplined investors will note that it failed to trigger a technical buy signal and only slumped after last shown in this FSU section on 10/17/19 with an annotated graph under the headline, "Recently Met Stubborn Resistance Near Prior Highs".
The number of top-rated funds owning its shares rose from 517 in Dec '18 to 593 in Sep '19, a reassuring sign concerning the I criteria. Its current Up/Down Volume ration of 1.3 is an unbiased indication its shares have been under accumulation over the past 50 days. Its small supply of 56.1 million shares outstanding (S criteria) can contribute to greater price volatility in the event of institutional buying or selling.
Recently Met Stubborn Resistance Near Prior Highs - Thursday, October 17, 2019
Proofpoint Inc (PFPT -$5.18 or -4.01% to $123.89) pulled back from its all-time high with a big loss today on above average volume. It has met stubborn resistance in the $132 area in recent months. Its 50-day moving average (DMA) line ($122.75 defines near-term support. Subsequent gains above the pivot point backed by at least +40% above average volume may trigger a technical buy signal.
PFPT was highlighted in yellow with pivot point cited based on its 7/26/19 high in the 10/01/19 mid-day report (read here). The Computer Software-Security firm has met stubborn resistance in the $132 area in recent months. Subsequent gains above the pivot point backed by at least +40% above average volume may trigger a technical buy signal. yellow with pivot point cited based on its 7/26/19 high. It was last shown in this FSU section on 10/01/19 with an annotated graph under the headline, "Challenging Previously Stubborn Resistance".
Keep in mind it is due to report earnings news on 10/24/19 for the Sep '19 quarter. Volume and volatility often increase near earnings news. It has an Earnings Per Share Rating of 97. Prior mid-day reports noted - "Three of the past 4 quarterly comparisons through Jun '19 were above the +25% minimum earnings guideline (C criteria). Annual earnings (A criteria) history has been strong since turning profitable in FY '16 ".
The number of top-rated funds owning its shares rose from 517 in Dec '18 to 590 in Sep '19, a reassuring sign concerning the I criteria. Its current Up/Down Volume ration of 1.3 is an unbiased indication its shares have been under accumulation over the past 50 days. Its small supply of 56.1 million shares outstanding (S criteria) can contribute to greater price volatility in the event of institutional buying or selling.
Challenging Previously Stubborn Resistance - Tuesday, October 1, 2019
Proofpoint Inc (PFPT-$0.46 or -0.36% to $128.59) was highlighted in yellow with pivot point cited based on its 7/26/19 high in the earlier mid-day report (read here). It reversed into the red after touching a new all-time high today. The Computer Software-Security firm has met stubborn resistance in the $132 area in recent months. Subsequent gains above the pivot point backed by at least +40% above average volume may trigger a technical buy signal. yellow with pivot point cited based on its 7/26/19 high.
It has an Earnings Per Share Rating of 97. Prior mid-day reports noted - "Three of the past 4 quarterly comparisons through Jun '19 were above the +25% minimum earnings guideline (C criteria). Annual earnings (A criteria) history has been strong since turning profitable in FY '16 ".
The number of top-rated funds owning its shares rose from 517 in Dec '18 to 576 in Jun '19, a reassuring sign concerning the I criteria. Its current Up/Down Volume ration of 1.4 is an unbiased indication its shares have been under accumulation over the past 50 days. Its small supply of 56.1 million shares outstanding (S criteria) can contribute to greater price volatility in the event of institutional buying or selling.