Pulled Back From Record High With Higher Volume - Wednesday, January 10, 2018
Patrick Industries Inc (PATK -$0.75 or -1.13% to $65.50) retreated from its all-time high with a loss on above average volume on 1/04/18 indicative of distributional pressure. Its 50-day moving average (DMA) line and prior high coincide in the $64 area defining near-term support to watch. Fundamentals remain strong. Shares split 3/2 effective 12/11/17, so do not be confused by the impact on the share prices. Its small supply of 23.7 million shares (S criteria) in the public float still can contribute to greater price volatility in the event of institutional buying or selling.
PATK finished strong on 10/26/17 after highlighted in yellow with new pivot point cited based on its 10/04/17 high in the mid-day report (read here). It spiked to a new high with a big gain backed by +305% above average volume triggering a technical buy signal. The bullish action came after it reported earnings +37% on +34% sales revenues for the Sep '17 quarter. Quarterly earnings of quarterly comparisons were above the +25% minimum earnings guideline (C criteria) in 2 of the 3 most recent quarters while sales revenues showed encouraging acceleration. A small downturn in FY '13 was a flaw previously noted in its annual earnings (A criteria) history.
It has earned a 96 Earnings Per Share rating and fundamentals remain strong. Leadership (L criteria) from others in the industry group (Building - Mobile/ Mfg & RV) is a reassuring sign. PATK currently has Timeliness Rating of B and also a Sponsorship Rating of B. It was last shown in this FSU section on 12/15/17 with an annotated graph under the headline, "Hovering Near High Following 3:2 Share Split". Its current Up/Down Volume ratio of 1.1 is an unbiased indication that its shares were near neutral concerning accumulation/distribution over the past 50 days. The number of top-rated funds owning its share rose from 218 in Jun '15 to 336 in Sep '17, a reassuring trend concerning the I criteria.
Charts used courtesy of www.stockcharts.com
Hovering Near High Following 3:2 Share Split - Friday, December 15, 2017
Patrick Industries Inc (PATK +$1.35 or +2.08% to $66.20) has been hovering near its all-time high, extended from its prior base. Its 50-day moving average (DMA) line ($60.82) defines important near-term support to watch. Fundamentals remain strong.
PATK finished strong on 10/26/17 after highlighted in yellow with new pivot point cited based on its 10/04/17 high in the mid-day report (read here). It spiked to a new high with a big gain backed by +305% above average volume triggering a technical buy signal. The bullish action came after it reported earnings +37% on +34% sales revenues for the Sep '17 quarter.Quarterly earnings of quarterly comparisons were above the +25% minimum earnings guideline (C criteria) in 2 of the 3 most recent quarters while sales revenues showed encouraging acceleration. A small downturn in FY '13 was a flaw previously noted in its annual earnings (A criteria) history.
It has earned a 96 Earnings Per Share rating and fundamentals remain strong. Leadership (L criteria) from others in the industry group (Building - Mobile/ Mfg & RV) is a reassuring sign. PATK currently has Timeliness Rating of B and also a Sponsorship Rating of B. It was last shown in this FSU section on 11/21/17 with an annotated graph under the headline, "Best Ever Close After Pullback Found Support Near Prior High".
Its current Up/Down Volume ratio of 1.0 is an unbiased indication that its shares were neutral concerning accumulation/distribution over the past 50 days. The number of top-rated funds owning its share rose from 218 in Jun '15 to 329 in Sep '17, a reassuring trend concerning the I criteria.

Best Ever Close After Pullback Found Support Near Prior High - Tuesday, November 21, 2017
Patrick Industries Inc (PATK +$2.80 or +3.05% to $94.50) posted another solid gain today and finished at a best-ever close. It found support when recently consolidating near prior highs in the $86-87 area. Its 50-day moving average (DMA) line ($85.51) also defines near-term support to watch. Fundamentals remain strong.
PATK finished strong on 10/26/17 after highlighted in yellow with new pivot point cited based on its 10/04/17 high in the mid-day report (read here). It spiked to a new high with a big gain backed by +305% above average volume triggering a technical buy signal. The bullish action came after it reported earnings +37% on +34% sales revenues for the Sep '17 quarter.Quarterly earnings of quarterly comparisons were above the +25% minimum earnings guideline (C criteria) in 2 of the 3 most recent quarters while sales revenues showed encouraging acceleration. A small downturn in FY '13 was a flaw previously noted in its annual earnings (A criteria) history.
It has earned a 96 Earnings Per Share rating and fundamentals remain strong. Leadership (L criteria) from others in the industry group (Building - Mobile/ Mfg & RV) is a reassuring sign. PATK currently has Timeliness Rating of A and also a Sponsorship Rating of B. It was last shown in this FSU section on 10/26/17 with an annotated graph under the headline, "Volume 4 Times Average Behind Breakout Gain on Earnings News".
Its current Up/Down Volume ratio of 1.7 is an unbiased indication that its shares were under accumulation over the past 50 days. The number of top-rated funds owning its share rose from 218 in Jun '15 to 329 in Sep '17, a reassuring trend concerning the I criteria. Its small supply of 15.8 million shares (S criteria) in the public float can contribute to greater price volatility in the event of institutional buying or selling.
Charts used courtesy of www.stockcharts.com
Volume 4 Times Average Behind Breakout Gain on Earnings News - Thursday, October 26, 2017
Patrick Industries Inc (PATK +$7.70 or +9.12% to $92.15) finished strong today after highlighted in yellow with new pivot point cited based on its 10/04/17 high in the earlier mid-day report (read here). It spiked to a new high with a big gain backed by +305% above average volume triggering a technical buy signal. The bullish action came after it reported earnings +37% on +34% sales revenues for the Sep '17 quarter. Quarterly earnings of quarterly comparisons were above the +25% minimum earnings guideline (C criteria) in 2 of the 3 most recent quarters while sales revenues showed encouraging acceleration. A small downturn in FY '13 was a flaw previously noted in its annual earnings (A criteria) history.
It has earned a 96 Earnings Per Share rating and fundamentals remain strong. Leadership (L criteria) from others in the industry group (Building - Mobile/ Mfg & RV) is a reassuring sign. PATK currently has Timeliness Rating of B and also a Sponsorship Rating of B. It went through a long and choppy consolidation since dropped from the Featured Stocks list on 3/09/17. It was last shown in this FSU section on 1/31/17 with an annotated graph under the headline, "Perched Near All-Time High Extended From Prior Base".
Charts used courtesy of www.stockcharts.com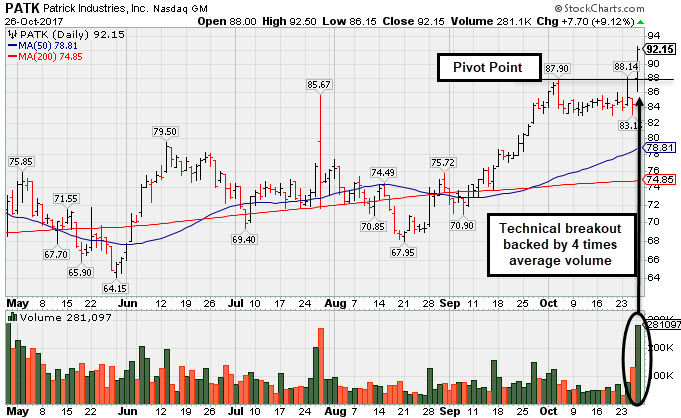
Perched Near All-Time High Extended From Prior Base - Tuesday, January 31, 2017
Patrick Industries Inc (PATK +$0.20 or +0.25% to $81.75) remains perched near all-time highs, extended from its prior base. its 50-day moving average (DMA) line ($75.94) defines support to watch on pullbacks. Prior highs in the $69 area define the next support below that important short-term moving average. Subsequent violations would raise concerns and trigger technical sell signals.
PATK currently has A Timeliness Rating of A and a Sponsorship Ratinbg of B. It has made gradual progress since last shown in this FSU section on 12/28/16 with an annotated graph under the headline, "Stubbornly Held Ground and Rose Since Featured Again". It was highlighted in yellow with new pivot point cited based on its 7/28/16 high plus 10 cents in the 11/29/16 mid-day report (read here). The convincing gain for new highs was backed by +106% above average volume triggering a new (or add-on) technical buy signal.
It reported Sep '16 quarterly earnings +36% on +42% sales revenues,continuing its streak of quarterly comparisons steadily above the +25% minimum earnings guideline (C criteria). A small downturn in FY '13 was a flaw previously noted in its annual earnings (A criteria) history.
Charts used courtesy of www.stockcharts.com
Stubbornly Held Ground and Rose Since Featured Again - Wednesday, December 28, 2016
Patrick Industries Inc (PATK -$0.95 or -1.22% to $77.00) remains perched near all-time highs, extended from its prior base. Prior highs in the $69 area and its 50-day moving average (DMA) line ($66.71) define support to watch on pullbacks.
PATK was last shown in this FSU section on 11/29/16 with an annotated graph under the headline, "Volume-Backed Breakout Triggered New Technical Buy Signal". It was highlighted in yellow with new pivot point cited based on its 7/28/16 high plus 10 cents in the 11/29/16 mid-day report (read here). The convincing gain for new highs was backed by +106% above average volume triggering a new (or add-on) technical buy signal.
It found support at its 200-day moving average (DMA) line after dropped from the Featured Stocks list on 10/27/16, and since then it stubbornly held its ground while rebounding and rallying impressively. It was first highlighted in yellow with pivot point based on its 4/28/16 high plus 10 cents in the 5/24/16 mid-day report (read here).
It reported Sep '16 quarterly earnings +36% on +42% sales revenues,continuing its streak of quarterly comparisons steadily above the +25% minimum earnings guideline (C criteria). A small downturn in FY '13 was a flaw previously noted in its annual earnings (A criteria) history.
Its current Up/Down Volume ratio of 1.6 is an unbiased indication that its shares were under accumulation over the past 50 days. The number of top-rated funds owning its share rose from 218 in Jun '15 to 313 in Sep '16, a reassuring trend concerning the I criteria. Its small supply of 14.3 million shares (S criteria) in the public float can contribute to greater price volatility in the event of institutional buying or selling.
Charts used courtesy of www.stockcharts.com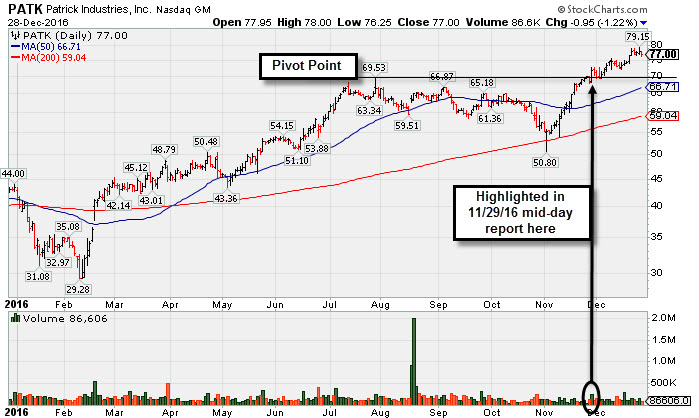
Volume-Backed Breakout Triggered New Technical Buy Signal - Tuesday, November 29, 2016
Patrick Industries Inc (PATK +$3.75 or +5.50% to $71.90) was highlighted in yellow with new pivot point cited based on its 7/28/16 high plus 10 cents in the earlier mid-day report (read here). The convincing gain for new highs today was backed by +106% above average volume triggering a new (or add-on) technical buy signal.
PATK was last shown in this FSU section on 10/26/16 with an annotated graph under the headline, "Sputtering Below 50-Day Average Ahead of Earnings News". It foundsupport at its 200-day moving average (DMA) line after dropped from the Featured Stocks list on 10/27/16, and since then it stubbornly held its ground while rebounding impressively. It reported Sep '16 quarterly earnings +36% on +42% sales revenues, continuing its streak of quarterly comparisons steadily above the +25% minimum earnings guideline (C criteria). A small downturn in FY '13 was a flaw previously noted in its annual earnings (A criteria) history.
PATK was last shown in this FSU section on 10/26/16 with an annotated graph under the headline, "Sputtering Below 50-Day Average Ahead of Earnings News". It foundsupport at its 200-day moving average (DMA) line after dropped from the Featured Stocks list on 10/27/16, and since then it stubbornly held its ground while rebounding impressively. It reported Sep '16 quarterly earnings +36% on +42% sales revenues, continuing its streak of quarterly comparisons steadily above the +25% minimum earnings guideline (C criteria). A small downturn in FY '13 was a flaw previously noted in its annual earnings (A criteria) history.
It was first highlighted in yellow with pivot point based on its 4/28/16 high plus 10 cents in the 5/24/16 mid-day report (read here).
Its current Up/Down Volume ratio of 1.1 is an unbiased indication that its shares were under slight accumulation over the past 50 days. The number of top-rated funds owning its share rose from 218 in Jun '15 to 307 in Sep '16, a reassuring trend concerning the I criteria. Its small supply of 14.3 million shares (S criteria) in the public float can contribute to greater price volatility in the event of institutional buying or selling.
Charts used courtesy of www.stockcharts.com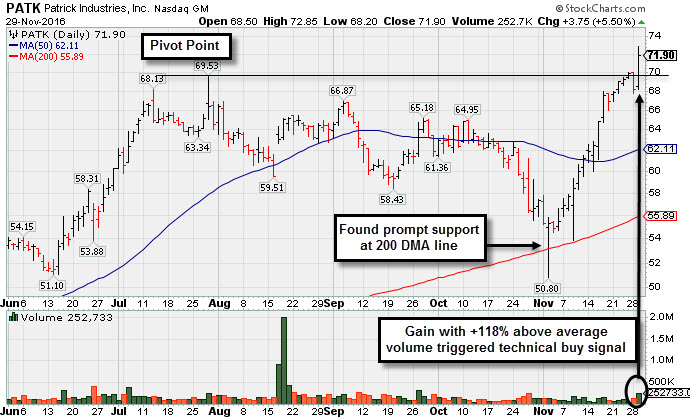
Sputtering Below 50-Day Average Ahead of Earnings News - Wednesday, October 26, 2016
Patrick Industries Inc (PATK -$1.25 or -2.09% to $58.50) finished weak today as it slumped further below its 50-day moving average (DMA) line ($62.85) and undercut prior lows. Keep in mind that it is due to report Sep '16 quarterly earnings news before the open on Thursday. Volume and volatility often increase near earnings news. Earnings rose +41% on +35% sales revenues for the Jun '16 quarter, continuing its streak of quarterly comparisons steadily above the +25% minimum earnings guideline (C criteria). A small downturn in FY '13 was a flaw previously noted in its annual earnings (A criteria) history.
A new pivot point was recently cited based on its 9/06/16 high, however a rally above the 50 DMA line and convincing volume-driven gains above the pivot point are still needed to trigger a new (or add-on) technical buy signal. PATK was last shown in this FSU section on 9/28/16 with an annotated graph under the headline, "Found Support While Building on a New 'Double Bottom' Base Pattern". It was first highlighted in yellow with pivot point based on its 4/28/16 high plus 10 cents in the 5/24/16 mid-day report (read here).
Its current Up/Down Volume ratio of 1.4 is an unbiased indication that its shares were under accumulation over the past 50 days. The number of top-rated funds owning its share rose from 218 in Jun '15 to 293 in Sep '16, a reassuring trend concerning the I criteria. Its small supply of 14.3 million shares (S criteria) in the public float can contribute to greater price volatility in the event of institutional buying or selling.
Charts used courtesy of www.stockcharts.com
Found Support While Building on a New "Double Bottom" Base Pattern - Wednesday, September 28, 2016
Patrick Industries Inc (PATK +$0.77 or +1.20% to $64.85) rallied above its 50-day moving average (DMA) line ($63.23) with above average volume behind a considerable gain on the prior session and its color code was changed to yellow. Little resistance exists due to overhead supply, and a new pivot point is cited based on its 9/06 16 high while building on a "double bottom" base. Subsequent volume-driven gains above the pivot point may trigger a new (or add-on) technical buy signal. Meanwhile, more damaging losses below the 50 DMA line again would raise concerns.
PATK was last shown in this FSU section on 8/31/16 with an annotated graph under the headline, "Building a New Base Above 50-Day Moving Average Line". It reported earnings +41% on +35% sales revenues for the Jun '16 quarter, continuing its streak of quarterly comparisons steadily above the +25% minimum earnings guideline (C criteria). A small downturn in FY '13 was a flaw previously noted in its annual earnings (A criteria) history. It was first highlighted in yellow with pivot point based on its 4/28/16 high plus 10 cents in the 5/24/16 mid-day report (read here).
Its current Up/Down Volume ratio of 1.4 is an unbiased indication that its shares were under accumulation over the past 50 days. The number of top-rated funds owning its share rose from 218 in Jun '15 to 268 in Jun '16, a reassuring trend concerning the I criteria. Its small supply of 14.3 million shares (S criteria) in the public float can contribute to greater price volatility in the event of institutional buying or selling.
Charts used courtesy of www.stockcharts.com
Building a New Base Above 50-Day Moving Average Line - Wednesday, August 31, 2016
Patrick Industries Inc (PATK -$0.37 or -0.57% to $64.03) endured slight distributional pressure with a loss today on higher volume. Little resistance exists due to overhead supply, and it may be building a new base. It is consolidating above the 50-day moving average (DMA) line ($62.98) which defines important support along with its latest low ($59.51 on 8/16/16). Subsequent violations would raise concerns and trigger technical sell signals. It found prompt support after prior 50 DMA line violations raised concerns.
PATK hit its 52-week high when last shown in this FSU section on 7/28/16 with an annotated graph under the headline, "Rallied +30% in 2 Months Since Breakout Was Featured". It reported earnings +41% on +35% sales revenues for the Jun '16 quarter, continuing its streak of quarterly comparisons steadily above the +25% minimum earnings guideline (C criteria). A small downturn in FY '13 was a flaw previously noted in its annual earnings (A criteria) history. It was first highlighted in yellow with pivot point based on its 4/28/16 high plus 10 cents in the 5/24/16 mid-day report (read here). It finished strong with +132% above average volume as it hit new all-time highs confirming a technical buy signal.
Its current Up/Down Volume ratio of 2.0 is an unbiased indication that its shares were under accumulation over the past 50 days. The number of top-rated funds owning its share rose from 218 in Jun '15 to 268 in Jun '16, a reassuring trend concerning the I criteria. Its small supply of 14.3 million shares (S criteria) in the public float can contribute to greater price volatility in the event of institutional buying or selling.
Charts used courtesy of www.stockcharts.com
Rallied +30% in 2 Months Since Breakout Was Featured - Thursday, July 28, 2016
Patrick Industries Inc (PATK +$1.29 or +1.98% to $62.40) hit yet another new high with today's volume-driven gain. Rallying with no resistance due to overhead supply, it has been getting very extended from any sound base. Disciplined investors avoid chasing stocks more than +5% above prior highs. Its 50-day moving average DMA line ($57.85) defines near-term support to watch on pullbacks.
It reported earnings +41% on +35% sales revenues for the Jun '16 quarter, continuing its streak of quarterly comparisons steadily above the +25% minimum earnings guideline (C criteria). A small downturn in FY '13 was a flaw previously noted in its annual earnings (A criteria) history. It was last shown in this FSU section on 7/06/16 with an annotated graph under the headline, "Getting Extended From Prior Base After More Volume-Driven Gains". It has traded up as much as +30% since first highlighted in yellow with pivot point based on its 4/28/16 high plus 10 cents in the 5/24/16 mid-day report (read here). It finished strong with +132% above average volume as it hit new all-time highs confirming a technical buy signal.
Its current Up/Down Volume ratio of 1.4 is an unbiased indication that its shares were under accumulation over the past 50 days. The number of top-rated funds owning its share rose from 218 in Jun '15 to 256 in Jun '16, a reassuring trend concerning the I criteria. Its small supply of 14.2 million shares (S criteria) in the public float can contribute to greater price volatility in the event of institutional buying or selling.
Charts used courtesy of www.stockcharts.com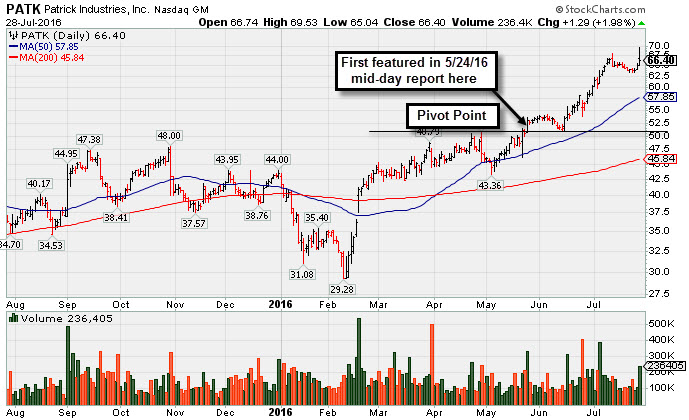
Getting Extended From Prior Base After More Volume-Driven Gains - Wednesday, July 6, 2016
Patrick Industries Inc (PATK +$1.84 or +3.04% to $62.40) hit another new high with today's volume-driven gains. Rallying with no resistance due to overhead supply, it has been getting very extended from any sound base. Disciplined investors avoid chasing stocks more than +5% above prior highs.
Its 50-day moving average DMA line ($52.10) defines near-term support to watch on pullbacks. It was last shown in this FSU section on 6/16/16 with an annotated graph under the headline, "Extended From Base After Another Volume-Driven Gain". It was first highlighted in yellow with pivot point based on its 4/28/16 high plus 10 cents in the 5/24/16 mid-day report (read here). It finished strong with +132% above average volume as it hit new all-time highs confirming a technical buy signal.
It reported earnings +36% on +25% sales revenues for the Mar '16 quarter, and prior quarters were steadily above the +25% minimum earnings guideline (C criteria). A small downturn in FY '13 was a flaw previously noted in its annual earnings (A criteria) history.
Its current Up/Down Volume ratio of 1.2 is an unbiased indication that its shares were under accumulation over the past 50 days. The number of top-rated funds owning its share rose from 218 in Jun '15 to 254 in Jun '16, a reassuring trend concerning the I criteria. Its small supply of 14.2 million shares (S criteria) in the public float can contribute to greater price volatility in the event of institutional buying or selling.
Charts used courtesy of www.stockcharts.com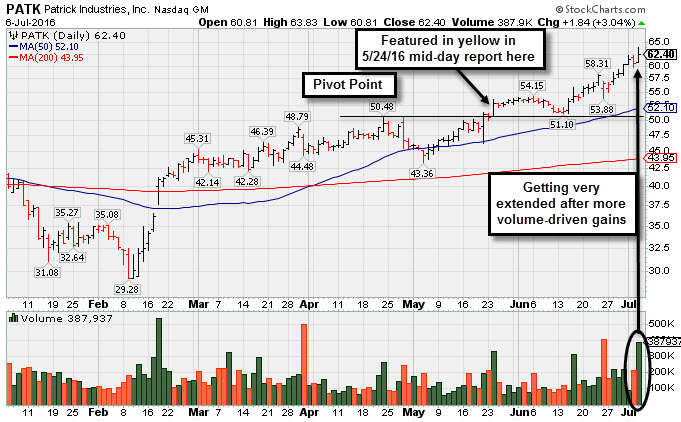
Extended From Base After Another Volume-Driven Gain - Thursday, June 16, 2016
Patrick Industries Inc (PATK +$0.92 or +1.72% to $54.28) hit a new 52-week high with today's volume-driven gain. Disciplined investors avoid chasing extended stocks which have rallied more than +5% above a sound base pattern. On pullbacks, prior highs define near term support in the $50 area, above its 50-day moving average (DMA) line ($49.33).
It was last shown in this FSU section on 5/24/16 with an annotated graph under the headline, "Solid Volume-Driven Gain Into New High Territory". It was highlighted in yellow with pivot point based on its 4/28/16 high plus 10 cents in the earlier mid-day report (read here). It finished strong with +132% above average volume as it hit new all-time highs confirming a technical buy signal with today's big gain, rallying with no resistance due to overhead supply.
It reported earnings +36% on +25% sales revenues for the Mar '16 quarter, and prior quarters were steadily above the +25% minimum earnings guideline (C criteria). A small downturn in FY '13 was a flaw previously noted in its annual earnings (A criteria) history.
Its current Up/Down Volume ratio of 1.3 is an unbiased indication that its shares were under accumulation over the past 50 days. The number of top-rated funds owning its share rose from 218 in Jun '15 to 249 in Mar '16, a reassuring trend concerning the I criteria. Its small supply of 14.2 million shares (S criteria) in the public float can contribute to greater price volatility in the event of institutional buying or selling.
Charts used courtesy of www.stockcharts.com
Solid Volume-Driven Gain Into New High Territory - Tuesday, May 24, 2016
Patrick Industries Inc (PATK +$2.42 or +4.79% to $52.95) was highlighted in yellow with pivot point based on its 4/28/16 high plus 10 cents in the earlier mid-day report (read here). It finished strong with +132% above average volume as it hit new all-time highs confirming a technical buy signal with today's big gain, rallying with no resistance due to overhead supply.
It reported earnings +36% on +25% sales revenues for the Mar '16 quarter, and prior quarters were steadily above the +25% minimum earnings guideline (C criteria). A small downturn in FY '13 was a flaw previously noted in its annual earnings (A criteria) history.
Its current Up/Down Volume ratio of 1.6 is an unbiased indication that its shares were under accumulation over the past 50 days. The number of top-rated funds owning its share rose from 218 in Jun '15 to 245 in Mar '16, a reassuring trend concerning the I criteria. Its small supply of 14.2 million shares (S criteria) in the public float can contribute to greater price volatility in the event of institutional buying or selling.
Charts used courtesy of www.stockcharts.com