Charts used courtesy of www.stockcharts.com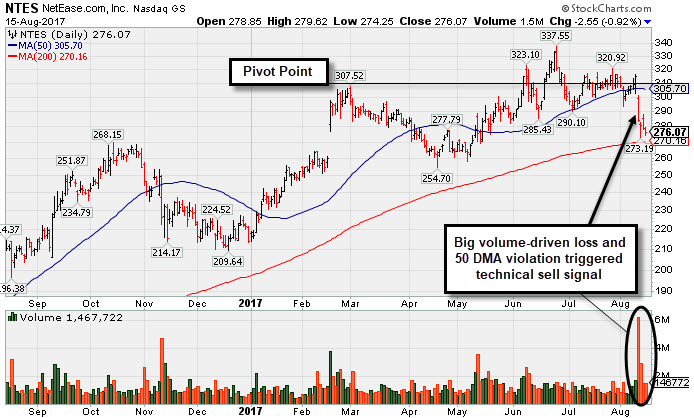
Charts used courtesy of www.stockcharts.com
Charts used courtesy of www.stockcharts.com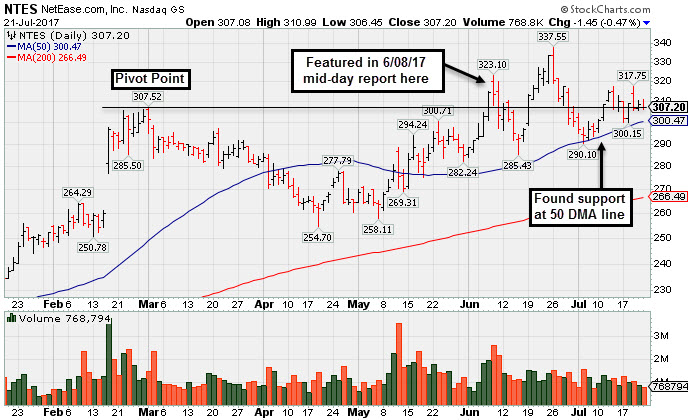
Charts used courtesy of www.stockcharts.com
Charts used courtesy of www.stockcharts.com
Charts used courtesy of www.stockcharts.com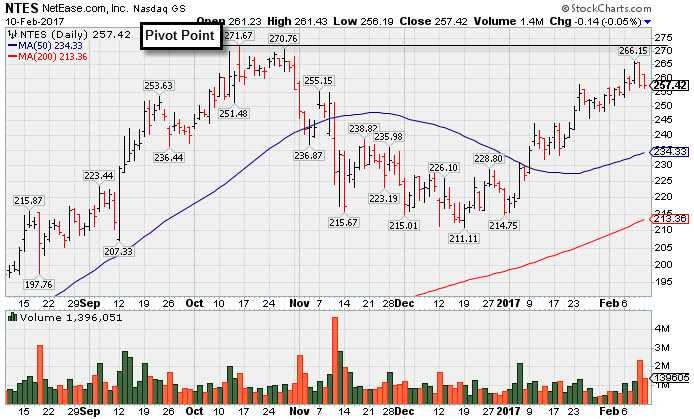
Charts used courtesy of www.stockcharts.com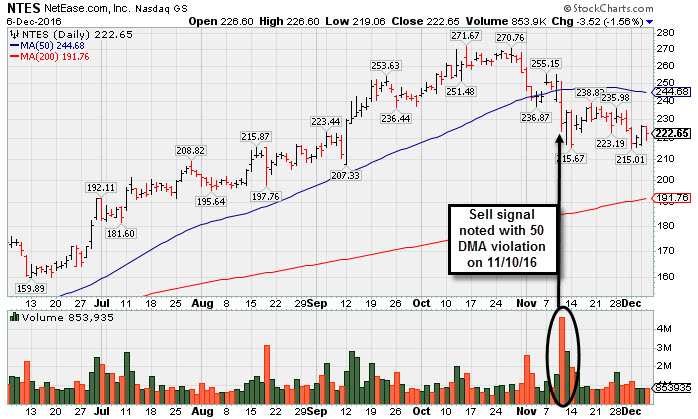
Charts used courtesy of www.stockcharts.com
Charts used courtesy of www.stockcharts.com
Charts used courtesy of www.stockcharts.com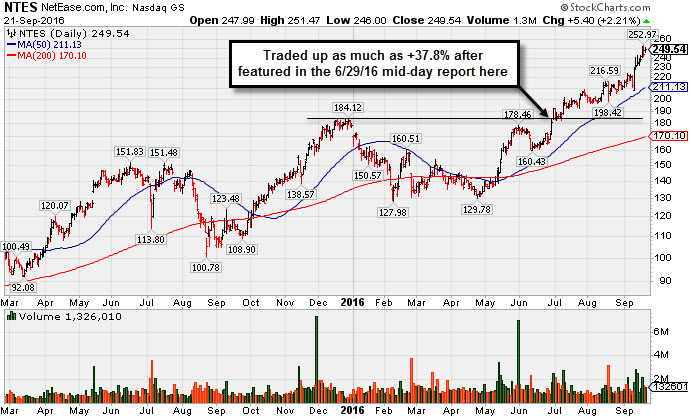
Charts used courtesy of www.stockcharts.com
Charts used courtesy of www.stockcharts.com
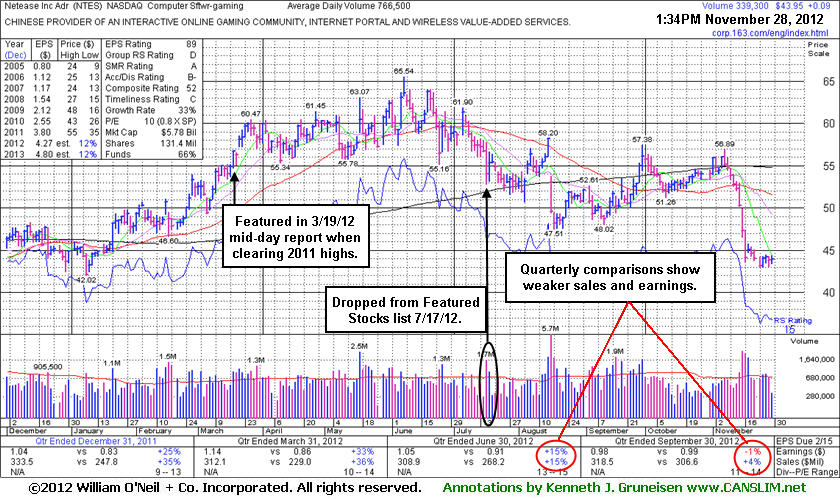
Netease.com Inc (NTES) fell from $54.05 to as low as last week's $42.94 since it was last noted 7/17/2012 6:14:23 PM - "Violated prior lows in the $55 area today and triggered a more worrisome technical sell signal while slumping toward its 200 DMA line. It faces overhead supply that may act as resistance up through the $65 area. Based on weak action it ended -17.5% off its 52-week high and it will be dropped from the Featured Stocks list tonight." That evening's FSU analysis included more details and a new annotated graph under the headline, "Damaging Loss on Higher Volume Triggers Worrisome Sell Signal".
Its Relative Strength Rating was a 81 at that time, near the minimum guideline for buy candidates. It has slumped to 15. Today it faces a far greater amount of overhead supply that may act as resistance up through the $65 area if ever it attempts to rebound. The number of top-rated funds owning its shares fell from 290 in Jun '12 to 276 in Sep '12, not a reassuring trend concerning the I criteria.
In the months after it was featured in yellow at $56.18 in the 3/19/12 mid-day report (read here) the Computer Software - Gaming firm made some upward progress. However, today this serves as yet another example where a company's deteriorating technical action has been accompanied by deteriorating fundamentals. Notice the -1% earnings on +4% sales revenues in the Sep '12 quarter, marking its weakest quarterly results in years.
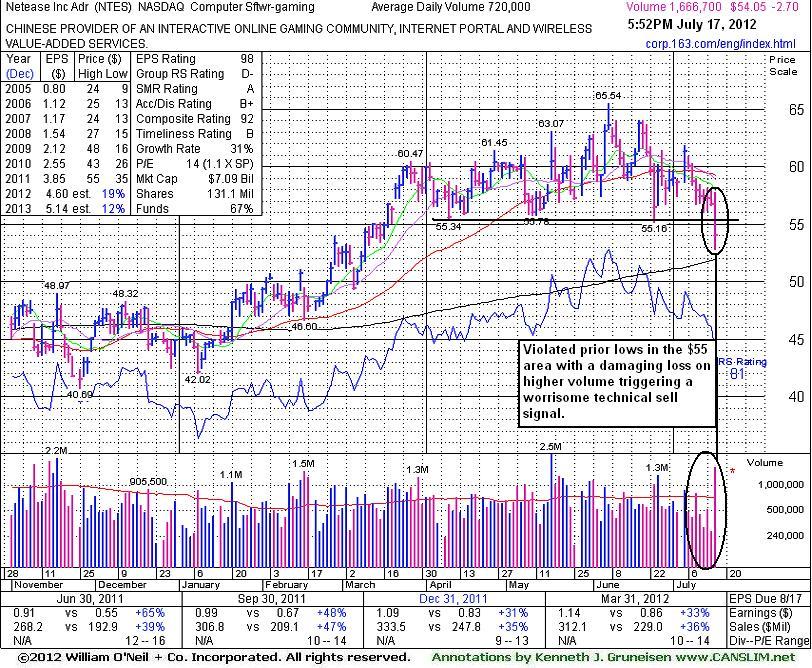
Netease.com Inc (NTES -$2.70 or -4.76% to $54.05) violated prior lows in the $55 area today and triggered a more worrisome technical sell signal while slumping toward its 200-day moving average (DMA) line. It faces overhead supply that may act as resistance up through the $65 area. Based on weak action it ended -17.5% off its 52-week high and it will be dropped from the Featured Stocks list tonight. Weeks ago it violated its 50-day moving average (DMA) line triggering a previously noted technical sell signal.
NTES tallied only 4 gains versus 15 losses in the interim since its last appearance in this FSU section on 6/19/12 with an annotated graph under the headline, "Best Close of 2012 After No New Base Was Formed". Its Relative Strength Rating was a 92 at that time, but it has slumped to 81, near the minimum guideline for buy candidates.
No overhead supply was there to act as resistance, however it made only limited price progress above its 2011 highs in the $55 area in recent months. It was featured in yellow at $56.18 in the 3/19/12 mid-day report (read here) with a pivot point based on its 4/19/11 high plus 10 cents (not shown on the chart below, but best viewed on a weekly chart).
The number of top-rated funds owning its shares rose from 237 in Dec '11 to 261 in Mar '12, a somewhat reassuring improvement concerning the I criteria. Fundamentals remain healthy as it reported earnings +33% on +36% sales revenues for the quarter ended March 31, 2012 versus the year ago period. Its good earnings history satisfies the C and A criteria.
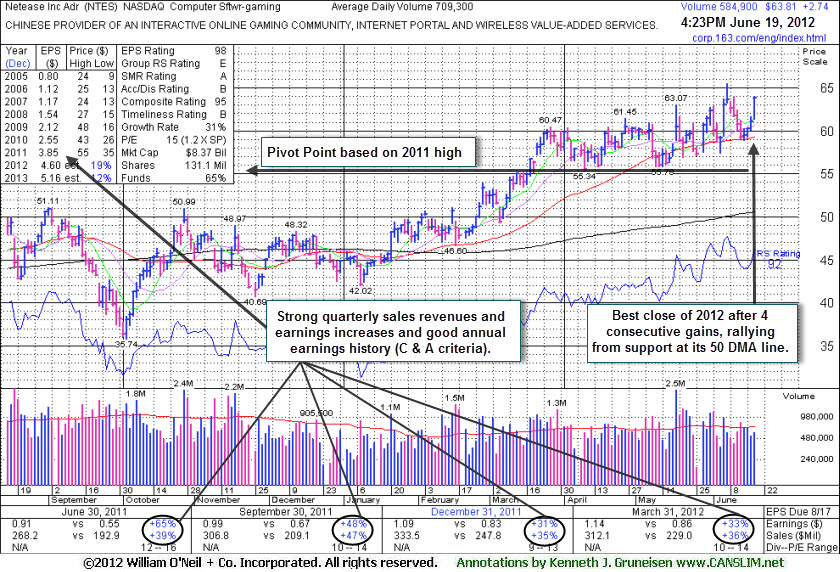
Netease.com Inc (NTES +$2.80 or +4.58% to $63.87) rallied today for its best 2012 close with a 4th consecutive gain. Its 50-day moving average (DMA) line defines near-term support and prior lows near the $55 area define the next important chart support to watch where violations may trigger a worrisome technical sell signals. It has not formed a sound base pattern. No overhead supply remains to act as resistance, however it has made only limited price progress above its 2011 highs in the $55 area in recent months, including a time when market action was more favorable. It was featured in yellow at $56.18 in the 3/19/12 mid-day report (read here) with a pivot point based on its 4/19/11 high plus 10 cents.
Its last appearance in this FSU section was on 5/24/12 with an annotated graph under the headline, "Distributional Pressure a Problem After Limited Progress". The number of top-rated funds owning its shares rose from 237 in Dec '11 to 250 in Mar '12, a somewhat reassuring improvement concerning the I criteria. Fundamentals remain healthy as it reported earnings +33% on +36% sales revenues for the quarter ended March 31, 2012 versus the year ago period. Its good earnings history satisfies the C and A criteria.
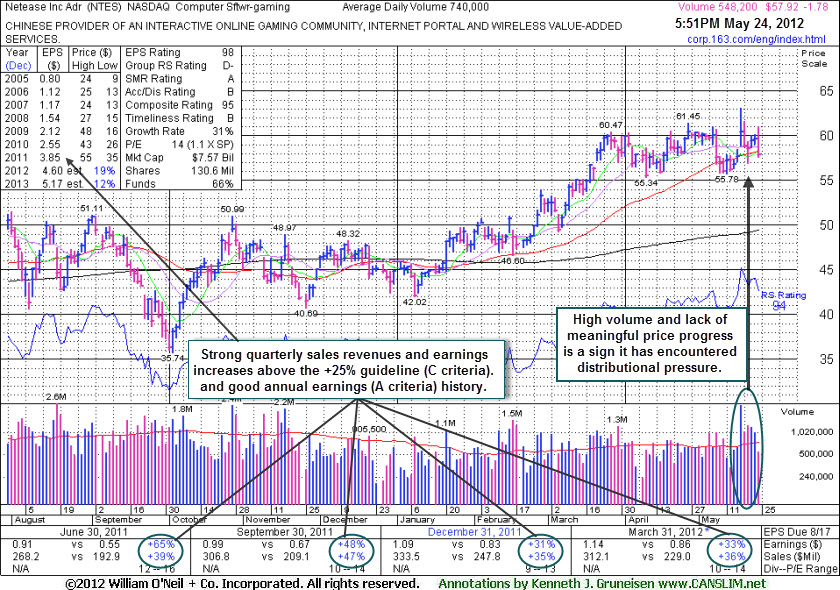
Netease.com Inc (NTES -$1.78 or -2.98% to $57.92) suffered a small loss on light volume as it closed below its 50-day moving average (DMA) line again today. There were 2 losing sessions with above average volume after its big volume-driven gain on 5/17/12 for a new 52-week high. Prior analysis stated that the stock had not formed a sound base pattern. No overhead supply remains to act as resistance, however it has made only limited price progress above its 2011 highs in the $55 area in recent months, including a time when market action was more favorable. Recent lows near the $55 area define important near-term chart support to watch, where any violation could trigger a worrisome technical sell signal.
The heavy volume without meaningful price progress in recent weeks is a sign that it has been encountering distributional pressure. Another concern is the waning number of top-rated funds owning its shares, which fell from 263 in Jun '11 to 257 in Mar '12, not a reassuring trend concerning the I criteria. Fundamentals remain healthy as it reported earnings +33% on +36% sales revenues for the quarter ended March 31, 2012 versus the year ago period. Its good earnings history satisfies the C and A criteria.
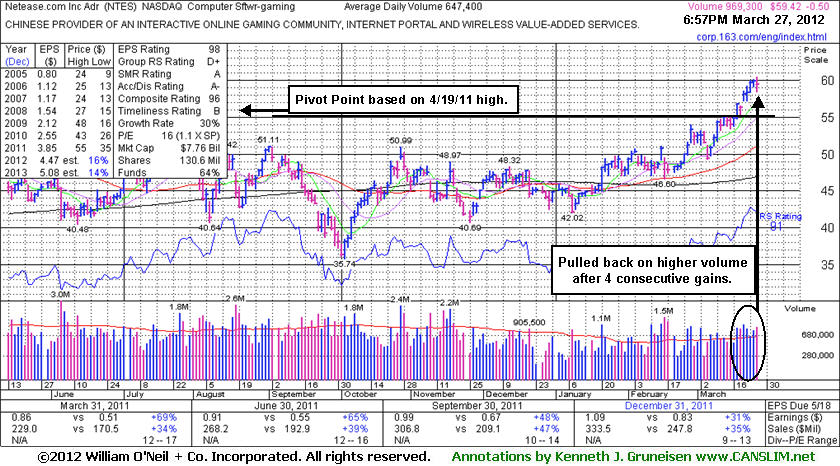
Its last appearance in this FSU section was on 3/27/12 with an annotated graph under the headline, "Winning Streak Leaves Leader Extended Above "Max Buy" Level", after a streak of 4 consecutive volume-driven gains into new high territory above the $60 level. It was featured in yellow at $56.18 in the 3/19/12 mid-day report (read here) with a pivot point based on its 4/19/11 high plus 10 cents.
Long ago, its last appearance in this FSU section was on 10/09/09 with an annotated graph under the headline, "Weakness Prompts Removal From Featured Stocks List After 80% Gain In 6 Months", when clear signs of distributional pressure were noted. Based on weak technical action it was dropped from the Featured Stocks list then, and it went on to fall from around $36 to $26 over the next 6 months before eventually rebounding back to new highs in 2011.
Fundamentally, its past 6 quarterly comparisons through Dec '11 showed strong sales revenues and earnings increases above the +25% minimum guideline, easily satisfying the C criteria. It has also maintained a good annual earnings (A criteria). One concern is the waning number of top-rated funds owning its shares, which fell from 274 in Mar '11 to 240 in Dec '11, not a reassuring trend concerning the I criteria. However, its current Up/Down Volume Ratio of 2.3 suggests that its shares have been under accumulation over the past 50 days.
Disciplined investors avoid chasing extended stocks that have rallied more than +5% above their pivot point, and the always limit losses if ever any stock falls more than -7% from their buy point.
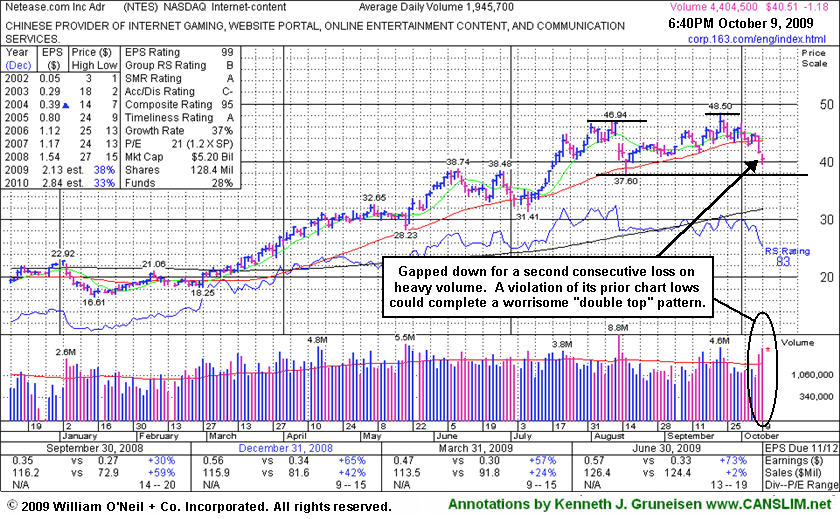
Netease.com Inc (NTES -$1.18 or -2.91% to $40.51) gapped down today, falling hard for a second day in a row with more than twice average volume, a clear sign of distributional pressure. Based on weak technical action it will be dropped from the Featured Stocks list tonight. The high-ranked Internet - Content firm traded up more than +80% following its appearance at $26.85 in the April 2009 issue of the monthly newsletter, CANSLIM.net News (read here). On 10/08/09 it triggered a technical sell signal with its loss on above average volume that more decisively violated its 50 DMA line and the upward trendline connecting its July-September chart lows. After encountering heavy distributional pressure in August, NTES had made an admirable stand above its 50 DMA line and prior chart highs in the $38 area. Now, any subsequent deterioration under its August lows could complete a worrisome "double top" pattern which would have additional bearish implications. Its color code was changed to green on 9/30/09 based on having promptly negating its latest breakout and then trading more than -7% below its pivot point.
Its last appearance in this FSU section under the headline, "Encountered Prompt Resistance When Rising From Late-Stage Base", included an annotated graph showing it falling toward important support at its upward trendline and its 50-day moving average (DMA) line where it was said "violations would raise concerns and trigger sell signals." Since then it technically broke down and it has failed to produce gains with anything other than light volume behind them. Now it would need to promptly rebound above its short-term average for its outlook to improve and possibly return to the Featured Stocks list.
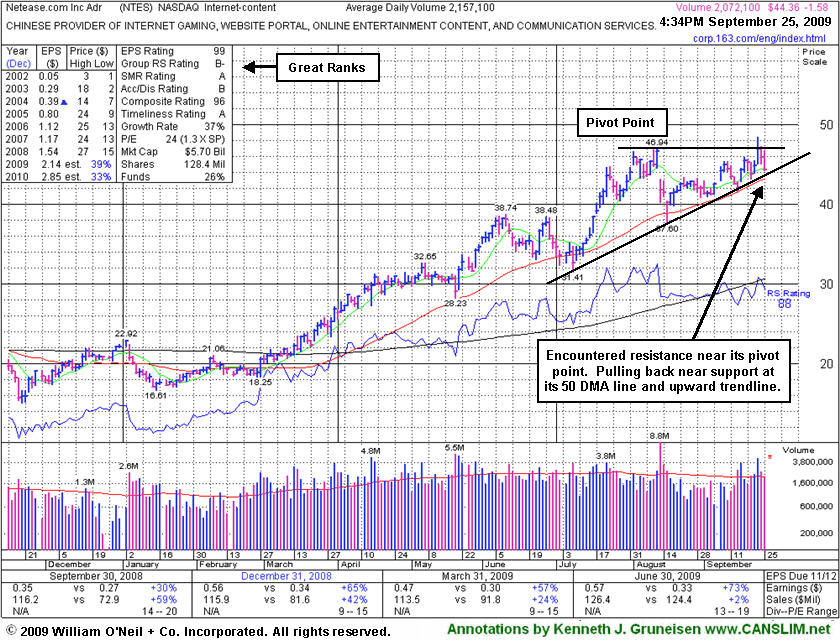
Netease.com Inc (NTES -$1.58 or -3.55% to $44.36) encountered resistance and promptly pulled back this week under its latest pivot point. That could be a sign it is due to spend more time consolidating after already rallying this year from lows in the mid-teens. Keep in mind that this may be considered a late-stage base now, which has been noted as a riskier and more failure prone set-up. Meanwhile, important support is at its upward trendline and its 50-day moving average (DMA) line, where violations would raise concerns and trigger sell signals. After encountering heavy distributional pressure in August, NTES made an admirable stand above its 50 DMA line and prior chart highs in the $38 area. The high-ranked Internet - Content firm traded up more than +74.8% following its appearance in the April 2009 issue of the monthly newsletter, CANSLIM.net News (read here).
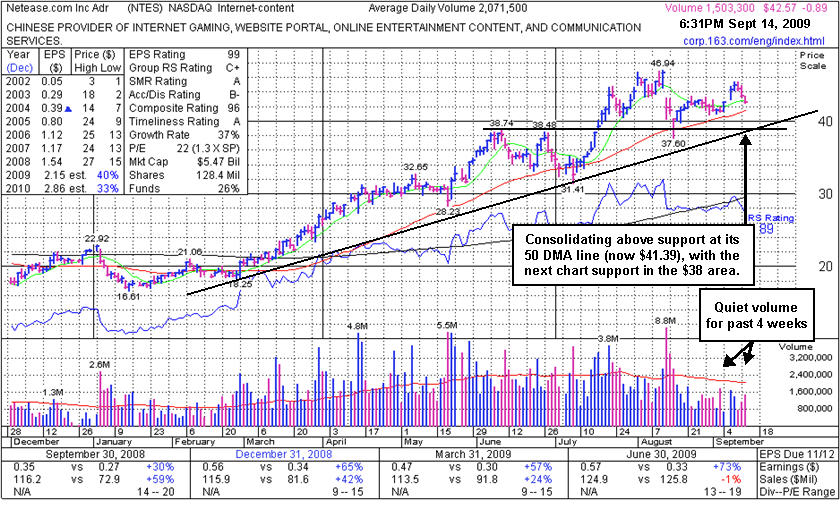
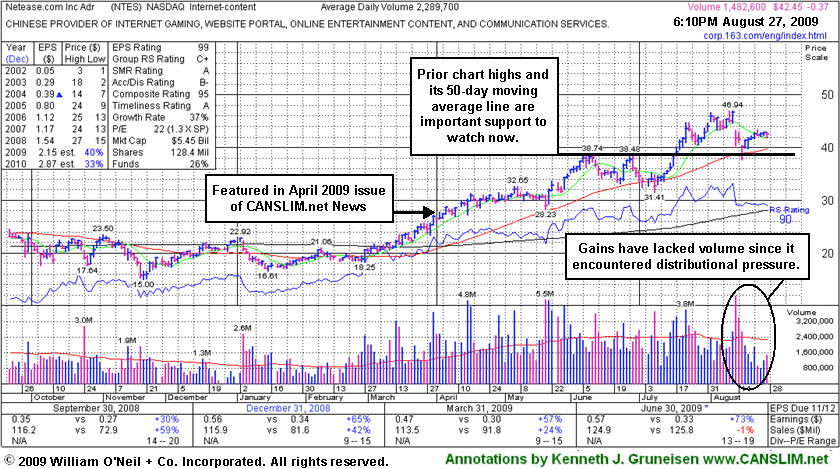
Netease.com Inc (NTES -$0.89 or -2.09% to $42.57) has seen volume totals drying up while recently consolidating in a healthy fashion above support at its 50-day moving average (DMA) line. However, gains with heavy volume really have not shown up since mid-July, revealing a lack of buying demand from the institutional crowd. Meanwhile the light volume totals of late may also be seen as a somewhat encouraging sign that distributional pressure has subsided since shortly after it was shown in this section on 8/13/09 (when 8.7 million shares traded) under the headline "Gap Down Loss on Heavy Volume Triggers Sell Signal" (read here). The market's negative reaction was due to the fact that sales revenues for the quarter ended June 30, 2009 were reported at -1% versus the year ago period, which was a continuation of its steady sequential deceleration in sales revenues increases from +79%, +59%, +42% in the Jun, Sep, Dec '08 comparisons and +24% in Mar '09.
Gaps are often a dead giveaway that large institutional investors (the I criteria) are rushing in one direction, and it was described as "an especially ominous sign, after a considerable run up, when a stock experiences its biggest point loss on the highest volume ever." However, NTES has made an admirable stand above important chart support since the prior review in this FSU section. Below its 50 DMA line, the nearby chart support at prior highs and a longer-term upward trendline help to define an important support level in the $38 area where any violation would raise more serious concerns and trigger more worrisome technical sell signals. The high-ranked Internet - Content firm traded up as much as +74.8% following its appearance in the April 2009 issue of the monthly newsletter, CANSLIM.net News (read here).
Netease.com Inc (NTES -$0.37 or -0.87% to $42.45) has seen volume totals drying up while recently consolidating in a tight range above support at its 50-day moving average (DMA) line. Gains have lacked volume since it encountered that heavy dose of distributional pressure and it was last shown in this section on 8/13/09 under the headline "Gap Down Loss on Heavy Volume Triggers Sell Signal" (read here). The market's negative reaction was due to the fact that sales revenues for the quarter ended June 30, 2009 were reported at -1% versus the year ago period, which was a continuation of its steady sequential deceleration in sales revenues increases from +79%, +59%, +42% in the Jun, Sep, Dec '08 comparisons and +24% in Mar '09.
Gaps are often a dead giveaway that large institutional investors (the I criteria) are rushing in one direction. In this case, the weak technical action was considered an early sell signal. Any subsequent losses below its 50 DMA line or prior chart highs in the $38 area would raise more serious concerns and trigger additional sell signals. It was also noted before as "an especially ominous sign, after a considerable run up, when a stock experiences its biggest point loss on the highest volume ever." There is not a number by its 8/13/09 volume spike, but that day's considerable loss came as 8.7 million shares traded! NTES traded up as much as +74.8% following its appearance in the April 2009 issue of the monthly newsletter, CANSLIM.net News (read here).
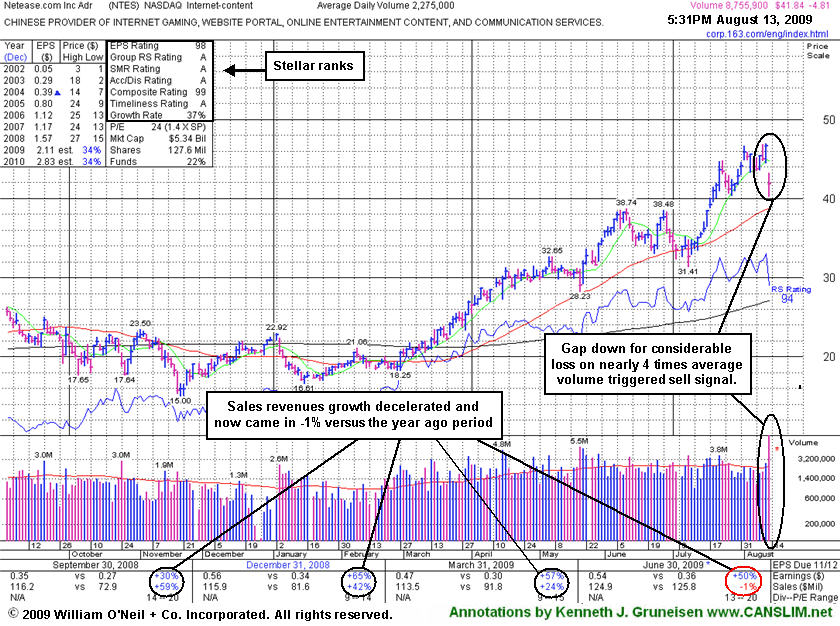
Netease.com Inc (NTES -$4.81 or -10.31% to $41.84) gapped down today after reporting results for the quarter ended June 30, 2009 which showed a +50% earnings per share increase. The market's negative reaction was likely due to the fact that sales revenues were reported at -1% versus the year ago period, which was a continuation of its steady sequential deceleration in sales revenues increases from +79%, +59%, +42% in the Jun, Sep, Dec '08 comparisons and +24% in Mar '09. Gaps are often a dead giveaway that large institutional investors are rushing in one direction. In this case, the weak technical action may be considered an early sell signal while it is diving toward the nearest chart support at its pivot point, 50 DMA line, and prior chart highs, all of which come into play in the $39 area.
It is an especially ominous sign, after a considerable run up, when a stock experiences its biggest point loss on the highest volume ever. Today's action fits that description, which raises a big red flag! The prior NTES appearance in this FSU section on 8/10/09 was framed up under the headline "Chinese Internet Content Firm Is Extended From Sound Base" and included the remark that, "Caution is advised because it is extended from its latest base" (read here). Disciplined investors know to avoid chasing any stock and buying it more than +5% above its pivot point. Those investors who were reckless and made sloppy buys should take note that, even after today's considerable loss, the stock still ended the day above the "max buy" level that was cited in prior reports.
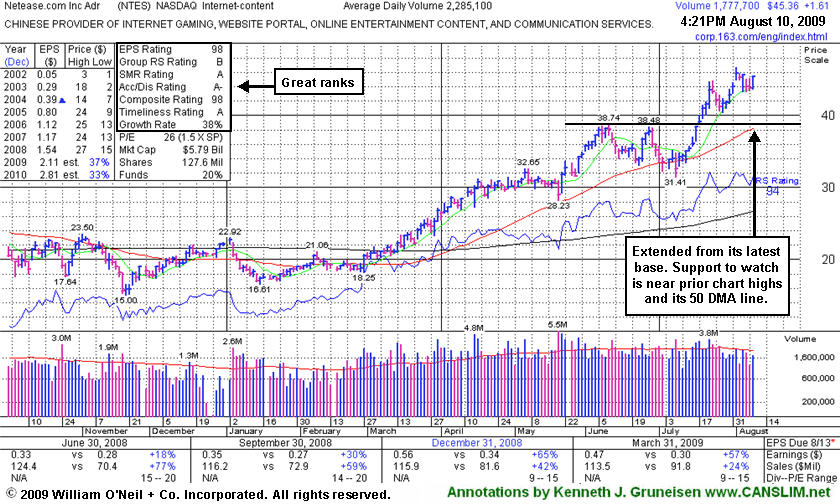
Netease.com Inc (NTES +$1.61 or +3.68% to $45.36) closed with a gain on below average volume today. Caution is advised because it is extended from its latest base. Support to watch is near prior chart highs and its 50-day moving average (DMA) line, both of which coincide near the $38 level. Its most recent gains have lacked great volume conviction. On 7/22/09, when it finally produced a considerable gain on +52% above average volume (above the minimum volume guideline for buyable breakouts) it had already rallied above its "max buy" level. That means it was hard or impossible for disciplined investors to justify buying this high-ranked Chinese Internet - Content firm since its color code was changed to yellow with a new pivot point cited in the 7/17/09 Mid-Day Breakouts Report (read here). At that time, it managed to break out from a 5-week flat base but it was noted for the fact that it came with only +44% above average volume, below the investment system's guidelines for a proper technical buy signal.
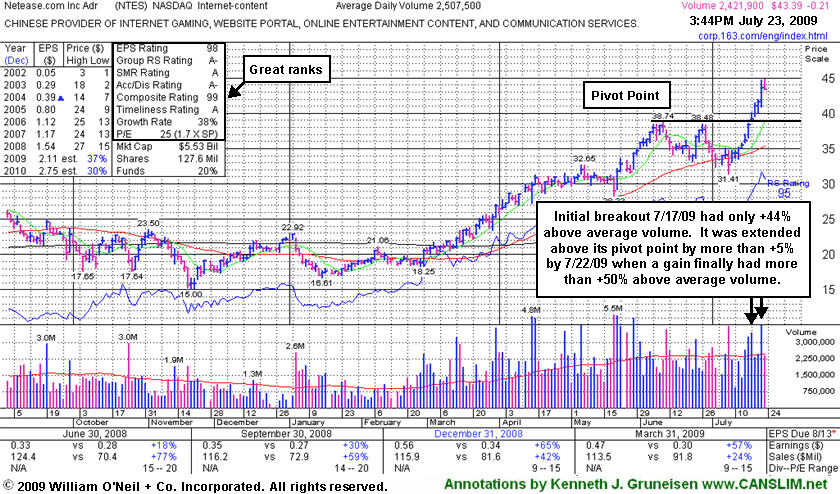
Netease.com Inc (NTES -$0.21 or -0.69% to $43.39) closed with a small loss on light volume today, breaking a streak of 10 consecutive gains that helped it get extended from its latest base. Its color code has been changed to green after an impressive winning streak was capped off with a considerable gain yesterday on +52% above average volume that lifted it well above its "max buy" level. After enduring some distribution, but finding support near its 50-day moving average line, it began rebounding toward prior chart highs. Its color code was changed to yellow with a new pivot point cited in the 7/17/09 Mid-Day Breakouts Report (read here). That day's breakout from a 5-week flat base came with only +44% above average volume behind its gain, below the guideline for a proper buy signal. The stock was extended more than +5% above its pivot point by 7/22/09 when a gain finally had more than the minimum +50% above average volume. That illustrates how making a disciplined entry was quite challenging or impossible for investors. However, patience may allow shares to be accumulated on light volume pullbacks toward prior chart highs in the $38 area which are now a very important technical support level to watch.
The number of top-rated funds owning an interest in its shares increased from 18 in June '08 to 78 in June '09, which is very reassuring news in respect to the I criteria. NTES was first featured at $26.75 in the 3/31/09 Mid-Day Breakouts Report (read here). This high-ranked Chinese Internet - Content firm was also summarized in greater detail including an annotated graph in the April 2009 issue of CANSLIM.net News (read here).
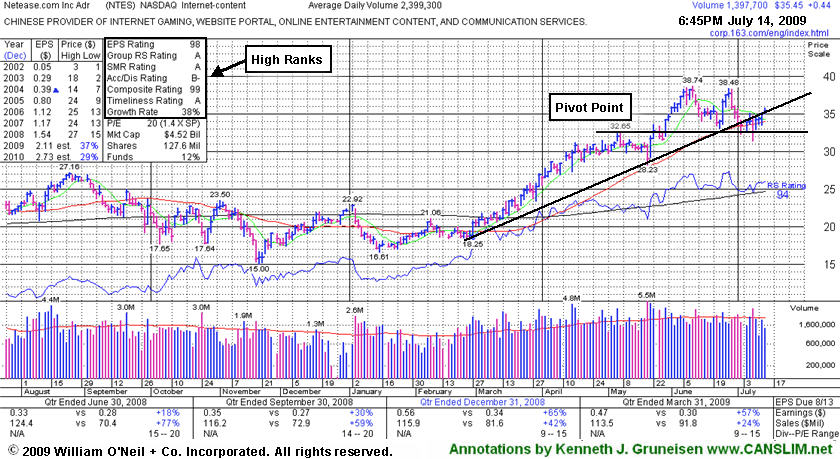
Netease.com Inc (NTES +$0.44 or +1.26% to $35.45) rose on light volume as it posted a fourth consecutive gain, closing above its 50-day moving average (DMA) line. It was recently noted after a worrisome violation of a multi-month upward trendline occurred, and noted again when its considerable loss on 7/08/09 with above average volume led to a close below its 50 DMA line and triggered a technical sell signal. It found support in the neighborhood of prior chart highs near $32 which are an important technical support level to watch along with its 50 DMA line. It negated all gains since its 5/28/09 gap up and considerable gain with +79% above average volume confirmed its last sound technical buy signal as it rose from a second-stage base. This high-ranked leader may need to spend more time consolidating before a sound new base such as a "double bottom" pattern might form and offer another ideal entry point. Meanwhile, deterioration leading it below recent lows and closing back in its previous base would raise more serious concerns and trigger additional technical sell signals.
The number of top-rated funds owning an interest in its shares increased from 18 in June '08 to 67 in March '09, which is very reassuring news in respect to the I criteria. NTES was first featured at $26.75 in the 3/31/09 CANSLIM.net Mid-Day Breakouts Report (read here). This high-ranked Chinese Internet - Content firm was also summarized in greater detail including an annotated graph in the April 2009 issue of CANSLIM.net News (read here).
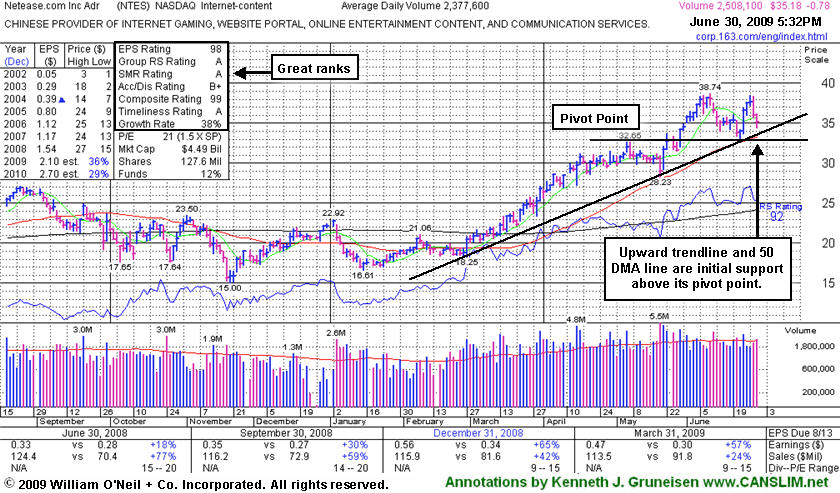
Netease.com Inc (NTES -$0.78 or -2.17% to $35.18) is consolidating above its 50-day moving average (DMA) line and an upward trendline connecting its chart lows in recent months. Those are important support levels to watch just above its most recent pivot point - which it rose above with its 5/28/09 gap up and considerable gain with +79% above average volume, confirming a technical buy signal from a second-stage base. This a high-ranked leader may need to spend more time consolidating before a sound new base might form and offer another ideal entry point. Meanwhile, subsequent violations of support might prompt investors with a profitable interest in NTES to lock in their profits. Deterioration back into its prior base would obviously raise concerns and trigger technical sell signals.
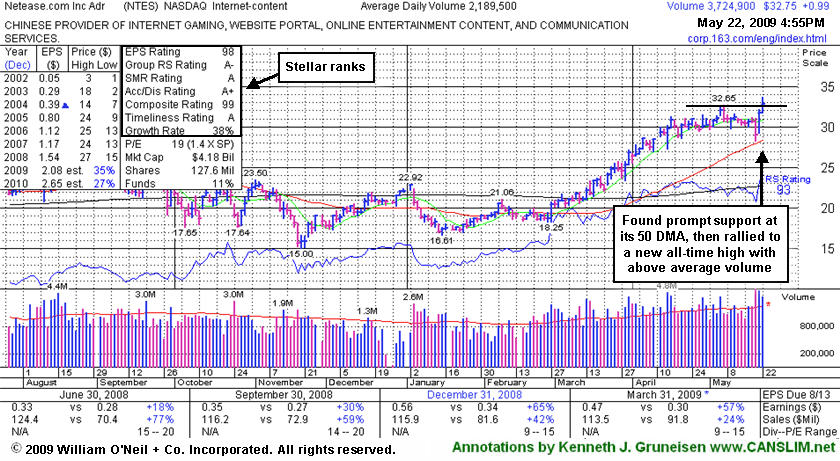
Indications of institutional buying demand have been noted after earnings news on 5/20/09 caused a "shakeout" that tested support near its 50 DMA line -and it found prompt support near that short-term average. The number of top-rated funds owning an interest in its shares increased from 18 in June '08 to 67 in March '09, which is very reassuring news in respect to the I criteria. In its last appearance in this Featured Stock Update section on June 19th an annotated graph helped investors identify support under the headline "Prior Highs and 50 DMA Line Are Important Support To Watch" (read here). NTES was first featured at $26.75 in the 3/31/09 CANSLIM.net Mid-Day Breakouts Report (read here). This high-ranked Chinese Internet - Content firm was also summarized in greater detail including an annotated graph in the April 2009 issue of CANSLIM.net News (read here).
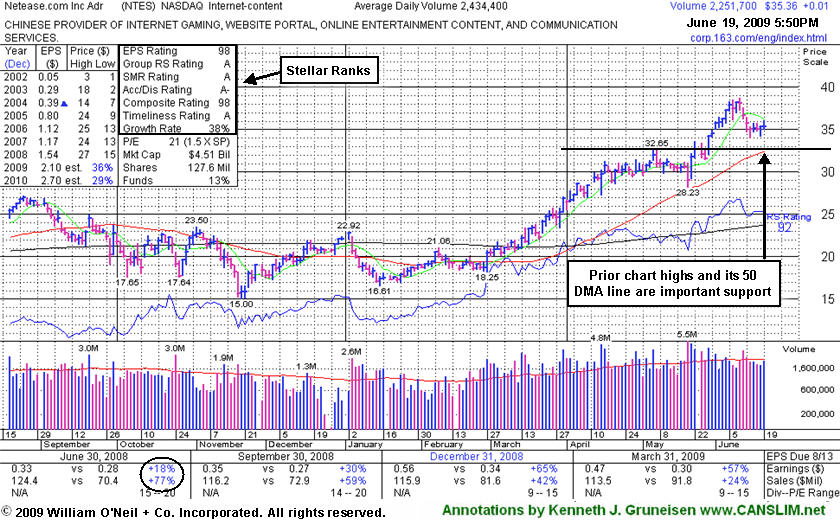
Netease.com Inc (NTES +$0.01 or +0.03% to $35.36) is a high-ranked leader that is consolidating and still a bit too extended from its second-stage base. Prior chart highs and its 50-day moving average (DMA) line (both near $32) are an important support level to watch on pullbacks. Subsequent violations might prompt investors with a profitable interest in NTES to lock in profits. Deterioration back into its prior base would obviously raise concerns and trigger technical sell signals.
The number of top-rated funds owning an interest in its shares increased from 18 in June '08 to 68 in March '09, which is very reassuring news in respect to the I criteria. NTES was first featured at $26.75 in the 3/31/09 CANSLIM.net Mid-Day Breakouts Report (read here). A considerable gain with above average volume on 5/21/09 was noted as an indication of prompt institutional support, and its color code was then changed to yellow with a new pivot point of $32.75 based upon its 5/07/09 high plus .10. It found support at its 50-day moving average (DMA) line on 5/20/09 after consolidating in a tight range for several weeks following a previous steady advance into new all-time high territory. This high-ranked Chinese Internet - Content firm was also summarized in greater detail including an annotated graph in the April 2009 issue of CANSLIM.net News (read here).
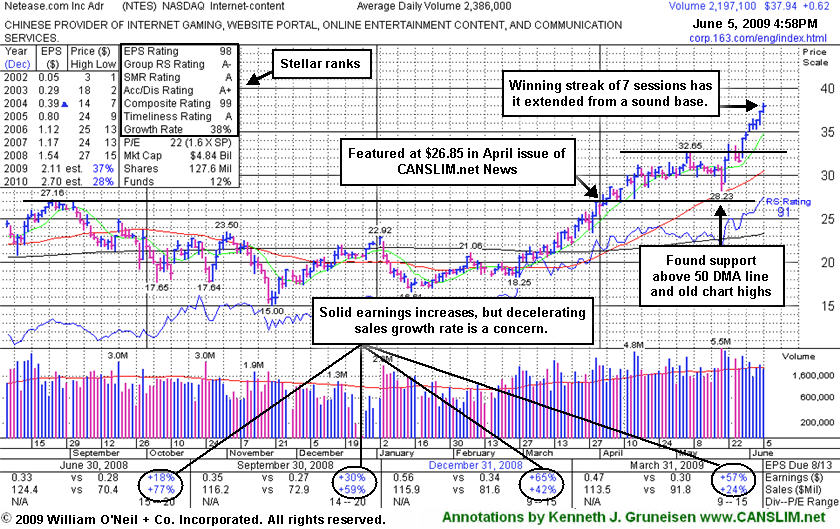
Netease.com Inc (NTES +$0.62 or +1.66% to $37.94) hit another new all-time high today while extending its winning streak to 7 sessions. Disciplined investors avoid chasing stocks that get more than +5% above their pivot point, and it is extended from a sound base now -so it is outside of the investment system's guidelines for any new buying efforts to be justified! In fact, investors with a profitable interest in NTES to protect would be wise to watch closely for future sell signals which could prompt them to lock in profits. Technically, its prior chart highs are now a critical support level to watch, and any subsequent deterioration back into its prior base would obviously raise concerns and trigger technical sell signals.
A considerable gain with above average volume on 5/21/09 was noted as an indication of prompt institutional (the I criteria) support, and its color code was then changed to yellow with a new pivot point of $32.75 based upon its 5/07/09 high plus .10. This followed its first test of support at its 50-day moving average (DMA) line on 5/20/09 after consolidating in a tight range for several weeks following a previous steady advance into new all-time high territory. NTES was first featured at $26.75 in the 3/31/09 CANSLIM.net Mid-Day Breakouts Report (read here). This high-ranked Chinese Internet - Content firm was also summarized in greater detail including an annotated graph in the April 2009 issue of CANSLIM.net News (read here). The number of top-rated funds owning an interest in its shares increased from 18 in June '08 to 66 in March '09, which is very reassuring news in that department.
Netease.com Inc (NTES $0.99 or +3.12% to $32.75) hit a new all-time high today with a gain backed by +72% above average volume, a bullish sign of institutional accumulation. A considerable gain with above average volume on 5/21/09 was noted as an indication of prompt institutional (the I criteria) support. In fact, the number of top-rated funds owning an interest in its shares rose from 18 in June '08 to 66 in March '09, which is very reassuring news in that department.
Following its latest quarterly earnings news, a shakeout on 5/20/09 tested support near its 50-day moving average (DMA) line after trading in a tight range for several weeks. Its color code was changed to yellow with new pivot point and max buy levels noted. Its first test of support at its 50 DMA since triggering earlier buy signals may be considered a proper secondary buy point for disciplined investors. Disciplined investors avoid chasing stocks that get more than +5% above their pivot point. NTES was first featured at $26.75 in the 3/31/09 CANSLIM.net Mid-Day Breakouts Report (read here). This high-ranked Chinese Internet - Content firm was also summarized in greater detail including an annotated graph in the April 2009 issue of CANSLIM.net News (read here).
C A N S L I M | StockTalk | News | Chart | SEC | Zacks Reports | ![]()
![]()
![]()
View all notes | Alert me of new notes | CANSLIM.net Company Profile
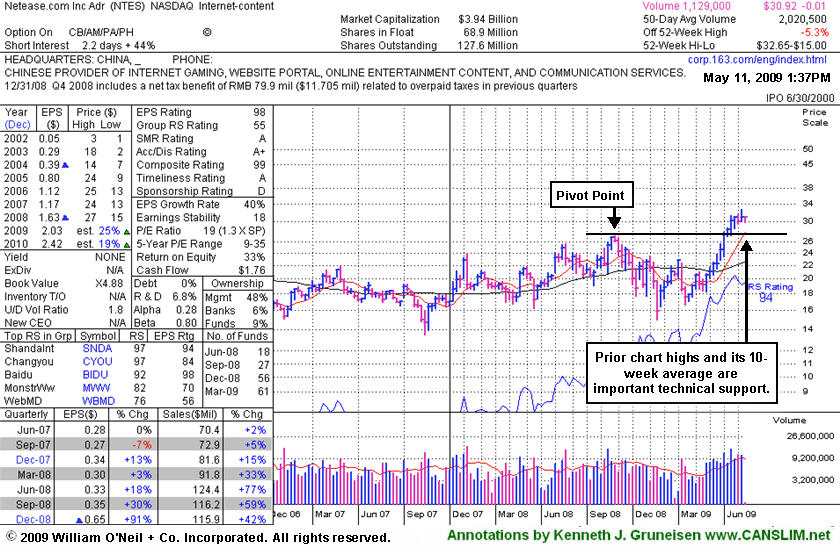
Netease.com Inc (NTES +$0.03 or +0.10% to $30.96) positively reversed today (chart data as of 1:37pm as noted). The weekly chart below shows how it has been consolidating in a tight range the past few weeks and it remains near all-time highs. A pullback to its 10-week average could offer patient investors a secondary buy point. The old chart highs and 10-week average are now a critical support level to watch.
NTES was first featured at $26.75 in the 3/31/09 CANSLIM.net Mid-Day Breakouts Report (read here). This high-ranked Chinese Internet - Content firm was summarized in greater detail including an annotated graph in the April 2009 issue of CANSLIM.net News (read here). Its considerable gain on 4/06/09 with volume +65% above its average volume as it rose above its pivot point was noted as it triggered a technical buy signal. It was then noted that overhead supply was no longer a concern to provide any resistance, and there had been limited signs of institutional selling (distribution).
Of the few favorable looking leaders showing up in recent CANSLIM.net reports, Chinese firms have obviously enjoyed a heavy weighting. Caution is advised due to the inherent risks when investing with international exposure, as geo-political news or events can occasionally be expected to whip the entire group of foreign stocks drastically down or up. The current leadership is noted in certain China-linked stocks, and this could be an ongoing phenomenon. Investors are reminded to make disciplined buys and sells always.
C A N S L I M | StockTalk | News | Chart | SEC | Zacks Reports | ![]()
![]()
![]()
View all notes | Alert me of new notes | CANSLIM.net Company Profile
Netease.com Inc (NTES -$0.66 or -2.14% to $30.25) ended with a loss on average volume after a small gap down today. Its 9-week winning streak leaves it extended from a proper base, so it is not buyable now under the investment system's guidelines. It has held its ground since it last appeared on 4/17/09 in this Featured Stock Update section under the headline "Outlier Extends Winning Streak To 8th Week" (read here).
NTES was first featured at $26.75 in the 3/31/09 CANSLIM.net Mid-Day Breakouts Report (read here). This high-ranked Chinese Internet - Content firm was summarized in greater detail including an annotated graph in the April 2009 issue of CANSLIM.net News (read here). Its considerable gain on 4/06/09 with volume +65% above its average volume as it rose above its pivot point was noted as it triggered a technical buy signal. It was then noted that overhead supply was no longer a concern to provide any resistance, and there had been limited signs of institutional selling (distribution).
Of the few favorable looking leaders showing up in recent CANSLIM.net reports, Chinese firms have obviously enjoyed a heavy weighting. Caution is advised due to the inherent risks when investing with international exposure, as geo-political news or events can occasionally be expected to whip the entire group of foreign stocks drastically down or up. The current leadership is noted in certain China-linked stocks, and this could be an ongoing phenomenon. Investors are reminded to make disciplined buys and sells always.
C A N S L I M | StockTalk | News | Chart | SEC | Zacks Reports | ![]()
![]()
![]()
View all notes | Alert me of new notes | CANSLIM.net Company Profile
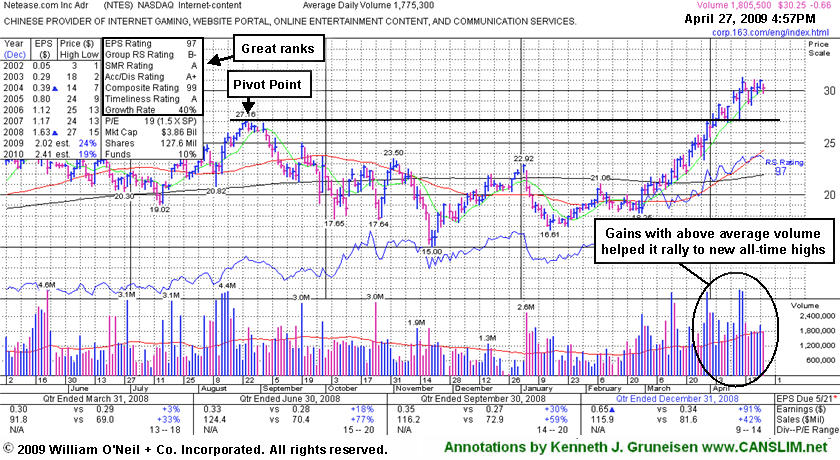
Netease.com Inc (NTES -$0.68 or -2.21% to $30.12) is extended from a proper base, which puts it outside of the guidelines as a buy candidate for disciplined investors now. An annotated weekly chart highlighted its 6-week winning streak when it last appeared on 4/06/09 in this Featured Stock Update section under the headline "Above Average Volume Behind Gains As Outlier Breaks Out" (read here). Its considerable gain with volume +65% above its average volume as it rose above its pivot point had triggered a technical buy signal. At that time it was noted that overhead supply was no longer a concern to provide any resistance, and there had been limited signs of institutional selling (distribution). The same holds true now, as it extends its winning streak to an 8th week. NTES was first featured at $26.75 in the 3/31/09 CANSLIM.net Mid-Day Breakouts Report (read here). This high-ranked Chinese Internet - Content firm was summarized in greater detail including an annotated graph in the April 2009 issue of CANSLIM.net News (read here).
Of the few favorable looking leaders showing up in recent CANSLIM.net reports, Chinese firms have obviously enjoyed a heavy weighting. Caution is advised due to the inherent risks when investing with international exposure, as geo-political news or events can occasionally be expected to whip the entire group of foreign stocks drastically down or up. The current leadership is noted in certain China-linked stocks, and this could be an ongoing phenomenon. Investors are reminded to make disciplined buys and sells always.
C A N S L I M | StockTalk | News | Chart | SEC | Zacks Reports | ![]()
![]()
![]()
View all notes | Alert me of new notes | CANSLIM.net Company Profile
Netease.com Inc (NTES +$1.34 or +4.91% to $28.60) posted a considerable gain with above average volume as it rose above its pivot point, triggering a technical buy signal. The mostly negative session featured few other strong leaders, making NTES an obvious outlier in a rally marked by thin leadership. Now there is virtually no overhead supply to act as resistance, and there have been limited signs of institutional selling (distribution), which is a healthy sign. However, disciplined investors avoid chasing stocks that are too extended, and NTES ended the session nearly +5% above its pivot point cited, leaving it near its "max buy" level under the investment system's guidelines.
It was first featured at $26.75 in the 3/31/09 CANSLIM.net Mid-Day Breakouts Report (read here). This high-ranked Chinese Internet - Content firm was summarized in greater detail including an annotated graph in the April 2009 issue of CANSLIM.net News (read here). The weekly graph annotated below shows its streak of steady gains backed by above average volume, a very healthy volume pattern as it rose above a multi-year resistance level in the $25-27 area. It has been showing bullish action since mid-March (3/13 & 3/17) where one could argue it cleared an earlier pivot point (shown above), however that was not cited in prior CANSLIM.net reports.
C A N S L I M | StockTalk | News | Chart | SEC | Zacks Reports | ![]()
![]()
![]()
View all notes | Alert me of new notes | CANSLIM.net Company Profile
| Netease.com, Inc. |
| |
|
Ticker Symbol: NTES (NASDAQ) |
Industry Group: Internet-Content |
Shares Outstanding: 127,600,000 |
|
Price: $26.85 3/31/09 |
Day's Volume: 3,709,800 3/31/2009 |
Shares in Float: 68,900,000 |
|
52 Week High: $27.16 8/29/08 |
50-Day Average Volume: 1,280,800 |
Up/Down Volume Ratio: 1.5 |
|
Pivot Point: $27.26 8/29/08 high plus .10 |
Pivot Point +5% = Max Buy Price: $28.62 |
Web Address: http://corp.163.com/eng/index.html |
C A N S L I M | StockTalk | News | Chart | SEC | Zacks Reports | ![]()
![]()
![]()
View all notes | Alert me of new notes | CANSLIM.net Company Profile
CANSLIM.net Profile: NetEase.com, Inc., through its subsidiaries, operates an online community in China. It operates in three segments: Online Game Services, Advertising Services, and Wireless Value-added Services and Others. NetEase.com, Inc. was founded in 1997 and is based in Beijing, the People's Republic of China. The stock resides in the Internet-Content group which is presently ranked 51st on the 197 Industry Groups list which is just outside the much-preferred top quartile of groups, however there are other high-ranked leaders in this group including, Shanda Interactive (SNDA), and Bidu.com (BIDU), which help to satisfy the L criteria. The number of top-rated funds with an ownership interest has grown from 13 funds in March '08 to 54 funds as of Dec '08, a sign of increasing institutional interest (the I criteria). Its annual earnings (the A criteria) growth record has been great, and sales revenues growth has been strong while its 2 most recent quarterly comparisons showed increases better than the +25% guideline.
What to Look For and What to Look Out For: Look for the stock to confirm a new technical buy signal by breaking out to new all-time highs and closing above its $27.16 pivot point with gains on heavy volume in the coming days and weeks. The market conditions are still somewhat questionable, largely due to the lack of leadership. Pyramiding in can let the stock's action do the deciding for you, and if you are unclear on the approach as outlined in the book "How to Make Money in Stocks" it could be a good idea to dust off your old copy and review. Remember that to trigger a proper technical buy signal it is imperative to see volume surpass the necessary threshold (+50% above average volume is the minimum guideline, but preferably a breakout should come with much heavier than average volume) as any stock trades and closes above its pivot point. Until then, this high-ranked stock should remain on an active watchlist. If one considers the stock capable of making a many-fold rise in price, there should be no urge to jump in "early" without more reassuring price/volume confirmation. As always, it is of the utmost importance to sell a stock if it drops 7-8% below your purchase price.
Technical Analysis: The stock is currently forming the right side of its base and rising toward its August 2008 highs. It appeared featured in yellow in the March 31, 2009 CANSLIM.net Mid-Day BreakOuts Report (read here). The stock is now trading very near its pivot point on very healthy volume patterns, rising near the high end of a multi-year resistance level in the $25-27 area. Previously noted - "gains the past 5 weeks in a row were backed by above average volume." It has been showing bullish action since mid-March (3/13 & 3/17) where one could argue it cleared an earlier pivot point (shown above), however that was not cited in prior CANSLIM.net reports. Now there is virtually no overhead supply to act as resistance, and there have been limited signs of institutional selling (distribution), which is a healthy sign.