There are 2 more featured stock write-ups on since to 1/6/2025
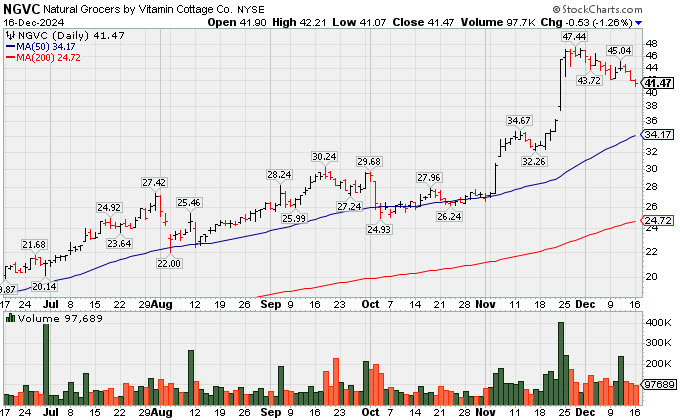
Consolidating After Considerable Rally to New Highs - Monday, December 16, 2024
Natural Grocers (NGVC) has been consolidating after rallying to a new all-time high and it is extended from any sound base. Its 50-day moving average (DMA) line ($34.24) defines initial support to watch above the prior high in the $30 area.The Retail-Super/Mini Markets group is currently ranked 88th on the 197 Industry Groups list. Top-rated funds owning an interest in the company's shares rose from 177 in Sep '23 to 215 in Sep '24, a reassuring sign concerning the I criteria. Its current Up/Down Volume Ratio of 1.8 provides an unbiased indication that its shares have been under slight accumulation over the past 50 days. Its small supply (S criteria) of only 22.8 million shares outstanding can contribute to greater price volatility in the event of institutional buying or selling.
Charts courtesy www.stockcharts.com
| Symbol/Exchange Company Name Industry Group | PRICE | CHANGE | Day High | Volume (% DAV) (% 50 day avg vol) | 52 Wk Hi | Featured Date | Price Featured | Pivot Featured |
| Max Buy | ||||||||
U.S. Lime & Minerals Bldg-Cement/Concrt/Ag | $144.01 | -1.93 -1.32% | $147.38 | 74,855 50 DAV is 95,000 | $159.53 -9.73% | 9/17/2024 | $71.26 | PP = $87.23 |
| MB = $91.59 | ||||||||
G - Consolidating in an orderly fashion near its all-time high. Its 50 DMA line ($128) defines important near-term support to watch on pullbacks. It has been noted repeatedly as - "Very extended from any sound base". >>> FEATURED STOCK ARTICLE : Extended From Any Sound Base After Impressive Rally - 11/12/2024 | View all notes | Set NEW NOTE alert | Company Profile | SEC News | Chart | Request a new note | ||||||||
Granite Construction Bldg-Heavy Construction | $93.26 | -0.18 -0.19% | $95.28 | 522,776 50 DAV is 637,000 | $105.20 -11.35% | 6/11/2024 | $59.76 | PP = $64.33 |
| MB = $67.55 | ||||||||
| Most Recent Note - 12/13/2024 6:58:17 PM G - Pulled back today for its 6th loss in the span of 8 sessions, slumping from its all-time high toward its 50 DMA line ($90.72). Reported Sep ''24 quarterly earnings +19% on +14% sales revenues versus the year-ago period, repeatedly noted as "below the +25% minimum guideline (C criteria) of the fact-based investment system." >>> FEATURED STOCK ARTICLE : Negative Reversal After Hitting New All-Time High - 12/6/2024 | View all notes | Set NEW NOTE alert | Company Profile | SEC News | Chart | Request a new note | ||||||||
Texas Roadhouse Retail-Restaurants | $187.45 | +0.59 0.32% | $189.60 | 517,628 50 DAV is 692,000 | $206.04 -9.02% | 7/26/2024 | $173.08 | PP = $175.82 |
| MB = $184.61 | ||||||||
| Most Recent Note - 12/13/2024 7:01:43 PM G - Quietly slumped below its 50 DMA line ($190) raising concerns with its 3rd consecutive loss backed by light volume. A prompt rebound above the 50 DMA line is needed for its outlook to improve. >>> FEATURED STOCK ARTICLE : Hovering Near High After Recent Volume-driven Gains - 11/15/2024 | View all notes | Set NEW NOTE alert | Company Profile | SEC News | Chart | Request a new note | ||||||||
Howmet Aerospace Aerospace/Defense | $113.41 | -0.02 -0.02% | $114.31 | 1,329,991 50 DAV is 2,307,000 | $120.71 -6.05% | 7/30/2024 | $93.95 | PP = $85.52 |
| MB = $89.80 | ||||||||
| Most Recent Note - 12/12/2024 9:05:36 PM G - Pulled back today with lighter volume. Retreating from its all-time high after getting extended from any sound base. Its prior high ($106.93 on 10/21/24) and 50 DMA line ($109.47) define near-term support levels to watch on pullbacks. Fundamentals remain strong. >>> FEATURED STOCK ARTICLE : Extended From Prior Base and Perched at High - 12/5/2024 | View all notes | Set NEW NOTE alert | Company Profile | SEC News | Chart | Request a new note | ||||||||
Natural Grocers Retail-Super/Mini Mkts | $41.53 | -0.47 -1.12% | $42.21 | 117,209 50 DAV is 102,000 | $47.57 -12.70% | 11/5/2024 | $30.57 | PP = $30.42 |
| MB = $31.94 | ||||||||
G - Pulled back for a 3rd consecutive loss, retreating from its all-time high after getting very extended from any sound base. Reported Sep '24 quarterly earnings +50% on +9% sales revenues versus the year-ago period. Its 50 DMA line ($34.23) defines near-term support above prior highs in the $30 area. See the latest FSU analysis for more details and a new annotated graph.. >>> FEATURED STOCK ARTICLE : Consolidating After Considerable Rally to New Highs - 12/16/2024 | View all notes | Set NEW NOTE alert | Company Profile | SEC News | Chart | Request a new note | ||||||||
| Symbol/Exchange Company Name Industry Group | PRICE | CHANGE | Day High | Volume (% DAV) (% 50 day avg vol) | 52 Wk Hi | Featured Date | Price Featured | Pivot Featured |
| Max Buy | ||||||||
Celestica Elec-Contract Mfg | $99.03 | -0.17 -0.17% | $100.51 | 1,866,168 50 DAV is 2,520,000 | $99.34 -0.31% | 10/11/2024 | $57.62 | PP = $63.59 |
| MB = $66.77 | ||||||||
| Most Recent Note - 12/13/2024 7:08:58 PM G - Gapped up today and rallied with above-average volume to a new all-time high with its 3rd consecutive gain. It is very extended from any sound base. Its 50 DMA line ($76) defines initial support to watch on pullbacks. >>> FEATURED STOCK ARTICLE : Pulling Back After Considerable Rally - 11/13/2024 | View all notes | Set NEW NOTE alert | Company Profile | SEC News | Chart | Request a new note | ||||||||
Paymentus Holdings Finance-CrdtCard/PmtPr | $35.75 | +1.40 4.08% | $35.86 | 339,010 50 DAV is 410,000 | $38.94 -8.19% | 10/17/2024 | $26.15 | PP = $25.31 |
| MB = $26.58 | ||||||||
G - Consolidating well above its 50 DMA line ($29.68) which defines important near-term support to watch. It is extended from any sound base. >>> FEATURED STOCK ARTICLE : Extended From Prior Base After Considerable Spike Higher - 11/14/2024 | View all notes | Set NEW NOTE alert | Company Profile | SEC News | Chart | Request a new note | ||||||||
Resmed Inc HEALTH SERVICES - Medical Appliances and Equipment | $241.04 | +2.52 1.06% | $241.84 | 491,163 50 DAV is 905,100 | $260.49 -7.47% | 10/25/2024 | $256.64 | PP = $255.28 |
| MB = $268.04 | ||||||||
| Most Recent Note - 12/12/2024 9:08:38 PM G - Pulled back today with higher (near average) volume, sputtering near its 50 DMA line ($242). Its Relative Strength Rating has slumped to 73, below the 80+ minimum guideline for buy candidates, raisingb concerns. >>> FEATURED STOCK ARTICLE : Recent Slump Below 50-Day Moving Average Raised Concerns - 11/18/2024 | View all notes | Set NEW NOTE alert | Company Profile | SEC News | Chart | Request a new note | ||||||||
Adtalem Global Education Consumer Svcs-Education | $91.24 | +2.49 2.81% | $91.40 | 183,115 50 DAV is 348,000 | $92.93 -1.82% | 10/30/2024 | $83.34 | PP = $80.28 |
| MB = $84.29 | ||||||||
G - Consolidating in an orderly fashion near its all-time high. Its 50 DMA line ($83.20) defines initial support above prior highs in the $80 area. Fundamentals remain strong. >>> FEATURED STOCK ARTICLE : Hovering Near High With Volume Totals Cooling - 12/4/2024 | View all notes | Set NEW NOTE alert | Company Profile | SEC News | Chart | Request a new note | ||||||||
Tradeweb Markets Financial Svcs-Specialty | $133.57 | +2.07 1.57% | $133.94 | 663,695 50 DAV is 884,000 | $141.69 -5.73% | 11/19/2024 | $134.41 | PP = $136.23 |
| MB = $143.04 | ||||||||
| Most Recent Note - 12/13/2024 7:00:08 PM Y - Consolidating near its 50 DMA line ($132) after encountering distributional pressure. Since recently featured it has not produced a volume-driven gain above the pivot point to trigger a proper technical buy signal. It was highlighted in yellow with pivot point cited based on its 10/15/24 high plus 10 cents. >>> FEATURED STOCK ARTICLE : Tradeweb Markets Perched Near High - 11/19/2024 | View all notes | Set NEW NOTE alert | Company Profile | SEC News | Chart | Request a new note | ||||||||
| Symbol/Exchange Company Name Industry Group | PRICE | CHANGE | Day High | Volume (% DAV) (% 50 day avg vol) | 52 Wk Hi | Featured Date | Price Featured | Pivot Featured |
| Max Buy | ||||||||
Atour Lifestyle Hldgs ADR Leisure-Lodging | $26.97 | -0.04 -0.15% | $27.67 | 603,789 50 DAV is 1,310,000 | $29.90 -9.80% | 12/9/2024 | $29.34 | PP = $29.25 |
| MB = $30.71 | ||||||||
| Most Recent Note - 12/13/2024 7:04:12 PM Y - Suffered a loss today with higher volume, raising concerns while slumping near its 50 DMA line ($26.69). A violation would trigger a technical sell signal. >>> FEATURED STOCK ARTICLE : Volume Above Average Behind Breakout Gain - 12/9/2024 | View all notes | Set NEW NOTE alert | Company Profile | SEC News | Chart | Request a new note | ||||||||
Veeva Systems Inc Cl A Computer Sftwr-Medical | $224.64 | -4.15 -1.81% | $229.61 | 1,853,165 50 DAV is 1,054,700 | $258.93 -13.24% | 12/9/2024 | $250.70 | PP = $240.68 |
| MB = $252.71 | ||||||||
Y - It has slumped back well into the prior base raising concerns following a noted 12/06/24 "breakaway gap". Reported Oct '24 quarterly earnings +31% on +13% sales revenues versus the year-ago period, its 3rd consecutive quarterly comparison above the +25% minimum earnings guideline (C criteria). Annual earnings growth has been strong. >>> FEATURED STOCK ARTICLE : Veeva Systems Consolidating After "Breakaway Gap" - 12/10/2024 | View all notes | Set NEW NOTE alert | Company Profile | SEC News | Chart | Request a new note | ||||||||
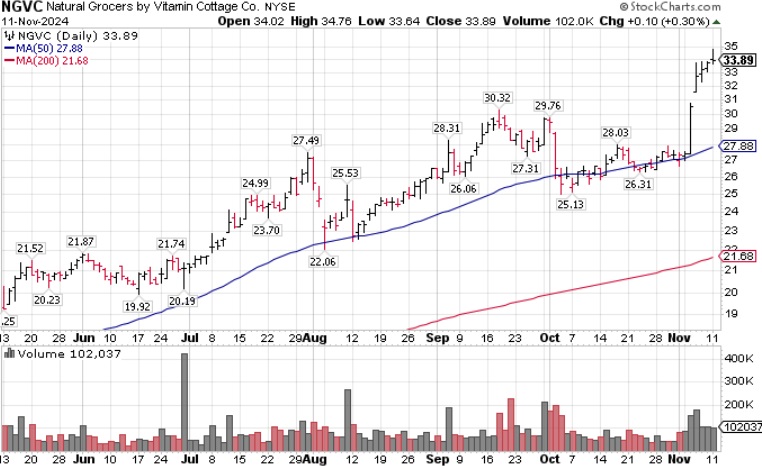
New High After 6th Consecutive Gain - Monday, November 11, 2024
Natural Grocers (NGVC) is perched at a new all-time high after today's 6th consecutive gain. It recently powered above the new pivot point cited based on its 9/18/24 high plus 10 cents triggering a new (or add-on) technical buy signal. It rallied abruptly from its 50-day moving average (DMA) line ($27.89) which acted as support.The Retail-Super/Mini Markets group is currently ranked 80th on the 197 Industry Groups list. Top-rated funds owning an interest in the company's shares rose from 177 in Sep '23 to 206 in Sep '24, a reassuring sign concerning the I criteria. Its current Up/Down Volume Ratio of 1.2 provides an unbiased indication that its shares have been under slight accumulation over the past 50 days. Its small supply (S criteria) of only 22.8 million shares outstanding can contribute to greater price volatility in the event of institutional buying or selling.
Charts courtesy www.stockcharts.com
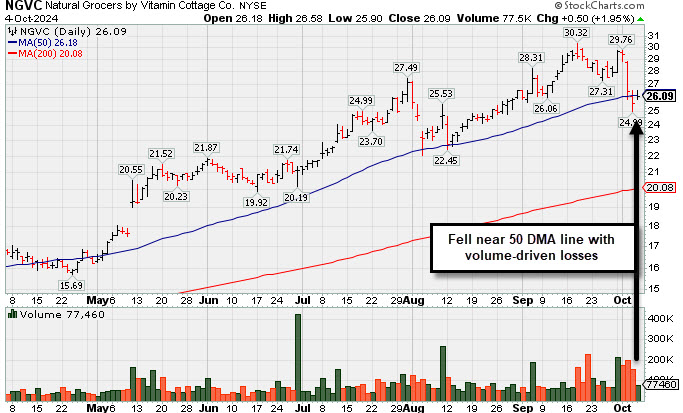
Near 50-Day Moving Average After Volume-Driven Losses - Friday, October 4, 2024
Natural Grocers (NGVC +$0.45 or +1.76% to $26.04) is consolidating near its 50-day moving average (DMA) line after volume-driven losses. NGVC was highlighted in yellow in the 9/05/24 mid-day report (read here) as it was noted that a valid secondary buy point exists up to 5% above the prior high since finding support near its 10 WMA line after an earlier breakout. It was last shown in this FSU section on 9/05/24 with an annotated graph under the headline, "Following Pullback a Secondary Buy Point Exists".The Retail-Super/Mini Markets group is currently ranked 69th on the 197 Industry Groups list. Top-rated funds owning an interest in the company's shares rose from 177 in Sep '23 to 201 in Sep '24, a reassuring sign concerning the I criteria. Its current Up/Down Volume Ratio of 1.2 provides an unbiased indication that its shares have been under slight accumulation over the past 50 days. Its small supply (S criteria) of only 22.8 million shares outstanding can contribute to greater price volatility in the event of institutional buying or selling.
Charts courtesy www.stockcharts.com
| Symbol/Exchange Company Name Industry Group | PRICE | CHANGE | Day High | Volume (% DAV) (% 50 day avg vol) | 52 Wk Hi | Featured Date | Price Featured | Pivot Featured |
| Max Buy | ||||||||
U.S. Lime & Minerals Bldg-Cement/Concrt/Ag | $93.25 | +1.62 1.77% | $93.75 | 33,781 50 DAV is 66,000 | $97.88 -4.73% | 9/17/2024 | $71.26 | PP = $87.23 |
| MB = $91.59 | ||||||||
| Most Recent Note - 9/30/2024 5:18:18 PM G - Hit another new all-time high with today''s gain backed by +22% above-average volume. Prior high in the $87 area defines initial support to watch on pullbacks. >>> FEATURED STOCK ARTICLE : US Lime & Minerals Lingers Below 50-Day Average - 9/6/2024 | View all notes | Set NEW NOTE alert | Company Profile | SEC News | Chart | Request a new note | ||||||||
Granite Construction Bldg-Heavy Construction | $81.29 | +1.77 2.23% | $81.35 | 309,875 50 DAV is 587,000 | $81.38 -0.11% | 6/11/2024 | $59.76 | PP = $64.33 |
| MB = $67.55 | ||||||||
| Most Recent Note - 10/1/2024 10:29:06 PM G - Posted a 3rd small gain today, hovering near its all-time high. Its 50 DMA line and prior low in the $70 area define important near-term support levels to watch on pullbacks. See the latest FSU analysis for more details and a new annotated graph. >>> FEATURED STOCK ARTICLE : Hovering Near All-Time High - 10/1/2024 | View all notes | Set NEW NOTE alert | Company Profile | SEC News | Chart | Request a new note | ||||||||
Texas Roadhouse Retail-Restaurants | $178.65 | +3.10 1.77% | $179.42 | 436,839 50 DAV is 719,000 | $180.69 -1.13% | 7/26/2024 | $173.08 | PP = $175.82 |
| MB = $184.61 | ||||||||
| Most Recent Note - 10/2/2024 5:27:32 PM Y - Managed a "positive reversal" today and closed near the session high with a gain backed by lighter volume. Recently noted rebound above the 50 DMA line ($168.71) helped its outlook to improve. Faces no resistance due to overhead supply. >>> FEATURED STOCK ARTICLE : Wedging to New Highs With Quiet Volume Behind Gains - 9/26/2024 | View all notes | Set NEW NOTE alert | Company Profile | SEC News | Chart | Request a new note | ||||||||
Howmet Aerospace Aerospace/Defense | $102.03 | +1.28 1.27% | $103.00 | 2,063,335 50 DAV is 2,668,000 | $102.26 -0.22% | 7/30/2024 | $93.95 | PP = $85.52 |
| MB = $89.80 | ||||||||
| Most Recent Note - 9/30/2024 6:04:04 PM G - Volume was light today as it posted a gain for a best-ever close. Its 50 DMA ($93.41) line defines important near-term support above the recent low ($90.72). See the latest FSU analysis for more details and a new annotated graph. >>> FEATURED STOCK ARTICLE : Gain With Light Volume for Best-Ever Close - 9/30/2024 | View all notes | Set NEW NOTE alert | Company Profile | SEC News | Chart | Request a new note | ||||||||
MercadoLibre Retail-Internet | $1,960.00 | +0.80 0.04% | $1,972.21 | 315,878 50 DAV is 325,000 | $2,161.73 -9.33% | 8/5/2024 | $1,793.73 | PP = $1,792.15 |
| MB = $1,881.76 | ||||||||
| Most Recent Note - 10/3/2024 5:03:34 PM G - Ended lower today with lighter volume after a volume-driven loss on the prior session undercut its prior low ($1,966). It is testing its 50 DMA line ($1,960) which defines important near-term support. More damaging losses would raise concerns and trigger a technical sell signal. See the latest FSU analysis for more details and a new annotated graph. >>> FEATURED STOCK ARTICLE : Testing 50-Day Moving Average Line - 10/3/2024 | View all notes | Set NEW NOTE alert | Company Profile | SEC News | Chart | Request a new note | ||||||||
| Symbol/Exchange Company Name Industry Group | PRICE | CHANGE | Day High | Volume (% DAV) (% 50 day avg vol) | 52 Wk Hi | Featured Date | Price Featured | Pivot Featured |
| Max Buy | ||||||||
Natural Grocers Retail-Super/Mini Mkts | $26.04 | +0.45 1.76% | $26.64 | 77,460 50 DAV is 94,000 | $30.32 -14.12% | 9/5/2024 | $27.91 | PP = $27.60 |
| MB = $28.98 | ||||||||
G - Paused today after 3 consecutive losses with above-average volume undercut its pivot point and violated its 50 DMA line ($26.24) triggering a technical sell signal. Only a prompt rebound above the 50 DMA line would help its outlook improve. See the latest FSU analysis for more details and a new annotated graph. >>> FEATURED STOCK ARTICLE : Near 50-Day Moving Average After Volume-Driven Losses - 10/4/2024 | View all notes | Set NEW NOTE alert | Company Profile | SEC News | Chart | Request a new note | ||||||||
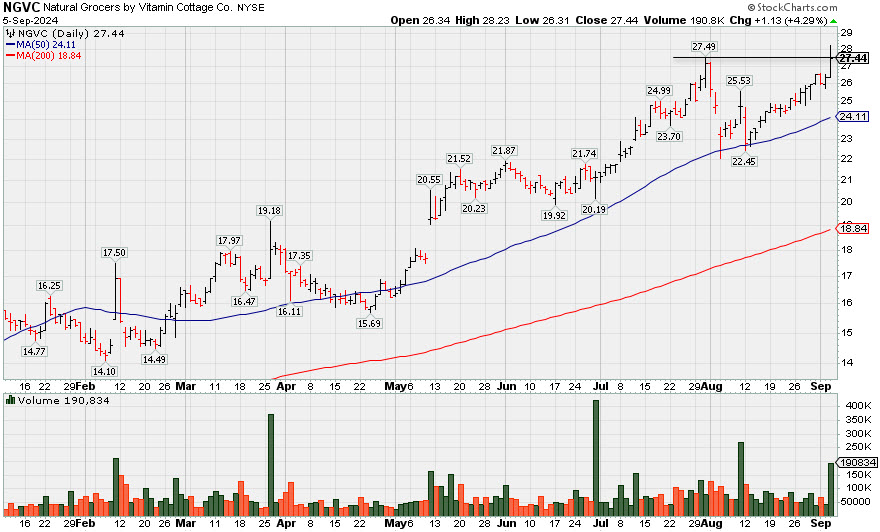
Following Pullback a Secondary Buy Point Exists - Thursday, September 5, 2024
Natural Grocers (NGVC +$1.16 or +4.41% to $27.47) was highlighted in yellow in the earlier mid-day report (read here) as it was noted that a valid secondary buy point exists up to 5% above the prior high since finding support near its 10 WMA line after an earlier breakout.The Retail-Super/Mini Markets group is currently ranked 36th on the 197 Industry Groups list. Top-rated funds owning an interest in the company's shares rose from 177 in Sep '23 to 197 in Jun '24, a reassuring sign concerning the I criteria. Its current Up/Down Volume Ratio of 1.9 provides an unbiased indication that its shares have been under accumulation over the past 50 days. Its small supply (S criteria) of only 22.8 million shares outstanding can contribute to greater price volatility in the event of institutional buying or selling.
Charts courtesy www.stockcharts.com