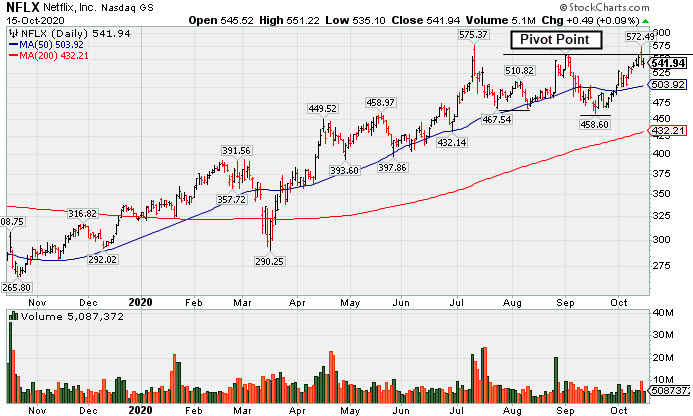
Netflix Inc (NFLX +$0.49 or +0.09% to $541.94) held its ground today with a lighter than average volume total. Its color code was changed to yellow and a new pivot point was cited as it formed a "double bottom" base, however there was a "negative reversal" on the prior session, action indicative of distributional pressure. A subsequent gain and close above the pivot point backed by at least +40% above average volume may trigger a new (or add-on) technical buy signal.
Its 50-day moving average (DMA) line ($503.92) and recent low ($458.60 on 9/18/20) define important near term support where any further deterioration would raise more serious concerns and trigger technical sell signals. NFLX currently has an Accumulation/Distribution Rating of B-, up from C- on 9/29/20 when it was last shown with an annotated graph under the headline,"Quiet Rebound Meeting Resistance at 50-Day Moving Average". It has traded up as much as +46.2% since it was highlighted in yellow with pivot point cited based on its 3/03/20 high plus 10 cents in the 4/13/20 mid-day report (read here).
Fundamentals remain strong. NFLX has essentially been consolidating since reporting Jun '20 earnings +165% on +25% sales revenues versus the year ago period. It has tallied 4 consecutive quarterly comparisons well above the +25% minimum guideline (C criteria). A previously noted downturn in FY '15 earnings (A criteria) has been followed by very strong growth. The number of top-rated funds owning its shares (I criteria) rose from 1,534 in Mar '17 to 2,788 in Jun '20, a reassuring sign concerning the I criteria. Its current Up/Down Volume Ratio of 1.0 is an unbiased indication its shares have been neutral concerning accumulation/distributional pressure over the past 50 days. The company has 423.4 million shares in the public float (S criteria) which can make it a less likely sprinter. It has a Timeliness rating of A, a Sponsorship rating of B.
Charts courtesy of www.stockcharts.com
Netflix Inc (NFLX +$2.83 or +0.58% to $493.48) posted a 4th consecutive gain today with light volume, rebounding toward its 50-day moving average (DMA) line ($495) which is now downward sloping. That short-term average has acted as resistance. Subsequent gains back above the 50 DMA line are needed for its outlook to improve. The recent low ($458.60 on 9/18/20) defines important near term support where any further deterioration would raise more serious concerns and a violation would trigger a more worrisome technical sell signal.
NFLX currently has an Accumulation/Distribution Rating of C-. On 9/16/20 it was shown with an annotated graph under the headline,"Met Resistance at 50 DMA Line and Reversed Today". It has traded up as much as +46.2% since it was highlighted in yellow with pivot point cited based on its 3/03/20 high plus 10 cents in the 4/13/20 mid-day report (read here).
Fundamentals remain strong. NFLX has been consolidating after reporting Jun '20 earnings +165% on +25% sales revenues versus the year ago period. It has tallied 4 consecutive quarterly comparisons well above the +25% minimum guideline (C criteria). A previously noted downturn in FY '15 earnings (A criteria) has been followed by very strong growth. The number of top-rated funds owning its shares (I criteria) rose from 1,534 in Mar '17 to 2,798 in Jun '20, a reassuring sign concerning the I criteria. Its current Up/Down Volume Ratio of 0.9 is an unbiased indication its shares have been under slight distributional pressure over the past 50 days. The company has 423.4 million shares in the public float (S criteria) which can make it a less likely sprinter. It has a Timeliness rating of A, a Sponsorship rating of B.
Charts courtesy of www.stockcharts.com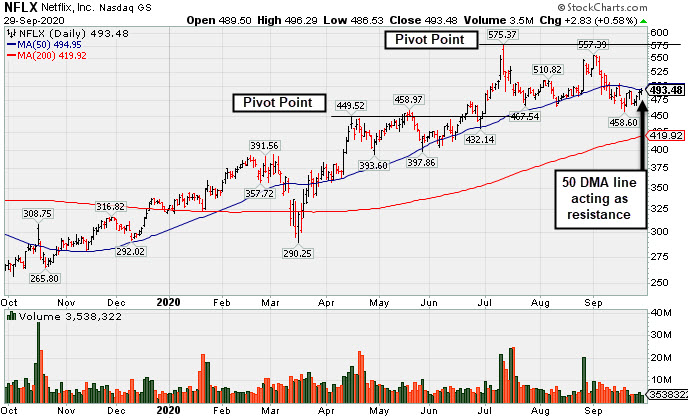
Netflix Inc (NFLX -$12.13 or -2.45% to $483.86) reversed into the red after meeting resistance at its 50-day moving average (DMA) line ($501.38). Subsequent gains back above the 50 DMA line are needed for its outlook to improve. The prior low ($466.55 on 8/11/20) defines the next important chart support level where a violation would raise serious concerns and trigger a more worrisome technical sell signal.
Since NFLX was last shown in this FSU section on 9/03/20 its Accumulation/Distribution Rating has slumped from C+ top D+. On 9/03/20 it was shown with an annotated graph under the headline,"Pulling Back After Best Ever Close on Tuesday". It has traded up as much as +46.2% since it was highlighted in yellow with pivot point cited based on its 3/03/20 high plus 10 cents in the 4/13/20 mid-day report (read here).
Fundamentals remain strong. NFLX has been consolidating after reporting Jun '20 earnings +165% on +25% sales revenues versus the year ago period. It has tallied 4 consecutive quarterly comparisons well above the +25% minimum guideline (C criteria). A previously noted downturn in FY '15 earnings (A criteria) has been followed by very strong growth. The number of top-rated funds owning its shares (I criteria) rose from 1,534 in Mar '17 to 2,790 in Jun '20, a reassuring sign concerning the I criteria. Its current Up/Down Volume Ratio of 0.9 is an unbiased indication its shares have been under slight distributional pressure over the past 50 days. The company has 423.4 million shares in the public float (S criteria) which can make it a less likely sprinter. It has a Timeliness rating of A, a Sponsorship rating of B.
Charts courtesy of www.stockcharts.com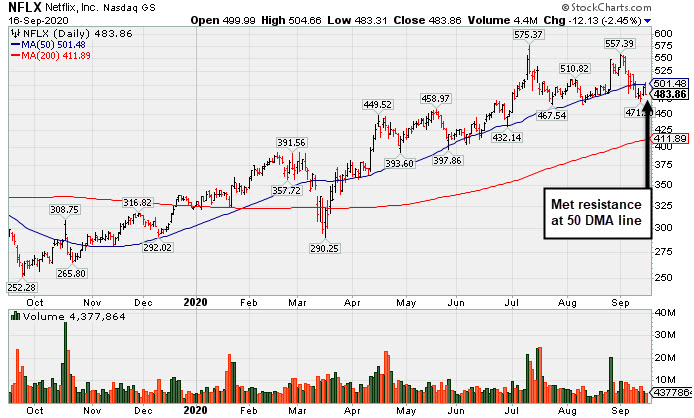
Netflix Inc (NFLX -$27.09 or -4.90% to $525.75) pulled back today with +15% above average volume. A new pivot point cited based on its 7/13/20 high plus 10 cents. Subsequent volume-driven gains above the pivot point may trigger a new (or add-on) technical buy signal. It found support near its 50 DMA line ($498) on consolidations during its ongoing ascent. More damaging losses woud raise concerns and trigger a technical sell signal.
NFLX was last shown in this FSU section on 8/18/20 with an annotated graph under the headline,"50-Day Moving Average Acted As Support Level". Fundamentals remain strong. NFLX has been consolidating after reporting Jun '20 earnings +165% on +25% sales revenues versus the year ago period. It has tallied 4 consecutive quarterly comparisons well above the +25% minimum guideline (C criteria). It has traded up as much as +46.2% since it was highlighted in yellow with pivot point cited based on its 3/03/20 high plus 10 cents in the 4/13/20 mid-day report (read here).
A previously noted downturn in FY '15 earnings (A criteria) has been followed by very strong growth. The number of top-rated funds owning its shares (I criteria) rose from 1,534 in Mar '17 to 2,774 in Jun '20, a reassuring sign concerning the I criteria. Its current Up/Down Volume Ratio of 1.1 is an unbiased indication its shares have been under slight accumulation over the past 50 days. The company has 423.4 million shares in the public float (S criteria) which can make it a less likely sprinter. It has a Timeliness rating of A, a Sponsorship rating of B, and an Accumulation/Distribution Rating of C+.
Charts courtesy of www.stockcharts.com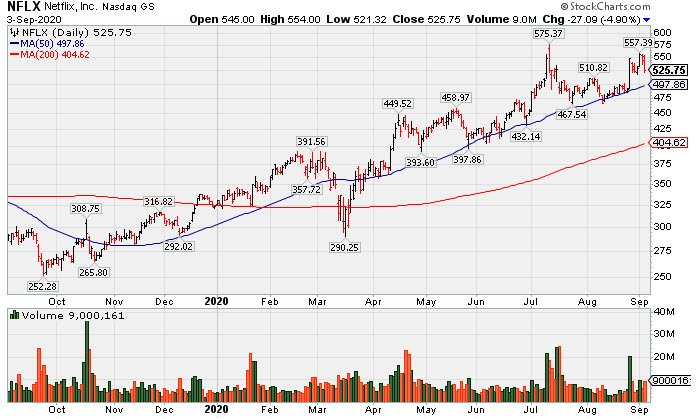
Netflix Inc (NFLX +$9.52 or +1.97% to $491.87) found prompt support last week after briefly undercutting both its 50-day moving average (DMA) line ($479.87) and prior low ($467.54). The rebound above the 50 DMA line helped its outlook improve, however, the volume behind recent gains has been very light. It has not formed a sound base pattern.
NFLX was last shown in this FSU section on 7/29/20 with an annotated graph under the headline,"Consolidating After Getting Extended From Prior Base". Fundamentals remain strong. NFLX has been consolidating after reporting Jun '20 earnings +165% on +25% sales revenues versus the year ago period. It has tallied 4 consecutive quarterly comparisons well above the +25% minimum guideline (C criteria). It has traded up as much as +46.2% since it was highlighted in yellow with pivot point cited based on its 3/03/20 high plus 10 cents in the 4/13/20 mid-day report (read here).
A previously noted downturn in FY '15 earnings (A criteria) has been followed by very strong growth. The number of top-rated funds owning its shares (I criteria) rose from 1,534 in Mar '17 to 2,717 in Jun '20, a reassuring sign concerning the I criteria. Its current Up/Down Volume Ratio of 1.1 is an unbiased indication its shares have been under slight accumulation over the past 50 days. The company has 423.4 million shares in the public float (S criteria) which can make it a less likely sprinter. It has a Timeliness rating of A, a Sponsorship rating of B, and an Accumulation/Distribution Rating of C-.
Charts courtesy of www.stockcharts.com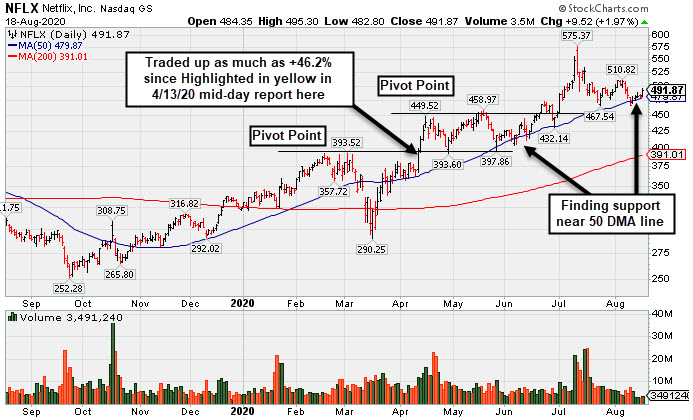
Netflix Inc (NFLX -$4.03 or -0.82% to $484.48) has been pulling back toward its "max buy" level after getting very extended from the prior base. Its 50-day moving average (DMA) line ($462.03) defines near-term support above prior highs in the $458 area.
Fundamentals remain strong. NFLX has been consolidating after reporting Jun '20 earnings +165% on +25% sales revenues versus the year ago period. It has tallied 4 consecutive quarterly comparisons well above the +25% minimum guideline (C criteria). NFLX finished strong after it was highlighted in yellow with pivot point cited based on its 3/03/20 high plus 10 cents in the 4/13/20 mid-day report (read here). The gain above the pivot point was backed by +55% above average volume and triggered a technical buy signal. NFLX was last shown in this FSU section on 7/02/20 with an annotated graph under the headline, "Powered to New High on Prior Session With Volume Driven Gain".
A previously noted downturn in FY '15 earnings (A criteria) has been followed by very strong growth. The number of top-rated funds owning its shares (I criteria) rose from 1,534 in Mar '17 to 2,638 in Jun '20, a reassuring sign concerning the I criteria. Its current Up/Down Volume Ratio of 0.9 is an unbiased indication its shares have been under slight distributional pressure over the past 50 days. The company has 423.4 million shares in the public float (S criteria) which can make it a less likely sprinter. It has a Timeliness rating of A, a Sponsorship rating of B, and an Accumulation/Distribution Rating of B-.
Charts courtesy of www.stockcharts.com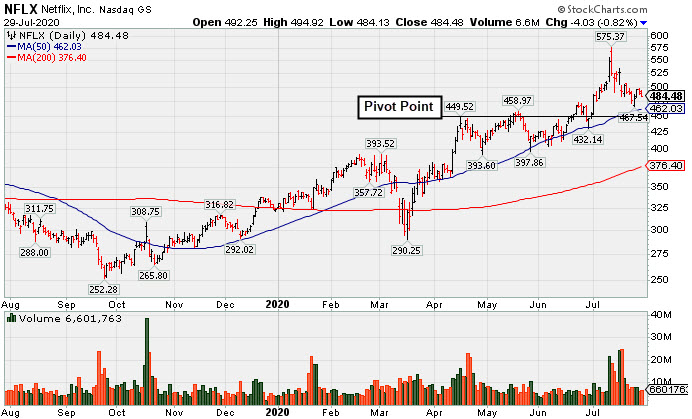
Netflix Inc (NFLX -$8.75 or -1.80% to $476.89) pulled back today following a solid gain with +37% above average volume on the prior session as it rallied above its "max buy" level for a new all-time high. It found support near its 50-day moving average (DMA) line ($436) during recent consolidations.
Fundamentals remain strong after it reported earnings +107% on +28% sales revenues for the Mar '20 quarter versus the year ago period, its 3rd consecutive quarterly comparison well above the +25% minimum guideline (C criteria). NFLX finished strong after it was highlighted in yellow with pivot point cited based on its 3/03/20 high plus 10 cents in the 4/13/20 mid-day report (read here). The gain above the pivot point was backed by +55% above average volume and triggered a technical buy signal. NFLX was last shown in this FSU section on 6/12/20 with an annotated graph under the headline, "Weak Action Led to 50-Day Moving Average Violation".
A previously noted downturn in FY '15 earnings (A criteria) has been followed by very strong growth. The number of top-rated funds owning its shares (I criteria) rose from 1,534 in Mar '17 to 2,435 in Mar '20, a reassuring sign concerning the I criteria. The company has 422.2 million shares in the public float (S criteria) which can make it a less likely sprinter. It has a Timeliness rating of A, a Sponsorship rating of B, and an Accumulation/Distribution Rating of B.
Charts courtesy of www.stockcharts.com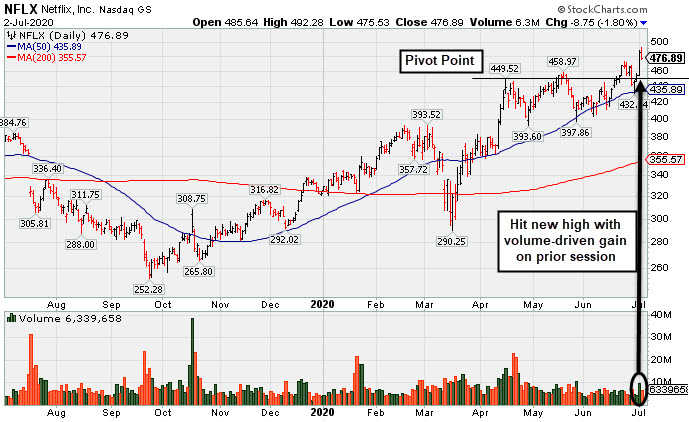
Netflix Inc (NFLX -$7.49 or -1.76% to $418.07) fell further today after today a "negative reversal" on Thursday amid widespread market weakness. Concerns were raised as it closed just below its 50-day moving average (DMA) line ($420.66) which had acted as support in recent weeks. More damaging losses below prior lows would trigger a more worrisome technical sell signal. A rebound and subsequent gains above the new pivot point cited must be backed by at least +40% above average volume to trigger a proper new (or add-on) technical buy signal.
Fundamentals remain strong after it reported earnings +107% on +28% sales revenues for the Mar '20 quarter versus the year ago period, its 3rd consecutive quarterly comparison well above the +25% minimum guideline (C criteria). NFLX finished strong after it was highlighted in yellow with pivot point cited based on its 3/03/20 high plus 10 cents in the 4/13/20 mid-day report (read here). The gain above the pivot point was backed by +55% above average volume and triggered a technical buy signal. NFLX was last shown in this FSU section on 5/21/20 with an annotated graph under the headline, "Pulling Back After Brief New Base Formation".
A previously noted downturn in FY '15 earnings (A criteria) has been followed by very strong growth. The number of top-rated funds owning its shares (I criteria) rose from 1,534 in Mar '17 to 2,409 in Mar '20, a reassuring sign concerning the I criteria. The company has 422.2 million shares in the public float (S criteria) which can make it a less likely sprinter. It has a Timeliness rating of A, a Sponsorship rating of B, and an Accumulation/Distribution Rating of B-.
Charts courtesy of www.stockcharts.com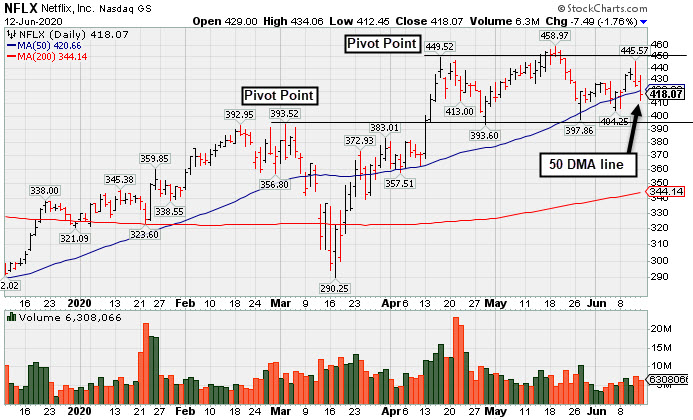
Netflix Inc (NFLX -$11.42 or -2.55% to $436.25) pulled back today with higher (near average) volume. Subsequent gains above the pivot point must be backed by at least +40% above average volume to trigger a proper new (or add-on) technical buy signal. Prior highs in the $393 area acted as support following the recent breakout.
Volume totals had been cooling while stubbornly holding its ground near its all-time high. Its color code was changed to yellow with new pivot point cited based on its 4/16/20 high plus 10 cents. Recently it formed an advanced "3-weeks tight" base or what may also be considered a 4-week "square box" base.
Fundamentals remain strong after it reported earnings +107% on +28% sales revenues for the Mar '20 quarter versus the year ago period, its 3rd consecutive quarterly comparison well above the +25% minimum guideline (C criteria). NFLX finished strong after it was highlighted in yellow with pivot point cited based on its 3/03/20 high plus 10 cents in the 4/13/20 mid-day report (read here). The gain above the pivot point was backed by +55% above average volume and triggered a technical buy signal. NFLX was last shown in this FSU section on 5/06/20 with an annotated graph under the headline, "Prior Highs Acted as Support Following Recent Breakout".
A previously noted downturn in FY '15 earnings (A criteria) has been followed by very strong growth. The number of top-rated funds owning its shares (I criteria) rose from 1,534 in Mar '17 to 2,404 in Mar '20, a reassuring sign concerning the I criteria. The company has 422.2 million shares in the public float (S criteria) which can make it a less likely sprinter. It has a Timeliness rating of A, a Sponsorship rating of B, and an Accumulation/Distribution Rating of B+.
Charts courtesy of www.stockcharts.com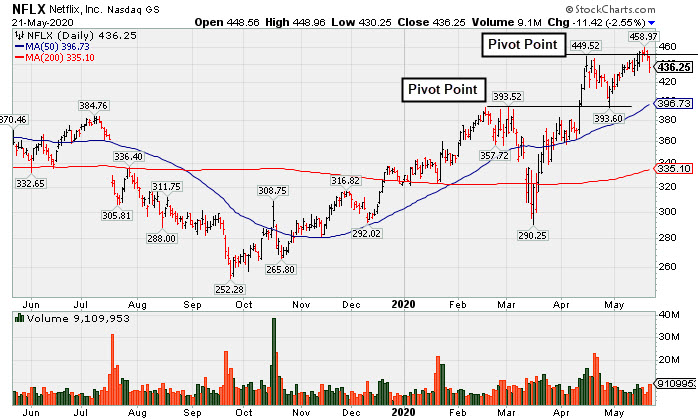
Netflix Inc (NFLX +$9.58 or +2.26% to $434.26) posted a gain with light volume today. It is trading above the "max buy" level with recent gains lacking great volume conviction. Prior highs in the $393 area acted as support during the consolidation following its recent breakout. Disciplined investors avoid chasing stocks more than +5% above the prior high or pivot point.
Fundamentals remain strong after it reported earnings +107% on +28% sales revenues for the Mar '20 quarter versus the year ago period, its 3rd consecutive quarterly comparison well above the +25% minimum guideline (C criteria). NFLX finished strong after it was highlighted in yellow with pivot point cited based on its 3/03/20 high plus 10 cents in the 4/13/20 mid-day report (read here). The gain above the pivot point was backed by +55% above average volume and triggered a technical buy signal. NFLX was last shown in this FSU section on 4/21/20 with an annotated graph under the headline, "Netflix Reported Another Strong Quarter After Rally From Base".
A previously noted downturn in FY '15 earnings (A criteria) has been followed by very strong growth. The number of top-rated funds owning its shares (I criteria) rose from 1,534 in Mar '17 to 2,373 in Mar '20, a reassuring sign concerning the I criteria. The company has 422.2 million shares in the public float (S criteria) which can make it a less likely sprinter. It has a Timeliness rating of A, a Sponsorship rating of B, and an Accumulation/Distribution Rating of B+.
Charts courtesy of www.stockcharts.com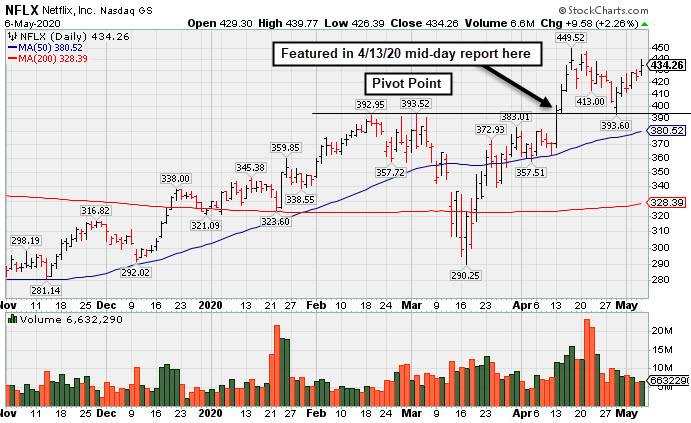
Netflix Inc (NFLX -$3.66 or -0.84% to $433.83) reported after the close today that earnings rose +107% on +28% sales revenues for the Mar '20 quarter versus the year ago period, its 3rd consecutive very strong quarter. Volume and volatility often increase near earnings news.
NFLX finished strong after it was highlighted in yellow with pivot point cited based on its 3/03/20 high plus 10 cents in the 4/13/20 mid-day report (read here). The gain above the pivot point was backed by +55% above average volume and triggered a technical buy signal.
Disciplined investors avoid chasing stocks more than +5% above the prior high or pivot point. NFLX was last shown in this FSU section on 4/13/20 with an annotated graph under the headline, "Volume-Driven Breakout for Netflix". It was repeatedly noted as "extended from the previously noted base", after a spurt of volume-driven gains in the interim pushed it to new all-time highs.
A previously noted downturn in FY '15 earnings (A criteria) has been followed by very strong growth. The number of top-rated funds owning its shares (I criteria) rose from 1,534 in Mar '17 to 2,277 in Dec '19, a reassuring sign concerning the I criteria. The company has 421.3 million shares in the public float (S criteria) which can make it a less likely sprinter. It has a Timeliness rating of A, a Sponsorship rating of B, and an Accumulation/Distribution Rating of A.
Charts courtesy of www.stockcharts.com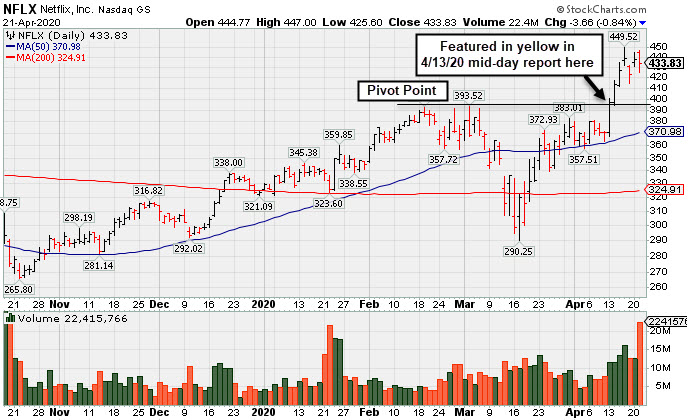
Netflix Inc (NFLX +$26.00 or +7.01% to $396.72) finished strong after it was highlighted in yellow with pivot point cited based on its 3/03/20 high plus 10 cents in the earlier mid-day report (read here). The gain above the pivot point was backed by +55% above average volume and triggered a technical buy signal. It hit a new 52-week high with the big gain, and very little resistance remains due to overhead supply up to the $423 level. It rebounded above its 200 DMA line ($323) and above its 50 DMA line ($363) following an abrupt slump.
Keep in mind that NFLX is due to report earnings news on 4/21/20. Volume and volatility often increase near earnings news. It reported earnings +333% on +31% sales revenues for the Dec '19 quarter, its 2nd consecutive very strong quarter. A previously noted downturn in FY '15 earnings (A criteria) has been followed by very strong growth.
NFLX went through a choppy consolidation since dropped from the Featured Stocks list on 7/30/18. It was last shown in this FSU section on 7/13/18 with an annotated graph under the headline, "Extended From Base and Pulling Back From All-Time High".
The number of top-rated funds owning its shares (I criteria) rose from 1,534 in Mar '17 to 2,269 in Dec '19, a reassuring sign concerning the I criteria. The company has 421.3 million shares in the public float (S criteria) which can make it a less likely sprinter. It has a Timeliness rating of A, a Sponsorship rating of B, and an Accumulation/Distribution Rating of A-.
Charts courtesy of www.stockcharts.com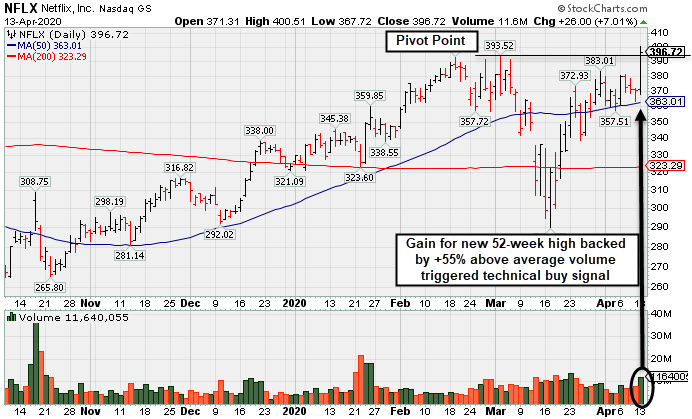
Netflix Inc (NFLX -$17.70 or -4.28% to $395.80) slumped for a big loss on above average volume on Friday, retreating from its all-time high. It is extended from any sound base. Its 50-day moving average (DMA) line ($367.84) defines near-term support to watch above the prior high ($338.82 on 4/18/18).
NFLX was last shown in this FSU section on 5/24/18 with an annotated graph under the headline, "Rally From Advanced Ascending Base With Volume +50%". It was highlighted in yellow in the 5/24/18 mid-day report (read here). It rallied above the new pivot point cited based on its 4/18/18 high plus 10 cents triggering a technical buy signal, clearing an advanced "ascending base" marked by 3 pullbacks of 10-20% since breaking out in January.
Recently it reported earnings +60% on +40% sales revenues for the Mar '18 quarter, its 7th consecutive strong quarter. Previously noted downturn in FY '15 earnings (A criteria) has been followed by very strong growth.
The number of top-rated funds owning its shares (I criteria) rose from 1,534 in Mar '17 to 1,892 in Jun '18, a reassuring sign concerning the I criteria. The company has 413 million shares in the public float (S criteria) which can make it a less likely sprinter. It has a Timeliness rating of A, a Sponsorship rating of B, and an Accumulation/Distribution Rating of B-.
Charts courtesy of www.stockcharts.com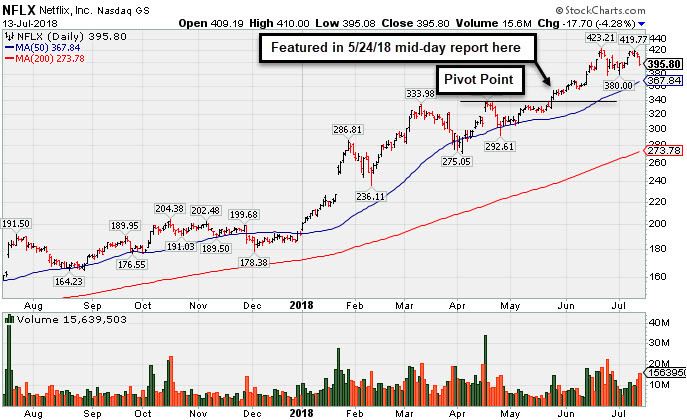
Netflix Inc (NFLX +$4.57 or +1.33% to $349.29) was highlighted in yellow in the earlier mid-day report (read here). It hit a new high with +50% above average volume and closed above the new pivot point cited based on its 4/18/18 high plus 10 cents triggering a technical buy signal. It rallied from an advanced "ascending base" marked by 3 pullbacks of 10-20% since breaking out in January.
It found prompt support near its 50-day moving average (DMA) line in recent months. Recently it reported earnings +60% on +40% sales revenues for the Mar '18 quarter, its 7th consecutive strong quarter. Previously noted downturn in FY '15 earnings (A criteria) has been followed by very strong growth.
The number of top-rated funds owning its shares (I criteria) rose from 1,534 in Mar '17 to 1,808 in Mar '18, a reassuring sign concerning the I criteria. The company has 413 million shares in the public float (S criteria) which can make it a less likely sprinter. It has a Timeliness rating of A, a Sponsorship rating of A, and an Accumulation/Distribution Rating of B+.
Charts courtesy of www.stockcharts.com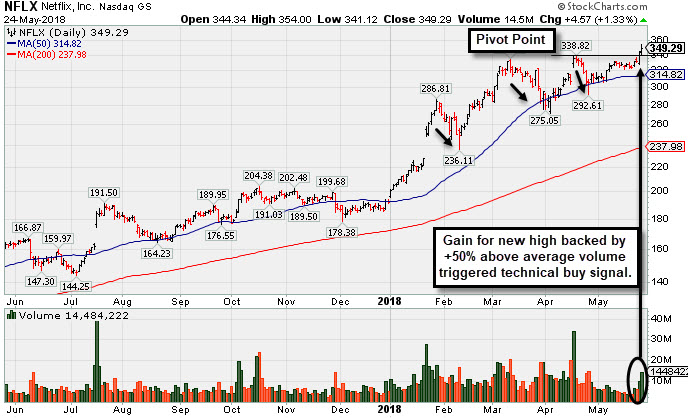
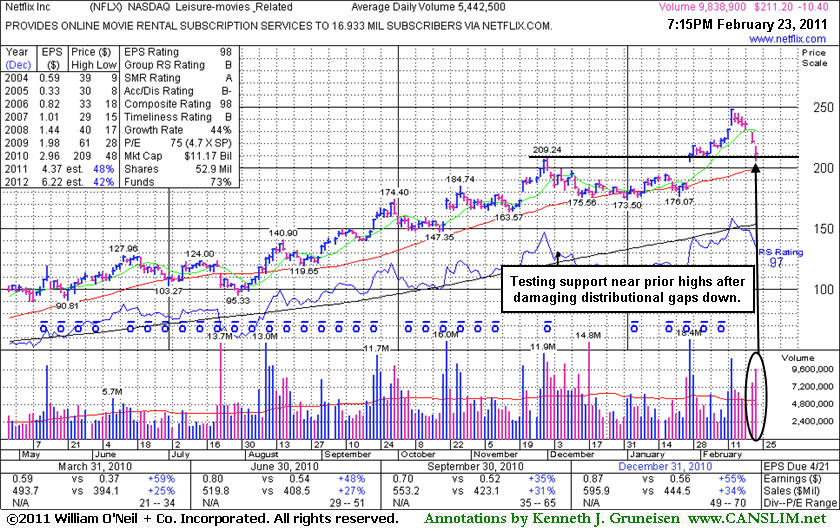
Netflix Inc (NFLX -$10.40 or -4.69% to $211.20) gapped down for a second consecutive session, and its damaging loss on heavier volume today extended its losing streak to 6 consecutive trading days. It is -14.7% off its high and concerns have risen after damaging distributional pressure has impacted the stock and the broader market. NFLX is testing prior resistance near its old high ($209), a level that has previously been noted as defining support to watch above its 50-day moving average (DMA) line. Following its last appearance in this FSU section on 1/10/11 with detailed analysis and an annotated graph under the headline "Late Stage Breakout Faltered, But Leader Still Proving Resilient" it continued to find support near its 50-day moving average (DMA) line. Then it gapped up on 1/27/11 with very heavy volume (18.4 million shares) triggering a new technical buy signal. By 2/04/11 its color code was changed to green after it got extended from prior highs.
Even after its recent slump its Accumulation/Distribution Rating is a B- now, improved from a D+ at the time of its last FSU section appearance. Chart readers may expect to see it find support near its prior highs and above its 50 DMA line, but more damaging losses would hurt its outlook and may lead to a longer and deeper consolidation. Keep in mind that 3 out of 4 stocks tend to go in the direction of the major averages, so the broader market's action (M criteria) is likely to carry a lot of weight as to how this high-ranked leader fares in the near-term.
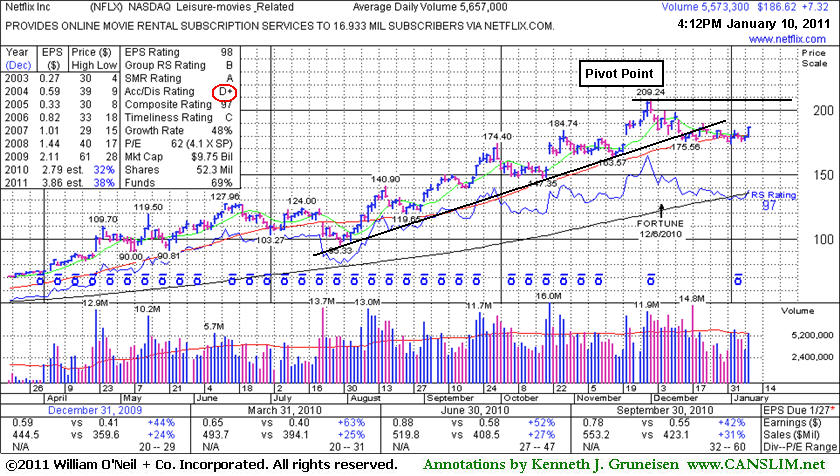
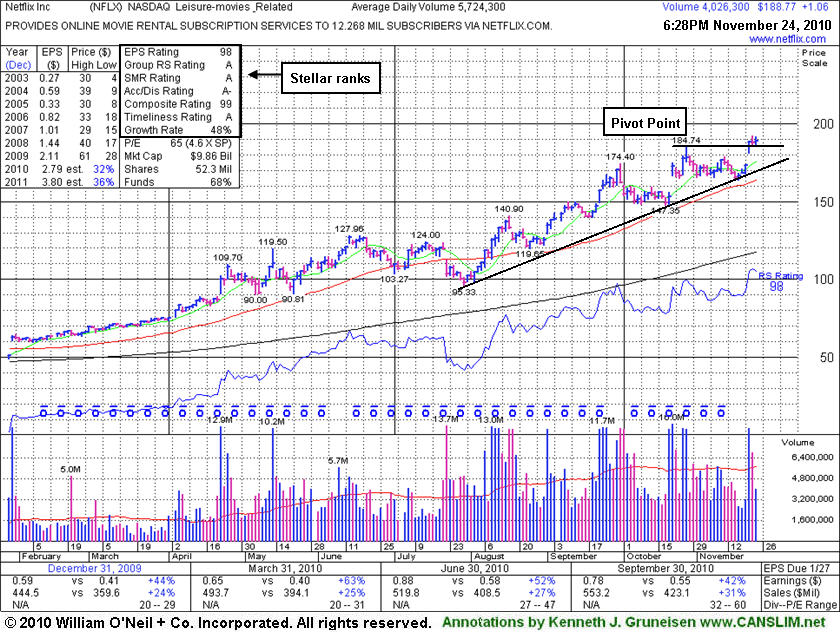
Netflix Inc (NFLX +$8.58 or +4.79% to $187.88) rallied up today from near its 50-day moving average (DMA) line and recent lows defining near-term support. It recently flashed some "early" sell signals, and it was noted that more damaging losses could trigger more serious technical sell signals. As the previously mentioned upward trendline has been breached and it had also been slumping below its 50 DMA, concerns rose. It is still a couple of weeks too early to call it another "double bottom" type base wherein the 12/22/10 high might be considered the new pivot point. It is consolidating just -10.2% off its all-time high, working on the 6th week of a flat base. Its color code is changed to yellow with a new pivot point cited based on its 52-week high plus ten cents.
NFLX had been previously noted as a riskier "late stage" set-up, and shortly after a gap up gain (on 11/22/10) with above average volume it made its last appearance in this FSU section on 11/24/10 with an annotated graph under the headline "Netflix Perched At Highs After Late Stage Breakout". Its Accumulation/Distribution Rating was A- then, and it subsequently rallied from $188.77 to as high as $209.24. But as the broader market's rally picked up on December 1st, NFLX started heading the other direction, enduring numerous damaging distribution days. Now its Accumulation/Distribution Rating has slumped to a D+.
In the 11/24/10 detailed analysis we observed - "Late stage bases are also considered risker and more failure prone candidates, providing another cause for greater caution and sound trading discipline. Investors should always limit losses by selling shares at any time a stock falls more than 7% from your buy price. In this case, a clear upward trendline connecting its July - November lows defines an important initial chart support level above its 50-day moving average (DMA) line. Violations would raise concerns and trigger technical sell signals."
Netflix Inc (NFLX +$1.06 or +0.56% to $188.77) is perched at all-time highs after a gap up gain with above average volume on 11/22/10. NFLX had been noted as a riskier "late stage" set-up, and the gap up gain amounted to a new (or add-on) technical buy signal. However, a follow-through day from at least one of the major averages is also needed as a confirmation of a new rally since recent concerns were raised about the M criteria. Keep in mind that 3 out of 4 stocks tend to go in the same direction as the major averages.
Following its last appearance in this FSU section on 10/01/10 with an annotated graph under the headline "Negative Reversal After Getting Extended" its volume totals cooled while it consolidated above prior highs and stayed well above its 50-day moving average line. A bullish gap up on 10/21/10 and additional big gains backed by heavy volume followed, helping it reach new 52-week highs. After 11/09/10 a new pivot point was cited and it was color coded yellow again and noted - "Formed an advanced "ascending base" type pattern marked by 3 pullbacks in the 10-20% range since its earlier technical breakout (on 8/10/10) from a double bottom base."
Technically it met the guidelines to trigger a proper buy signal again this week, aside from the M criteria being an overriding concern that discourages any new buying efforts. Late stage bases are also considered risker and more failure prone candidates, providing another cause for greater caution and sound trading discipline. Investors should always limit losses by selling shares at any time a stock falls more than 7% from your buy price. In this case, a clear upward trendline connecting its July - November lows defines an important initial chart support level above its 50-day moving average (DMA) line. Violations would raise concerns and trigger technical sell signals.
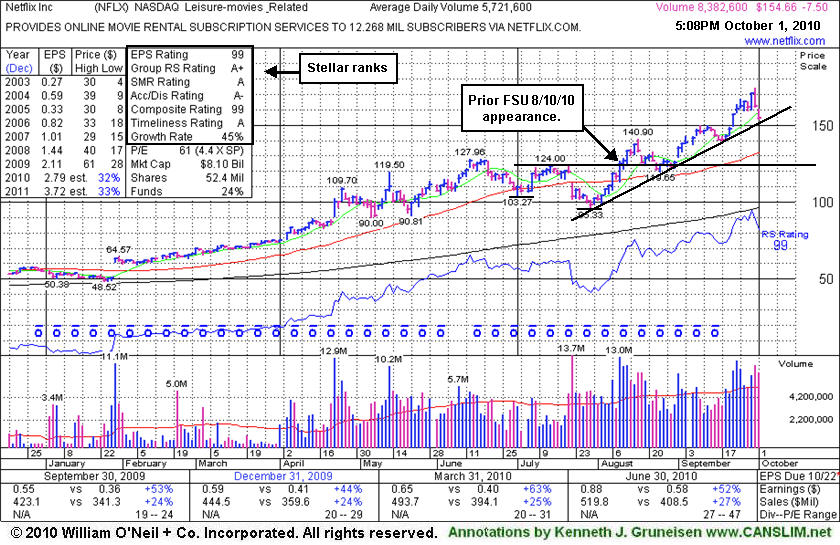
Netflix Inc (NFLX -$7.50 or -4.63% to $154.66) was down today for a second consecutive loss with above average volume following a negative reversal at its all-time high. The latest action is a sign of distributional pressure. It is extended from a sound base pattern and may need to spend more time consolidating. It may also go on to produce more climactic gains, however disciplined investors would avoid chasing a stock that is so extended from a sound base. An upward trendline comes into play well above its 50-day moving average (DMA) line as an initial support level to watch, where a violation may be considered an "early" sell signal.
On 8/10/10 it was last shown in this FSU section under the deadline "Heavy Volume Breakout From Double Bottom Base" as it posted a solid gain with more than 3 times average volume as it rallied above the pivot point after an 8-week "double bottom" base. Technically it met the guidelines to trigger a proper buy signal as it closed strong after it was featured in that day's mid-day report (read here). Prior reports had stated that it had the "look of a possible 'climax run' in the making" and it has been repeatedly noted as "very strong in terms of key investment criteria." The annotated graph below shows its stellar ranks and shows where it was at the time of its prior FSU section appearance.
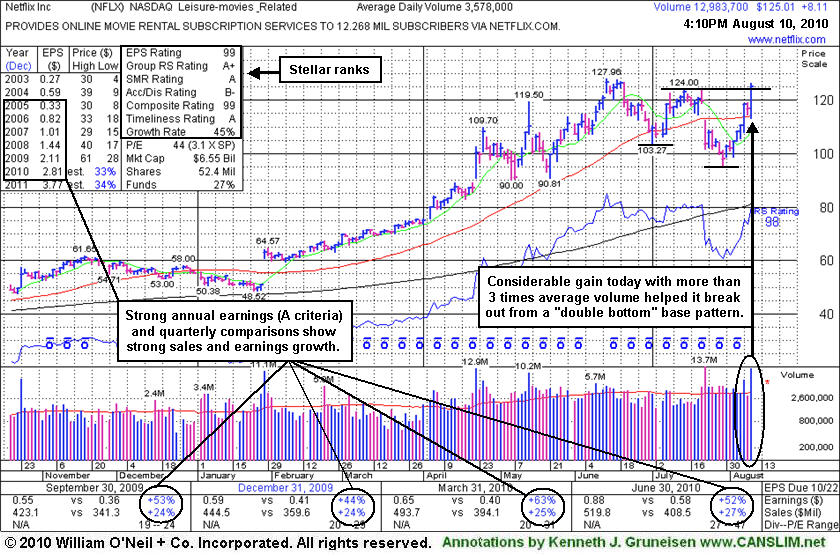
Netflix Inc (NFLX +$8.11 or +6.94% to $125.01) posted a solid gain today with more than 3 times average volume as it rallied above the pivot point after an 8-week "double bottom" base. Technically it met the guidelines to trigger a proper buy signal, while it may be considered a riskier "late-stage" breakout. It was featured in yellow in today's mid-day report (read here).
It was recently noted in the 6/16/10 and 5/13/10 mid-day reports - "Look of a possible 'climax run' in the making. Since its latest strong quarterly report it has been noted as very strong in terms of key investment criteria. NFLX rebounded impressively since it was dropped from the Featured Stocks list on 6/02/09 based on persistent trading under its 50 DMA line. It was first featured in yellow at $37.13 in the 1/29/09 CANSLIM.net Mid-Day Breakouts Report (read here).
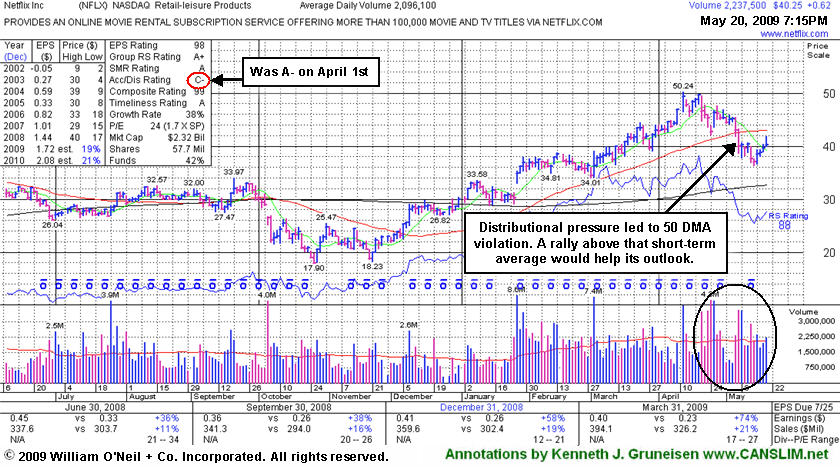
Netflix Inc (NFLX +$0.62 or +1.56% to $40.25) has seen gains with near average volume follow recently noted signs of distributional pressure and technical weakness. Concerns remain and its outlook is questionable for as long as it remains trading below its 50-day moving average (DMA) line (the red line). Its Accumulation/Distribution rating has fallen from A- when it appeared in this report on April 1st, to a C- today, further highlighting its deterioration. Sell signals were noted in recent weeks, following gains of as much as +35.31% since it was first featured in yellow at $37.13 in the 1/29/09 CANSLIM.net Mid-Day Breakouts Report (read here).
C A N S L I M | StockTalk | News | Chart | SEC | Zacks Reports | ![]()
![]()
![]()
View all notes | Alert me of new notes | CANSLIM.net Company Profile
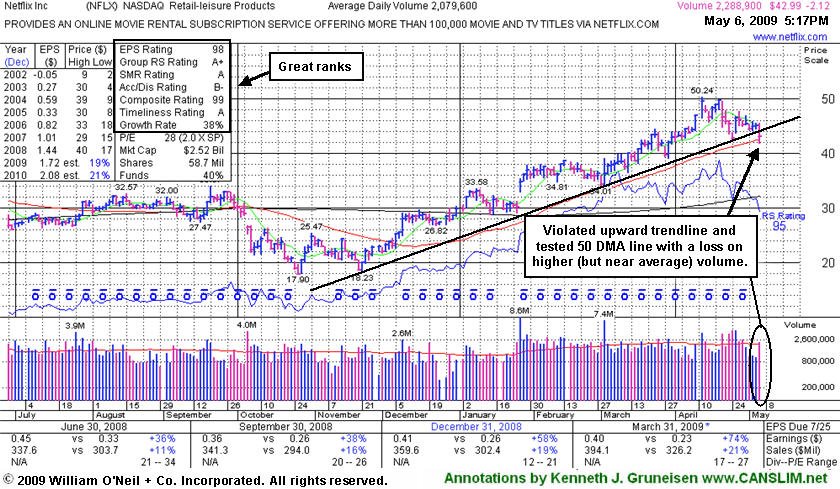
Netflix Inc (NFLX -$2.12 or -4.70% to $42.99) has violated a previously mentioned technical support level at an upward trendline connecting its November-April chart lows, which, following prior distributional action, may be considered another "early" sell signal. Its loss with higher volume indicates more distributional pressure and raises concerns. It is now testing important chart support again near its 50-day moving average (DMA) line. NFLX was first featured at $37.13 in the 1/29/09 CANSLIM.net Mid-Day Breakouts Report (read here).
C A N S L I M | StockTalk | News | Chart | SEC | Zacks Reports | ![]()
![]()
![]()
View all notes | Alert me of new notes | CANSLIM.net Company Profile
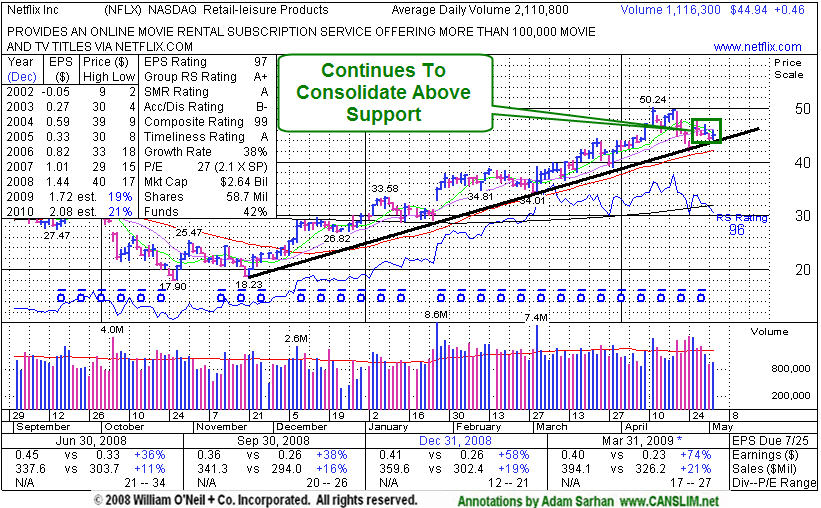
Netflix Inc. (NFLX +$0.46 or +1.03% to $44.94) continues consolidating its latest move above its multi month upward trendline and 50 day moving average (DMA) line on Monday. Volume has dried up in recent sessions as this stock offers investors another chance to accumulate a position above support. This high-ranked leader has been noted as "extended from a proper base."
Initial gains for new all-time highs above its 2/13/09 high (which was the basis for its latest pivot point) lacked volume, leaving some concerns. By the time significant volume indicative of institutional accumulation (the I criteria) arrived behind its considerable gain on 4/13/09 for new all-time high, it was too extended from a proper base to be considered buyable under the investment system's guidelines. Patience may allow for disciplined investors to accumulate shares at a secondary buy point, perhaps on light volume pullbacks near technical support near its 50 DMA line and recent chart lows above $40. Or the stock may eventually form a new, sound base, which many high-ranked leaders do during bull markets.
Disciplined investors avoid chasing extended stocks more than +5% above their pivot point, which can increase the chances they might be forced to sell for a 7-8% loss on an ordinary, healthy consolidation. NFLX was first featured at $37.13 in yellow on Thursday, January 29, 2009 in the CANSLIM.net Mid Day Breakouts Report (read here).
C A N S L I M | StockTalk | News | Chart | SEC | Zacks Reports | ![]()
![]()
![]()
View all notes | Alert me of new notes | CANSLIM.net Company Profile
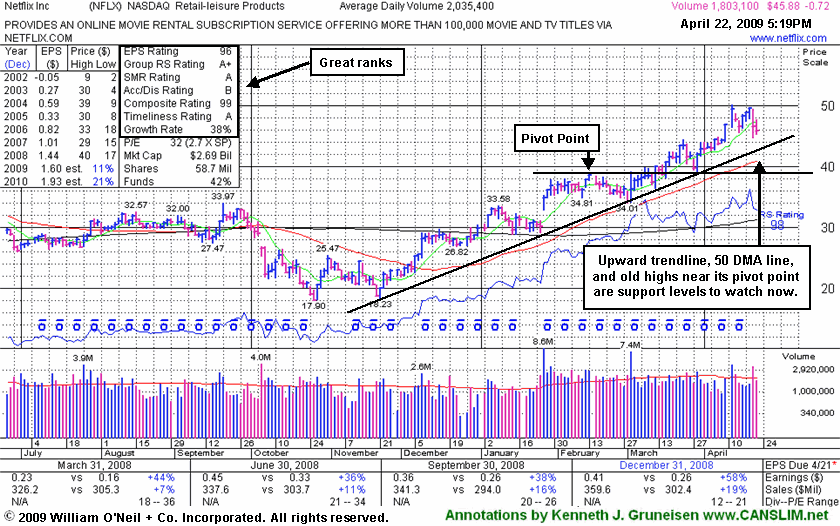
Netflix Inc (NFLX -$0.72 or -3.28% to $45.88) suffered a small loss today on lighter volume after a loss on 4/21/09 on higher volume was noted as a sign of "distributional pressure." The company is due to report Q1 earnings following Thursday's close. Volume and volatility are often greater than usual in response to fresh earnings news and guidance, so extra caution and watchfulness is advised during earnings season. This high-ranked leader has been noted as "extended from a proper base." Technical support is at an upward trendline connecting recent chart lows, then there is additional support at its 50 DMA line (now $40.90).
Initial gains for new all-time highs above its 2/13/09 high (which was the basis for its latest pivot point) lacked volume, leaving some concerns. By the time significant volume indicative of institutional accumulation (the I criteria) arrived behind its considerable gain on 4/13/09 for new all-time high, it was too extended from a proper base to be considered buyable under the investment system's guidelines. Patience may allow for disciplined investors to accumulate shares at a secondary buy point, perhaps on light volume pullbacks near technical support near its 50 DMA line and recent chart lows in the $40 area. Or the stock may eventually form a new, sound base, which many high-ranked leaders do during bull markets.
Disciplined investors avoid chasing extended stocks more than +5% above their pivot point, which can increase the chances they might be forced to sell for a 7-8% loss on an ordinary, healthy consolidation. NFLX was first featured at $37.13 in yellow on Thursday, January 29, 2009 in the CANSLIM.net Mid Day Breakouts Report (read here).
C A N S L I M | StockTalk | News | Chart | SEC | Zacks Reports | ![]()
![]()
![]()
View all notes | Alert me of new notes | CANSLIM.net Company Profile
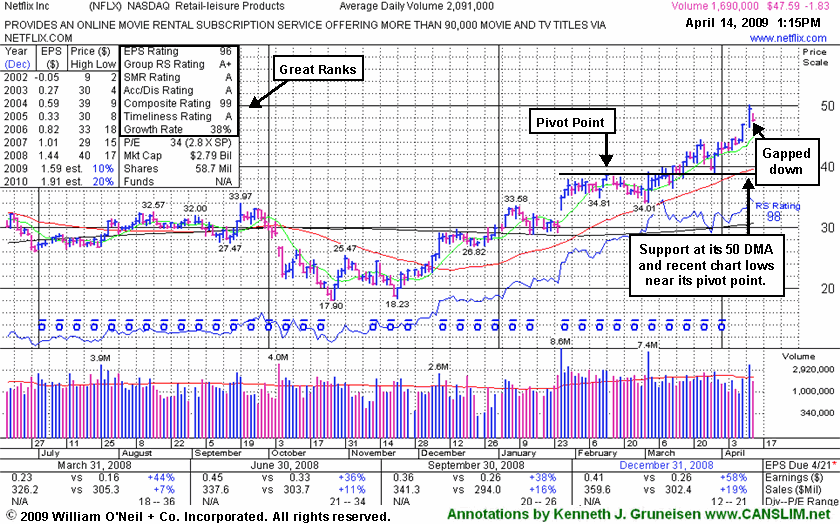
Netflix Inc (NFLX -$1.62 or -3.28% to $47.80) gapped down today after an analyst downgrade. Initial gains for new all-time highs above its 2/13/09 high (which was the basis for its latest pivot point) lacked volume, leaving some concerns. By the time significant volume indicative of institutional accumulation (the I criteria) arrived behind its considerable gain on 4/13/09 for new all-time high, it was too extended from a proper base to be considered buyable under the investment system's guidelines. Patience may allow for disciplined investors to accumulate shares at a secondary buy point, perhaps on light volume pullbacks near technical support near its 50 DMA line and recent chart lows in the $40 area. Or the stock may eventually form a new, sound base, which many high-ranked leaders do during bull markets.
Disciplined investors avoid chasing extended stocks more than +5% above their pivot point, which can increase the chances they might be forced to sell for a 7-8% loss on an ordinary, healthy consolidation. NFLX was first featured at $37.13 in yellow on Thursday, January 29, 2009 in the CANSLIM.net Mid Day Breakouts Report (read here).
C A N S L I M | StockTalk | News | Chart | SEC | Zacks Reports | ![]()
![]()
![]()
View all notes | Alert me of new notes | CANSLIM.net Company Profile
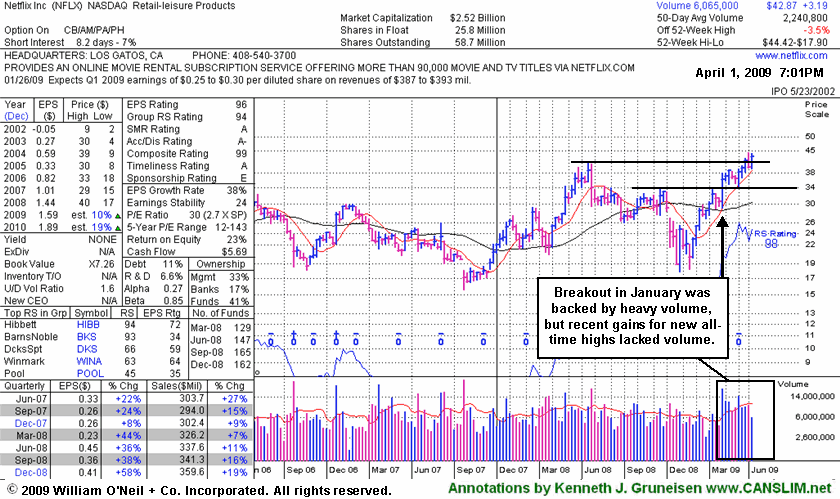
Netflix Inc (NFLX -$0.05 or -0.12% to $42.87) quietly held its ground near all-time highs today, a sign that few investors were headed for the exit. Its breakout in January was backed by heavy volume. It posted 3 consecutive weekly gains with above average volume at that time. However, its most recent gains for new all-time highs above its 2/13/09 high (which was the basis for its latest pivot point) lacked volume, leaving some concerns. An upward trendline (not drawn on the chart below) and prior chart highs both come into play near $38, serving as an initial technical support level above its 50-day moving average (DMA) line. NFLX was first featured at $37.13 in yellow on Thursday, January 29, 2009 in the CANSLIM.net Mid Day Breakouts Report (read here).
C A N S L I M | StockTalk | News | Chart | SEC | Zacks Reports | ![]()
![]()
![]()
View all notes | Alert me of new notes | CANSLIM.net Company Profile
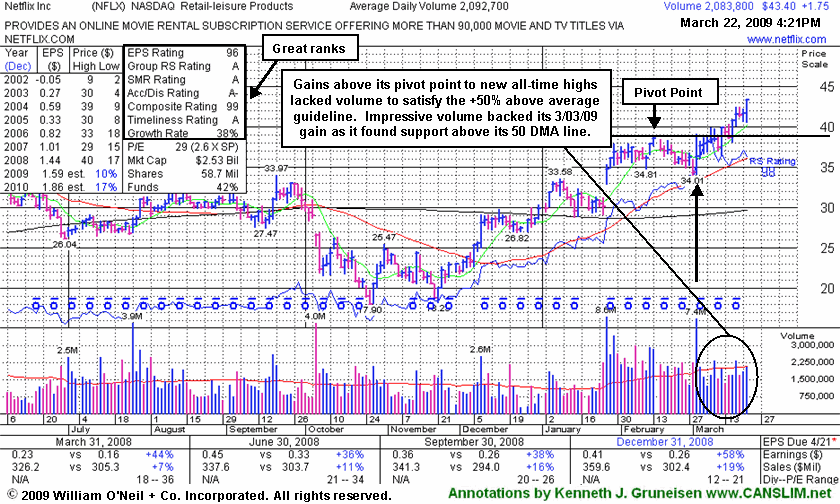
Netflix Inc (NFLX +$1.75 or +4.20% to $43.40) hit another new all-time high today as it rose well above its "max buy" price, however volume was near average yet again. No overhead supply remains to act as resistance for NFLX now, however it is even more extended from a proper buy point - making it a riskier buy candidate. Its impressive gain on 3/03/09 was backed by very heavy volume as it found support above its 50-day moving average (DMA) line. It was previously noted that, "lackluster volume behind its recent gains has not offered a very bullish indication of serious accumulation by the institutional (the I criteria) crowd." That is because subsequent gains have come in under the minimum guideline for buyable stocks calls which calls for gains above the pivot point backed by at least +50% above average volume. Disciplined investors do not get reckless and sloppy with their buy and sell decisions, and they avoid chasing extended stocks. In a healthy bull market there are many strong leaders that provide opportunities to buy sound breakouts without compromising. It is still very early in the present confirmed rally. After a follow-through day provides confirmation, the best buy candidates typically emerge in the first 13-weeks. Watch for an expansion in leadership, and do no get frustrated by those issues which run up without offering an opportunity for a proper, disciplined purchase.
Important support levels to watch now are prior chart highs in the $38 area that were the basis for its latest pivot point, and then its 50-day moving average (DMA) line. NFLX was first featured in the 1/29/09 CANSLIM.net Mid-Day Breakouts Report (read here). It gapped up on 1/27/09 clearing a bullish cup-with-handle pattern after its latest quarterly financial report showed accelerating sales revenues and earnings growth. Its 4 latest comparisons showed earnings increases above the +25% guideline (meeting the C criteria).
C A N S L I M | StockTalk | News | Chart | SEC | Zacks Reports | ![]()
![]()
![]()
View all notes | Alert me of new notes | CANSLIM.net Company Profile
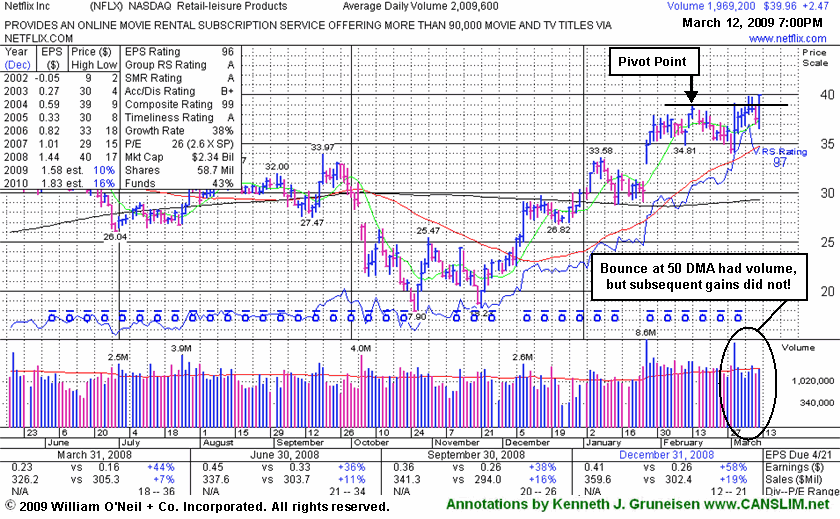
Netflix Inc (NFLX +$2.47 or +6.59% to $39.96) posted a considerable gain today for a new high close, however volume was just near average, not meeting the minimum guideline for buyable stocks which calls for gains above the pivot point backed by at least +50% above average volume. There is very little overhead supply remaining to act as resistance, yet caution and patience are suggested, as the lackluster volume behind its recent gains has not offered a bullish indication of serious accumulation by the institutional (the I criteria) crowd or a favorable supply/demand (the S criteria) scenario. It has been rising to challenge its April 2008 all-time high of $40.90 (not shown) and it would be very reassuring to see substantial volume behind any move into new high ground. Meanwhile, its competitor Blockbuster Inc (BBI) is reportedly mulling bankruptcy. It has been forming a base-on-base type pattern, while it has yet to rally above its all-time high April 2008 (not shown below).
An upward trendline can be considered an important support level just above its 50 DMA line, with the next support at prior chart highs in the $33 area. First featured in the 1/29/09 CANSLIM.net Mid-Day Breakouts Report (read here). It gapped up on 1/27/09 clearing a bullish cup-with-handle pattern after its latest quarterly financial report showed accelerating sales revenues and earnings growth. Its 4 latest comparisons showed earnings increases above the +25% guideline (meeting the C criteria).
C A N S L I M | StockTalk | News | Chart | SEC | Zacks Reports | ![]()
![]()
![]()
View all notes | Alert me of new notes | CANSLIM.net Company Profile
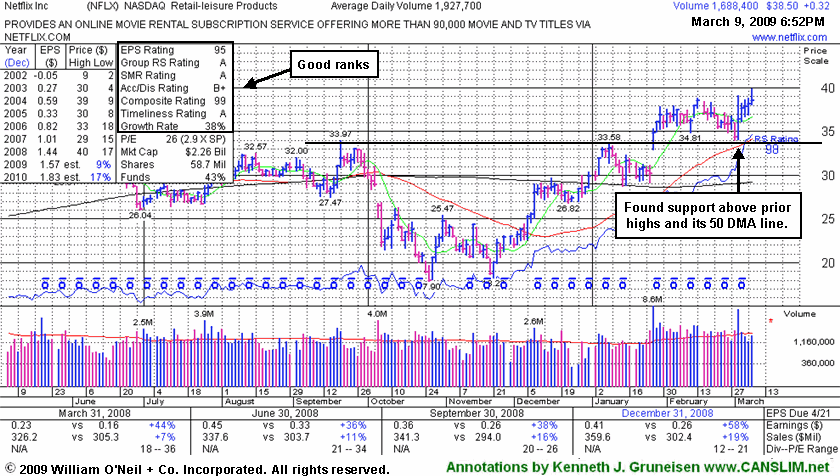
Netflix Inc (NFLX +$0.32 or +0.84% to $38.50) posted a 5th consecutive gain with near average volume today, rising to challenge prior chart highs its April 2008 all-time high - while its competitor Blockbuster Inc (BBI) is reportedly mulling bankruptcy. It has been forming a base-on-base type pattern, while it has yet to rally above its all-time high of $40.90 from April 2008 (not shown below). There is very little overhead supply remaining to act as resistance while it is now trading within close striking distance (less than 6% away) of all-time highs, however poor market conditions (M criteria) still warrant caution. Its color code was changed to yellow with new pivot point and max buy levels recently noted. Its 50 DMA line coincides with some prior chart highs in the $33 area, making that an important support level. NFLX was first featured in the 1/29/09 CANSLIM.net Mid-Day Breakouts Report (read here). It gapped up on 1/27/09 clearing a bullish cup-with-handle pattern after its latest quarterly financial report showed accelerating sales revenues and earnings growth. Its 4 latest comparisons showed earnings increases above the +25% guideline (meeting the C criteria).
C A N S L I M | StockTalk | News | Chart | SEC | Zacks Reports | ![]()
![]()
![]()
View all notes | Alert me of new notes | CANSLIM.net Company Profile
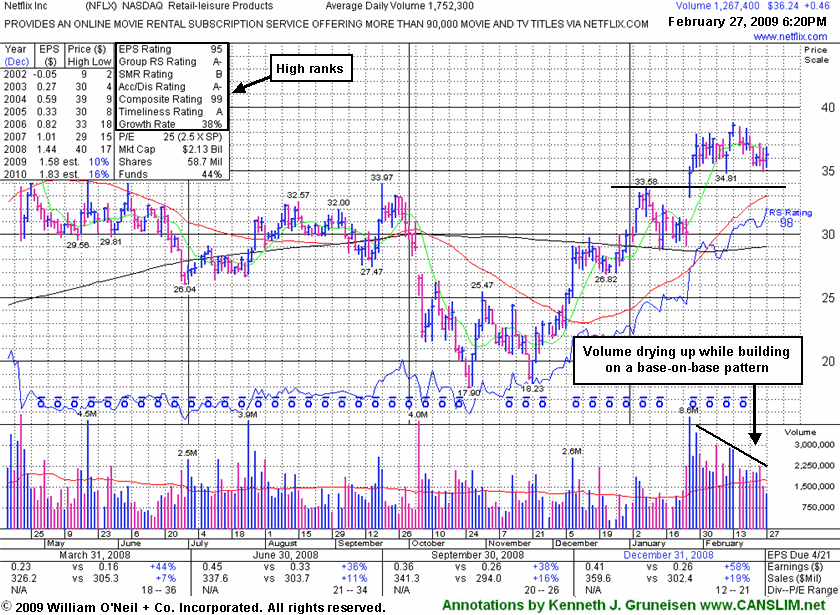
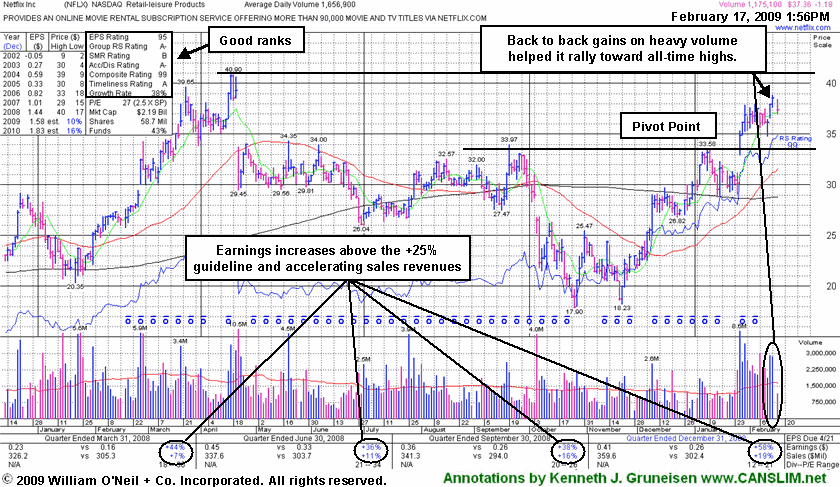
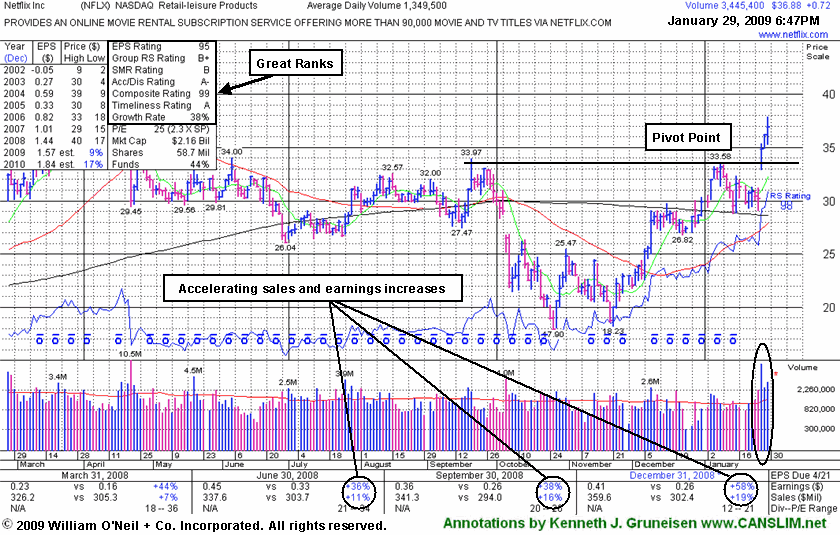
Netflix Inc (NFLX +$0.46 or +1.29% to $36.24) has been consolidating in a tight range for the past 5-weeks with volume drying up, building a base-on-base type pattern. Prior chart highs in the $33 area and its 50-day moving average (DMA) line are key chart support to watch, where any violations would raise concerns and trigger technical sell signals. It was first featured in the 1/29/09 CANSLIM.net Mid-Day Breakouts Report (read here), then later that evening it was covered in greater detail with an annotated graphs under the headline "Netflix Shows Accelerating Sales and Earnings Growth And Bullish Chart Action" (read here). Its last appearance in this FSU section was on Tuesday, February 17, 2009 under the headline "Flicker of Brilliance in a Market Lacking Leadership" (read here).
There is little overhead supply remaining to act as resistance while it is now trading within close striking distance of its all-time high (not shown) reached last April near $40. It gapped up on 1/27/09 clearing a bullish cup-with-handle pattern after its latest quarterly financial report showed accelerating sales revenues and earnings growth. Its 4 latest comparisons showed earnings increases above the +25% guideline (meeting the C criteria).
C A N S L I M | StockTalk | News | Chart | SEC | Zacks Reports | ![]()
![]()
![]()
View all notes | Alert me of new notes | CANSLIM.net Company Profile
Netflix Inc (NFLX -$1.32 or -3.42% to $37.22) pulled back today on volume closer to its average daily volume total. That followed 2 consecutive gains with well above average volume last week, kicked off by a gap up on 2/12/09. There is little overhead supply remaining to act as resistance while it is now trading within close striking distance of its all-time high reached last April near $40. NFLX was first featured in the 1/29/09 CANSLIM.net Mid-Day Breakouts Report (read here), then later that evening it was covered in greater detail with an annotated graphs under the headline "Netflix Shows Accelerating Sales and Earnings Growth And Bullish Chart Action" (read here). It gapped up on 1/27/09 clearing a bullish cup-with-handle pattern after its latest quarterly financial report showed accelerating sales revenues and earnings growth. Its 4 latest comparisons showed earnings increases above the +25% guideline (meeting the C criteria). Prior chart highs in the $33 area and its 50-day moving average (DMA) line are key chart support to watch, where any violations would raise concerns and trigger technical sell signals.
C A N S L I M | StockTalk | News | Chart | SEC | Zacks Reports | ![]()
![]()
![]()
View all notes | Alert me of new notes | CANSLIM.net Company Profile
Netflix Inc (NFLX +$0.72 or +1.99% to $36.88) posted a gain with above average volume for a third consecutive session, which has it getting extended from a prior base and on course to challenge all-time highs near $40. It gapped up on 1/27/09 clearing a bullish cup-with-handle pattern after its latest quarterly financial report showed accelerating sales revenues and earnings growth. Its 4 latest comparisons showed earnings increases above the +25% guideline (meeting the C criteria). Watch for the market environment to improve while patient and disciplined investors may have a future opportunity to accumulate shares on light volume pullbacks under its "max buy" level toward prior chart highs in the $33 area, which is now a key chart support level.
This stock was first featured today in the CANSLIM.net Mid Day Breakouts Report (read here). It has shown accelerating sales and earnings growth since the last time it had been noted prior to today's appearance - on April 17, 2008 when it was hitting new all-time highs above $40 (not shown below because it is obscured by the datablock). At the time we observed "Its latest quarterly financial report showed unimpressive sales revenues and earnings growth and yet another sequential slowdown. However, it has been steadily advancing since its impressive 2/27/08 gap up above prior chart highs in the $29 area after the company raised its outlook." Today the stock is a stronger buy candidate based on the guidelines, however market conditions (the M criteria) and lack of leadership remains a concern.
C A N S L I M | StockTalk | News | Chart | SEC | Zacks Reports | ![]()
![]()
![]()
View all notes | Alert me of new notes | CANSLIM.net Company Profile