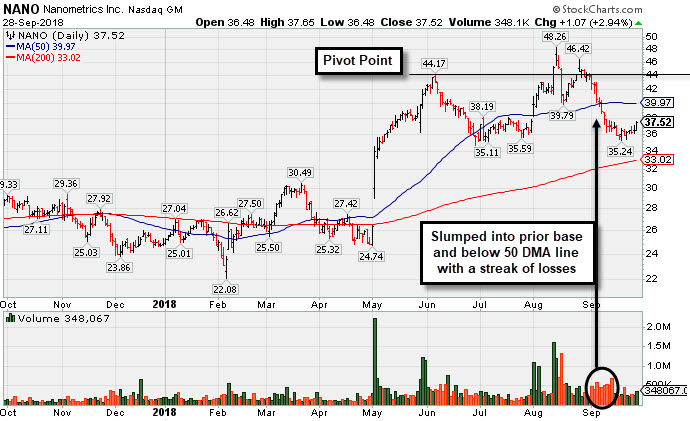
Rebound Above 50-Day Average Needed For Outlook to Improve - Friday, September 28, 2018
Nanometrics Inc (NANO +$1.07 or +2.94% to $37.52) has slumped well below its 50-day moving average (DMA) line ($39.97) with recent volume-driven losses raising concerns. The prior low ($34.72 on 6/28/18) defines important near-term support above its 200 DMA line. A rebound above the 50 DMA line is needed for its outlook to improve.
It was highlighted in yellow with pivot point cited based on its 6/06/18 high plus 10 cents in the 8/13/18 mid-day report (read here). It hit a new 52-week high with a big gain backed by 5 times average volume, rallying from a cup shaped base and triggering a technical buy signal. It was last shown in this FSU section on 8/13/18 with an annotated graph under the headline, "Five Times Average Volume Behind Breakout Gain".
It has earned the highest possible earnings Per Share Rating of 99, a sign of an exceptionally strong earnings growth track record. Fundamentals remain strong. Recent quarters through Jun '18 showed much better sales and earnings increases versus the year earlier. Annual earnings (A criteria) have improved greatly since a downturn and losses FY '13 and '14.
The small number of only 24.1 million shares outstanding (S criteria) can contribute to greater volatility in the event of institutional buying or selling. The high-ranked Electronics - Semiconductor Equipment firm saw the number of top-rated funds owning its shares fall from 318 in Sep '17 to 313 in Jun '18. The current Up/Down Volume Ratio of 1.0 is an indication its shares have been neutral concerning accumulation/distribution over the past 50 days. It has earned a B Timeliness rating and a B Sponsorship Rating.
Charts used courtesy of www.stockcharts.com
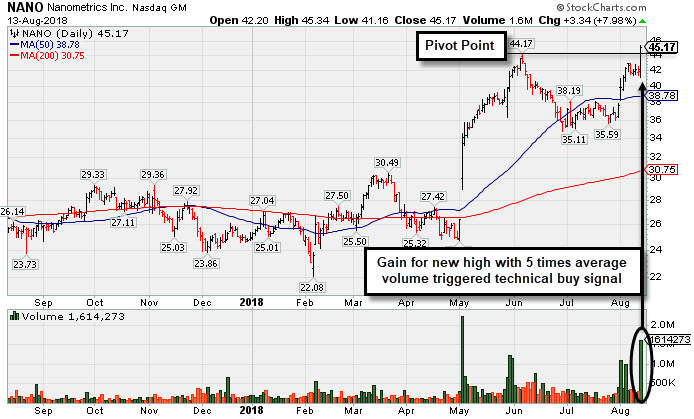
Five Times Average Volume Behind Breakout Gain - Monday, August 13, 2018
Nanometrics Inc (NANO +$3.34 or +7.98% to $45.17) finished strong after highlighted in yellow with pivot point cited based on its 6/06/18 high plus 10 cents in the earlier mid-day report (read here). It hit a new 52-week high with today's big gain backed by 5 times average volume, rallying from a cup shaped base and triggering a technical buy signal. It faces no resistance due to overhead supply.
It has earned the highest possible earnings Per Share Rating of 99, a sign of an exceptionally strong earnings growth track record. Recent quarters through Jun '18 showed much better sales and earnings increases versus the year earlier. Annual earnings (A criteria) have improved greatly since a downturn and losses FY '13 and '14.
The small number of only 24.1 million shares outstanding (S criteria) can contribute to greater volatility in the event of institutional buying or selling. The high-ranked Electronics - Semiconductor Equipment firm saw the number of top-rated funds owning its shares fall from 318 in Sep '17 to 302 in Jun '18. The current Up/Down Volume Ratio of 1.1 is only a slightly bullish indication its shares have been under accumulation over the past 50 days. It has earned a A Timeliness rating and a B Sponsorship Rating.
Charts used courtesy of www.stockcharts.com