New High After Finding Prompt Support Near 50-Day Moving Average - Thursday, September 12, 2024
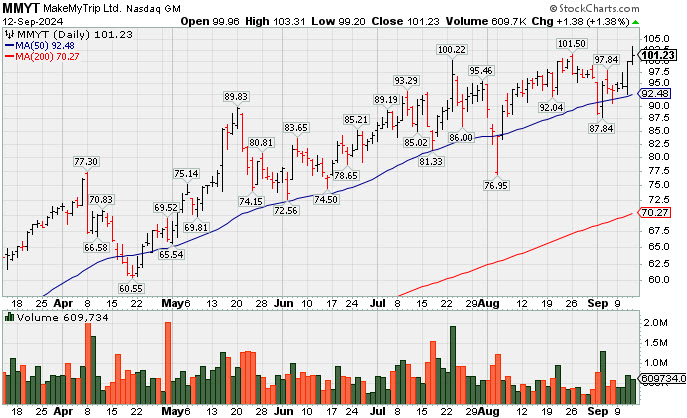
MakeMyTrip (MMYT +$1.38 or +1.38% to $101.23) posted a 4th consecutive gain today for a new all-time high. Recently it found prompt support near its 50-day moving average (DMA) line ($92.51).
MMYT finished strong after highlighted in yellow with pivot point cited based on its 7/10/24 high plus 10 cents in the 7/23/24 mid-day report (read here). It was shown in detail in this FSU section on 8/26/24 with an annotated graph under the headline, "Reversed Into Red After Quietly Touching a New High". Through Jun '24 its quarterly earnings growth has been strong and well above the +25% minimum guideline (C criteria). After years of steadily shrinking losses it has shown great earnings growth in FY '22 and '23. The company has a 99 Earnings Per Share Rating.
The number of top-rated funds owning its shares rose from 287 in Sep '23 to 484 in Jun '24, a reassuring sign concerning the I criteria. Its small supply of only 72.4 million shares in the public float can contribute to greater price volatility in the event of any institutiuonal buying or selling. It has an A Timeliness Rating and a B- Accumulation/Distribution Rating.
Reversed Into Red After Quietly Touching a New High - Monday, August 26, 2024
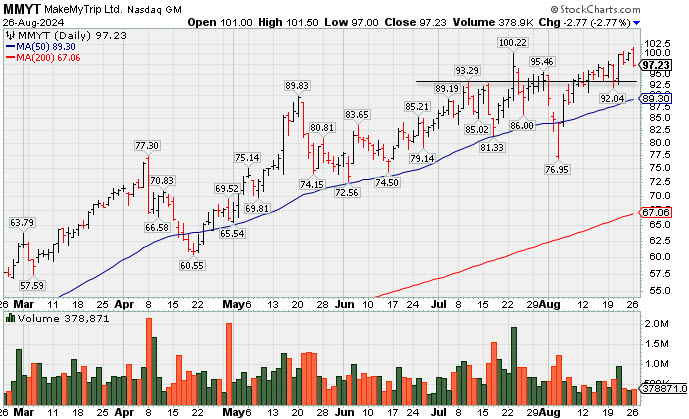
MakeMyTrip (MMYT -$2.77 or -2.77% to $97.23) had another "negative reversal" today for a loss with light volume after touching a new all-time high. It posted a big gain on 8/21/24 with +34% above-average volume and ended near the session high for a best-ever close. Recently it found prompt support near its 50-day moving average (DMA) line ($89.30).
MMYT finished strong after highlighted in yellow with pivot point cited based on its 7/10/24 high plus 10 cents in the 7/23/24 mid-day report (read here). It was shown in detail that evening with an annotated graph under the headline, "Volume Driven Trip to New Highs". Through Mar '24 its quarterly earnings growth has been strong and well above the +25% minimum guideline (C criteria). After years of steadily shrinking losses it has shown great earnings growth in FY '22 and '23. The company has a 99 Earnings Per Share Rating.
The number of top-rated funds owning its shares rose from 287 in Sep '23 to 469 in Jun '24, a reassuring sign concerning the I criteria. Its small supply of only 72.4 million shares in the public float can contribute to greater price volatility in the event of any institutiuonal buying or selling. It has an A Timeliness Rating and a C+ Accumulation/Distribution Rating.
Volume Driven Trip to New Highs - Tuesday, July 23, 2024
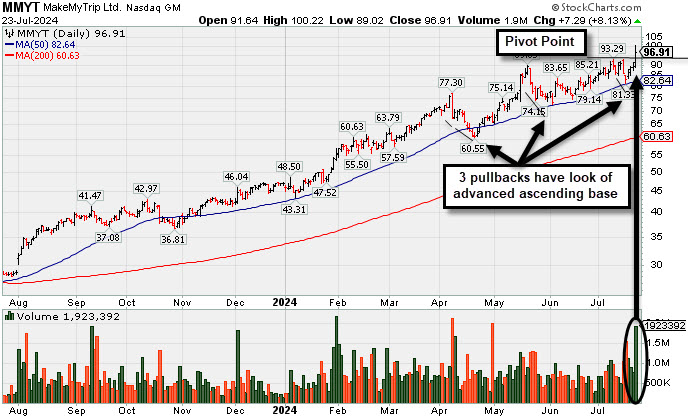
MakeMyTrip (MMYT +$7.29 or +8.13 to $96.91) finished strong after highlighted in yellow with pivot point cited based on its 7/10/24 high plus 10 cents in the earlier mid-day report (read here). It powered to a new all-time high with today's 4th consecutive volume-driven gain triggering a technical buy signal . It tested its 50-day moving average (DMA) line ($82.59) and has ralllied from an advanced "ascending base".
Through Mar '24 its quarterly earnings growth has been strong and well above the +25% minimum guideline (C criteria). After years of steadily shrinking losses it has shown great earnings growth in FY '22 and '23. The company has a 98 Earnings Per Share Rating.
The number of top-rated funds owning its shares rose from 287 in Sep '23 to 437 in Jun '24, a reassuring sign concerning the I criteria. Its small supply of only 72.4 million shares in the public float can contribute to greater price volatility in the event of any institutiuonal buying or selling. It has an A Timeliness Rating and a B Accumulation/Distribution Rating.
Chart courtesy of www.stockcharts.com


| Symbol/Exchange Company Name Industry Group | PRICE | CHANGE | Day High | Volume (% DAV) (% 50 day avg vol) | 52 Wk Hi | Featured Date | Price Featured | Pivot Featured |
| Max Buy | ||||||||
TransDigm Group Aerospace/Defense | $1,287.13 | +31.28 2.49% | $1,296.38 | 204,000 50 DAV is 245,000 | $1,369.58 -6.02% | 4/12/2024 | $1,224.21 | PP = $1,246.32 |
| MB = $1,308.64 | ||||||||
| Most Recent Note - 7/22/2024 5:41:59 PM G - Posted a small gain today with below-average volume. Recently lingering below its 50 DMA line ($1,299) which is now downward sloping. It is -8.3% off its all-time high. A rebound above the 50 DMA line is needed to improve its outlook. Fundamentals remain strong. >>> FEATURED STOCK ARTICLE : Lingering Below 50-Day Moving Average But Only -7% Off High - 7/10/2024 | View all notes | Set NEW NOTE alert | Company Profile | SEC News | Chart | Request a new note | ||||||||
U.S. Lime & Minerals Bldg-Cement/Concrt/Ag | $84.75 | +2.33 2.83% | $85.10 | 81,550 50 DAV is 110,000 | $84.19 0.67% | 6/18/2024 | $71.26 | PP = $75.77 |
| MB = $79.56 | ||||||||
| Most Recent Note - 7/22/2024 5:39:15 PM G - Posted a gain today with below-average volume, ending at a best-ever close near its all-time high. Color code is changed to green after rising above its "max buy" level. Found support while consolidating above its 50 DMA line ($72). Do not be confused as shares split 5:1 (Featured Price and Pivot Point were adjusted). >>> FEATURED STOCK ARTICLE : Recent Breakout Triggered New (or Add-On) Technical Buy Signal - 7/22/2024 | View all notes | Set NEW NOTE alert | Company Profile | SEC News | Chart | Request a new note | ||||||||
Celestica Elec-Contract Mfg | $57.88 | +0.98 1.72% | $58.70 | 1,463,220 50 DAV is 2,140,000 | $63.49 -8.84% | 7/6/2024 | $57.62 | PP = $61.16 |
| MB = $64.22 | ||||||||
| Most Recent Note - 7/19/2024 4:52:21 PM Y - Halted its slide today following 2 consecutive volume-driven losses testing its 50 DMA line after quietly touching a new all-time high. Repeatedly noted - "A gain backed by at least +40% above average volume and a close above the new pivot point cited based on its 5/28/24 high plus 10 cents may trigger a proper technical buy signal. Important support is at its 50 DMA line ($54.60)." See the latest FSU analysis for more details and a new annotated graph. >>> FEATURED STOCK ARTICLE : Testing 50-Day Moving Average Line After Wedging to New High - 7/19/2024 | View all notes | Set NEW NOTE alert | Company Profile | SEC News | Chart | Request a new note | ||||||||
Novo Nordisk ADR Medical-Ethical Drugs | $133.28 | +0.10 0.08% | $134.67 | 2,130,814 50 DAV is 3,780,000 | $148.15 -10.04% | 6/7/2024 | $143.06 | PP = $138.38 |
| MB = $145.30 | ||||||||
| Most Recent Note - 7/18/2024 12:01:52 PM G - Abruptly slumping with heavier volume behind today's damaging loss. Color code was changed to green after violating its 50 DMA line ($138.08) raising concerns and triggering a technical sell signal. Only a prompt rebound above the 50 DMA line would help its outlook improve. Fundamentals remain strong. >>> FEATURED STOCK ARTICLE : Perched Near All-Time High Following Recent Gap Up With Volume - 7/1/2024 | View all notes | Set NEW NOTE alert | Company Profile | SEC News | Chart | Request a new note | ||||||||
Granite Construction Bldg-Heavy Construction | $67.64 | +2.07 3.16% | $68.06 | 1,004,904 50 DAV is 612,000 | $66.72 1.38% | 6/11/2024 | $59.76 | PP = $64.33 |
| MB = $67.55 | ||||||||
| Most Recent Note - 7/22/2024 5:40:36 PM Y - Posted a small gain today with lighter volume while hovering near its all-time high. Prior highs in the $64 area define initial support to watch above its 50 DMA line ($62). >>> FEATURED STOCK ARTICLE : Granite Testing Support at 50-Day Moving Average - 7/2/2024 | View all notes | Set NEW NOTE alert | Company Profile | SEC News | Chart | Request a new note | ||||||||
| Symbol/Exchange Company Name Industry Group | PRICE | CHANGE | Day High | Volume (% DAV) (% 50 day avg vol) | 52 Wk Hi | Featured Date | Price Featured | Pivot Featured |
| Max Buy | ||||||||
Datadog Inc Computer Sftwr-Enterprse | $123.21 | +1.99 1.64% | $125.35 | 2,309,234 50 DAV is 3,689,300 | $138.61 -11.11% | 7/9/2024 | $126.92 | PP = $138.71 |
| MB = $145.65 | ||||||||
| Most Recent Note - 7/22/2024 5:48:13 PM Y - Color code is changed to yellow after rebounding and closing above its 50 DMA line ($120.80) as today''s gain backed by higher (but still -16% below-average) volume helped its outlook improve. The next important support is at its 200 DMA line ($117.54). >>> FEATURED STOCK ARTICLE : Consolidating Within Close Range of 52-Week High - 7/9/2024 | View all notes | Set NEW NOTE alert | Company Profile | SEC News | Chart | Request a new note | ||||||||
MakeMyTrip Leisure-Travel Booking | $96.91 | +7.29 8.13% | $100.22 | 1,923,197 50 DAV is 770,000 | $93.29 3.88% | 7/23/2024 | $96.92 | PP = $93.39 |
| MB = $98.06 | ||||||||
Y - Finished strong after highlighted in yellow with pivot point cited based on its 7/10/24 high plus 10 cents. Triggered a technical buy signal as it powered to a new all-time high with today's 4th consecutive volume-driven gain after testing its 50 DMA line ($82.59). Rose from an advanced "ascending base". Through Mar '24 its quarterly earnings growth has been strong and well above the +25% minimum guideline (C criteria). After years of steadily shrinking losses it has shown great earnings growth in FY '22 and '23. See the latest FSU analysis for more details and a new annotated graph. >>> FEATURED STOCK ARTICLE : Volume Driven Trip to New Highs - 7/23/2024 | View all notes | Set NEW NOTE alert | Company Profile | SEC News | Chart | Request a new note | ||||||||

