Testing 50-Day Moving Average Line - Thursday, October 3, 2024
Mercadolibre Inc (MELI -$12.01 or -0.61% to $1,958.71) ended slightly lower today with lighter volume after a gap down and volume-driven loss on the prior session undercut its prior low ($1,966). It is testing its 50-day moving average DMA line ($1,960) which defines important near-term support. More damaaging losses would raise concerns and trigger a technical sell signal.
MELI was highlighted in yellow with pivot point cited based on its 5/20/24 high plus 10 cents in the 8/05/24 mid-day report (read here). It last shown in detail on 9/03/24 with an annotated graph under the headline, "Pulled Back From New All-Time High".
MELI has a highest possible Earnings Per Share Rating of 99. It reported Jun '24 quarterly earnings +103% on +42% sales revenues versus the year ago period. Three of the 4 latest quarterly comparisons have shown strong sales revenues and earnings increases well above the +25% minimum guideline (C criteria). Following losses in FY '18 -'20 and annual earnings (A criteria) have improved greatly.
The Latin American Retail - Internet firm has seen top-rated funds owning an interest in the company's shares rise from 2,690 in Sep '23 to 3,059 in Sep '24, a reassuring sign concerning the I criteria. Its current Up/Down Volume Ratio of 1.3 provides an unbiased indication that its shares have been under accumulation over the past 50 days.
Charts courtesy www.stockcharts.com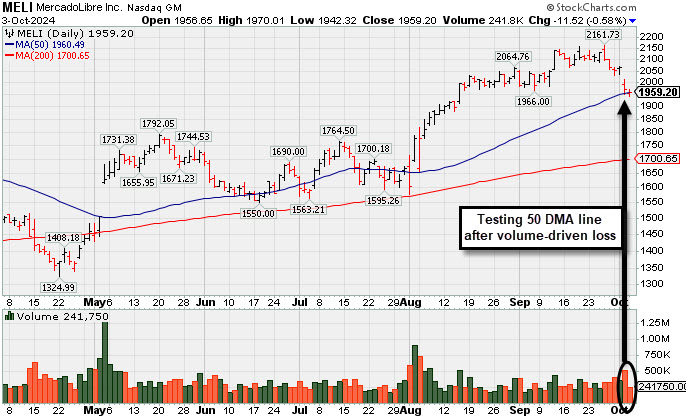
Pulled Back From New All-Time High - Tuesday, September 3, 2024
Mercadolibre Inc (MELI -$71.49 or -3.47% to $1,990.17) pullied back today with above-average volume after hitting a new all-time high on the prior session. The prior highs in the $1825 area defines initial support to watch above trhe 50-day moving average (DMA) line ($1,785).
MELI was highlighted in yellow with pivot point cited based on its 5/20/24 high plus 10 cents in the 8/05/24 mid-day report (read here). It last shown in detail that evening with an annotated graph under the headline, "Finished Flat When Poised to Breakout".
MELI has a highest possible Earnings Per Share Rating of 99. It reported Jun '24 quarterly earnings +103% on +42% sales revenues versus the year ago period. Three of the 4 latest quarterly comparisons have shown strong sales revenues and earnings increases well above the +25% minimum guideline (C criteria). Following losses in FY '18 -'20 and annual earnings (A criteria) have improved greatly.
The Latin American Retail - Internet firm has seen top-rated funds owning an interest in the company's shares rise from 2,690 in Sep '23 to 3,032 in Jun '24, a reassuring sign concerning the I criteria. Its current Up/Down Volume Ratio of 1.5 provides an unbiased indication that its shares have been under accumulation over the past 50 days.
Charts courtesy www.stockcharts.com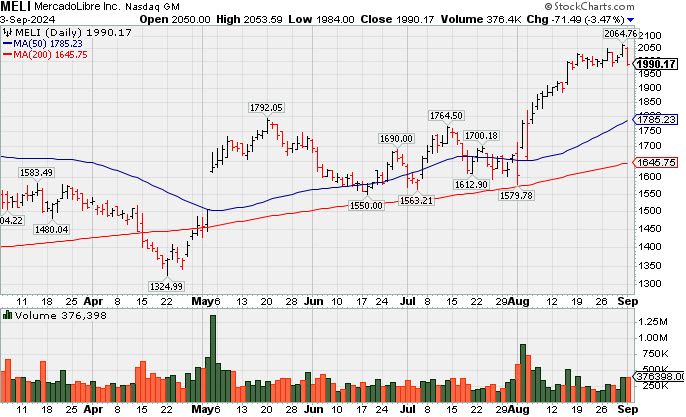
Finished Flat When Poised to Breakout - Monday, August 5, 2024
Mercadolibre Inc (MELI -$0.14 or -0.01% to $1,776.00) finished flat after highlighted in yellow with pivot point cited based on its 5/20/24 high plus 10 cents in the earlier mid-day report (read here). It found prompt support at its 200-day moving average (DMA) line ($1,578) last week and challenged its 52-week high with today's early gain. Subsequent gains and a strong close above the pivot point backed by at least +40% above average volume may trigger a technical buy signal.
MELI has a highest possible Earnings Per Share Rating of 99. It reported Jun '24 quarterly earnings +103% on +42% sales revenues versus the year ago period. Three of the 4 latest quarterly comparisons have shown strong sales revenues and earnings increases well above the +25% minimum guideline (C criteria). Following losses in FY '18 -'20 and annual earnings (A criteria) have improved greatly.
The Latin American Retail - Internet firm has seen top-rated funds owning an interest in the company's shares rise from 2,690 in Sep '23 to 3,010 in Jun '24, a reassuring sign concerning the I criteria. Its current Up/Down Volume Ratio of 0.9provides an unbiased indication that its shares have been under slight distributional pressure over the past 50 days.
Charts courtesy www.stockcharts.com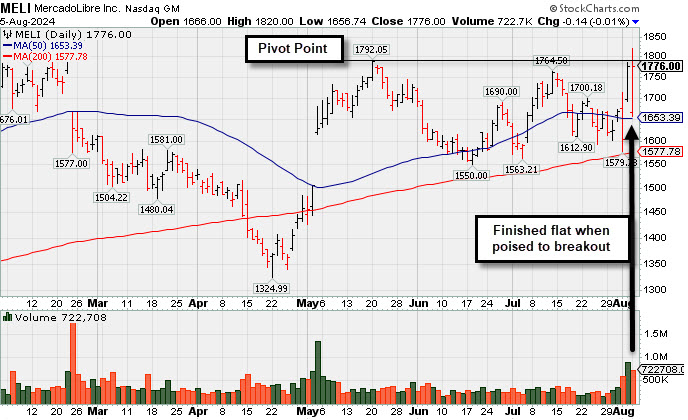
| Symbol/Exchange Company Name Industry Group | PRICE | CHANGE | Day High | Volume (% DAV) (% 50 day avg vol) | 52 Wk Hi | Featured Date | Price Featured | Pivot Featured |
| Max Buy | ||||||||
Transdigm Group Inc AEROSPACE/DEFENSE - Aerospace/Defense Products and; Services | $1,209.45 | -2.82 -0.23% | $1,218.75 | 439,954 50 DAV is 244,900 | $1,369.58 -11.69% | 7/31/2024 | $1,294.22 | PP = $1,369.68 |
| MB = $1,438.16 | ||||||||
Suffered a 2nd volume-driven loss today while sinking further below its 50 DMA line ($1,288) to new lows. A rebound above the 50 DMA line is needed for its outlook to improve. It will be dropped from the Featured Stocks list tonight. >>> FEATURED STOCK ARTICLE : Slump to New Lows Hurts Outlook - 8/2/2024 | View all notes | Set NEW NOTE alert | Company Profile | SEC News | Chart | Request a new note | ||||||||
U.S. Lime & Minerals Bldg-Cement/Concrt/Ag | $74.04 | -4.03 -5.16% | $75.62 | 117,624 50 DAV is 101,000 | $87.13 -15.02% | 6/18/2024 | $71.26 | PP = $75.77 |
| MB = $79.56 | ||||||||
G - Gapped down today for a big volume-driven loss raising concerns then rebounded after deeply undercutting its 50 DMA line ($73.57) to close in the upper third of its intra-day range. Do not be confused as shares split 5:1 (Featured Price and Pivot Point were adjusted). >>> FEATURED STOCK ARTICLE : Recent Breakout Triggered New (or Add-On) Technical Buy Signal - 7/22/2024 | View all notes | Set NEW NOTE alert | Company Profile | SEC News | Chart | Request a new note | ||||||||
Granite Construction Bldg-Heavy Construction | $68.90 | -0.62 -0.89% | $69.29 | 867,791 50 DAV is 722,000 | $73.01 -5.63% | 6/11/2024 | $59.76 | PP = $64.33 |
| MB = $67.55 | ||||||||
G - Pulled back today yet finished near the session high with just a small loss backed by +20% above average volume. Prior highs in the $64 area define initial support to watch above its 50 DMA line ($63.20). >>> FEATURED STOCK ARTICLE : Hit New High While Making Steady Progress - 7/31/2024 | View all notes | Set NEW NOTE alert | Company Profile | SEC News | Chart | Request a new note | ||||||||
MakeMyTrip Leisure-Travel Booking | $83.92 | -0.97 -1.14% | $84.20 | 1,215,012 50 DAV is 753,000 | $100.22 -16.26% | 7/23/2024 | $96.92 | PP = $93.39 |
| MB = $98.06 | ||||||||
Y - Gapped down today considerably undercutting its 50 DMA line ($84.17) then rebounded to close near that important short-term average, ending near the session high. More damaging losses would raise greater concerns. >>> FEATURED STOCK ARTICLE : Volume Driven Trip to New Highs - 7/23/2024 | View all notes | Set NEW NOTE alert | Company Profile | SEC News | Chart | Request a new note | ||||||||
Texas Roadhouse Retail-Restaurants | $161.99 | -4.14 -2.49% | $164.40 | 1,140,582 50 DAV is 834,000 | $177.72 -8.85% | 7/26/2024 | $173.08 | PP = $175.82 |
| MB = $184.61 | ||||||||
G - Gapped down today for a volume-driven loss, slumping further below its 50 DMA line and undercutting the prior lows raising greater concerns. A rebound above the 50 DMA line is needed for its outlook to improve. >>> FEATURED STOCK ARTICLE : Encountered Distributional Pressure When Poised to Break Out - 7/26/2024 | View all notes | Set NEW NOTE alert | Company Profile | SEC News | Chart | Request a new note | ||||||||
| Symbol/Exchange Company Name Industry Group | PRICE | CHANGE | Day High | Volume (% DAV) (% 50 day avg vol) | 52 Wk Hi | Featured Date | Price Featured | Pivot Featured |
| Max Buy | ||||||||
Howmet Aerospace Aerospace/Defense | $86.75 | -3.41 -3.78% | $87.42 | 6,636,695 50 DAV is 3,019,000 | $97.29 -10.83% | 7/30/2024 | $93.95 | PP = $85.52 |
| MB = $89.80 | ||||||||
Y - Pulled back today for a 3rd volume-driven loss testing prior highs in the $85 area which define initial support to watch above its 50 DMA line ($82.17). >>> FEATURED STOCK ARTICLE : Breakaway Gap For Howmet Aerospace - 7/30/2024 | View all notes | Set NEW NOTE alert | Company Profile | SEC News | Chart | Request a new note | ||||||||
MercadoLibre Retail-Internet | $1,776.00 | -0.14 -0.01% | $1,820.00 | 725,300 50 DAV is 311,000 | $1,825.00 -2.68% | 8/5/2024 | $1,793.73 | PP = $1,792.15 |
| MB = $1,881.76 | ||||||||
Y - Finished flat after highlighted in yellow in the earlier mid-day report with pivot point cited based on its 5/20/24 high plus 10 cents. Found prompt support at its 200 DMA line ($1,578) last week and challenged its 52-week high with today''s early gain. Subsequent gains and a strong close above the pivot point backed by at least +40% above average volume may trigger a technical buy signal. Reported Jun ''24 quarterly earnings +103% on +42% sales revenues versus the year ago period. Three of the 4 latest quarterly comparisons have shown strong sales revenues and earnings increases well above the +25% minimum guideline (C criteria). Following losses in FY ''18 -''20 and annual earnings (A criteria) have improved greatly. See the latest FSU analysis for more details and a new annotated graph. >>> FEATURED STOCK ARTICLE : Finished Flat When Poised to Breakout - 8/5/2024 | View all notes | Set NEW NOTE alert | Company Profile | SEC News | Chart | Request a new note | ||||||||
Technical Weakness After Earnings Below System's Guidelines - Friday, August 4, 2017
Mercadolibre Inc (MELI -$31.91 or -10.91% to $260.47) gapped down today and violated its 50-day moving average (DMA) line ($273) triggering a technical sell signal. Volume and volatility often increase near earnings news. Its color code was changed to green.
MELI reported Jun '17 quarterly earnings -18% on +59% sales revenues, raising fundamental concerns. It was highlighted in yellow in the 6/15/17 mid-day report (read here) and it was last shown in this FSU section on 7/26/17 with an annotated graph under the headline, "Little Resistance Remains While Rebounding Near Prior Highs".
The 2 prior quarterly comparisons were well above the +25% minimum earnings guideline (C criteria). Annual earnings growth (A criteria) has been strong and steady.
The Latin American Internet - eCommerce firm has seen top-rated funds owning an interest in the company's shares rise from 339 in Jun '16 to 695 in Jun '17, a reassuring sign concerning the I criteria. Its current Up/Down Volume Ratio of 1.2 provides an unbiased indication that its shares have been under slight accumulation over the past 50 days.
Charts courtesy www.stockcharts.com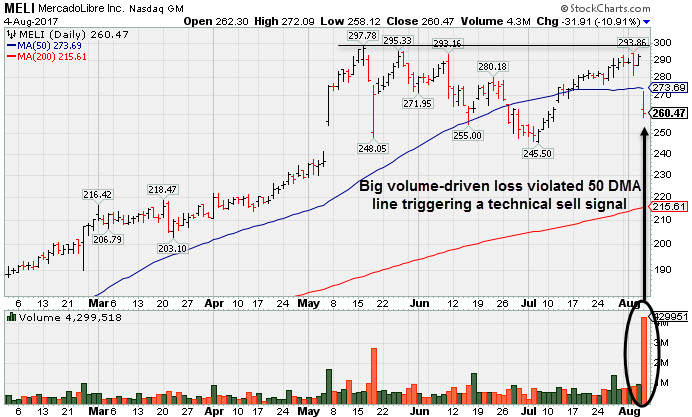
Little Resistance Remains While Rebounding Near Prior Highs - Wednesday, July 26, 2017
Mercadolibre Inc (MELI +$6.76 or +2.42% to $286.02) is consolidating above its 50-day moving average (DMA) line ($273). It faces some resistance due to overhead supply up to the $298 level. Bullish action in recent weeks has been reassuring as it has been rebounding after a deeper consolidation below its 50-day moving average (DMA) line following its appearance highlighted in yellow in the 6/15/17 mid-day report (read here). In this FSU section on 6/15/17 it was shown with an annotated daily graph under the headline, "Test of 10-Week Moving Average May Be a Secondary Buy Point ".
It is due to report Jun '17 quarterly results on 8/06/17. Volume and volatility often increase near earnings news. Recently it reported earnings +64% on +74% sales revenues for the Mar '17 quarter. Three of the past 4 quarterly comparisons were well above the +25% minimum earnings guideline (C criteria). Annual earnings growth (A criteria) has been strong and steady.
The Latin American Internet - eCommerce firm has seen top-rated funds owning an interest in the company's shares rise from 339 in Jun '16 to 681 in Jun '17, a reassuring sign concerning the I criteria. Its current Up/Down Volume Ratio of 1.0 provides an unbiased indication that its shares have been neutral concerning accumulation/distribution over the past 50 days.
Charts courtesy www.stockcharts.com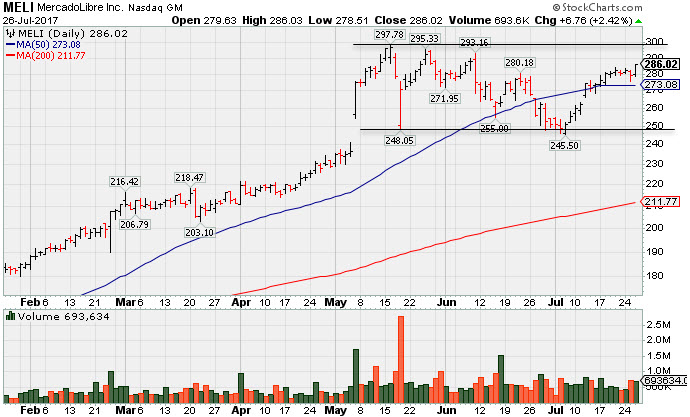
Test of 10-Week Moving Average May Be a Secondary Buy Point - Thursday, June 15, 2017
Mercadolibre Inc (MELI -$1.70 or -0.64% to $263.30) was highlighted in yellow in the earlier mid-day report (read here). A valid secondary buy point exists from the 10-week moving average ($260.73) line up to +5% above the latest high after successfully testing support at its 10 WMA line. Meanwhile, more damaging losses would raise concerns and hurt its outlook.
Recently it reported earnings +64% on +74% sales revenues for the Mar '17 quarter. Three of the past 4 quarterly comparisons were well above the +25% minimum earnings guideline (C criteria). Annual earnings growth (A criteria) has been strong and steady.
The Latin American Internet - eCommerce firm has seen top-rated funds owning an interest in the company's shares rise from 339 in Jun '16 to 615 in Mar '17, a reassuring sign concerning the I criteria. Its current Up/Down Volume Ratio of 1.1 provides an unbiased indication that its shares have been under accumulation only mildly of late. Additional confirming gains backed by volume would be a welcome reassurance.
Its last appearance in this FSU section was on 3/29/12 with an annotated daily graph came under the headline, "Consolidating Below 'Max Buy' Level ".
Charts courtesy www.stockcharts.com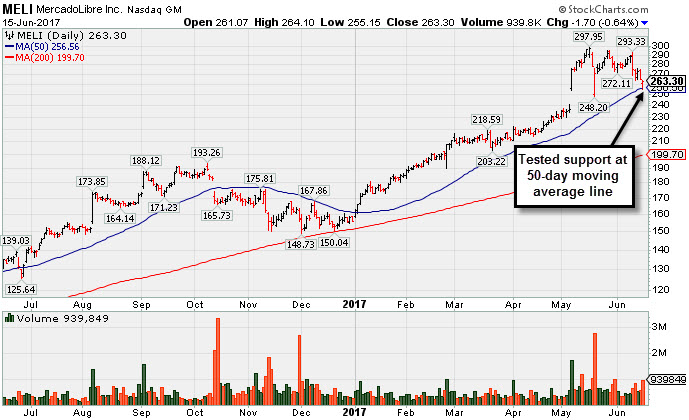
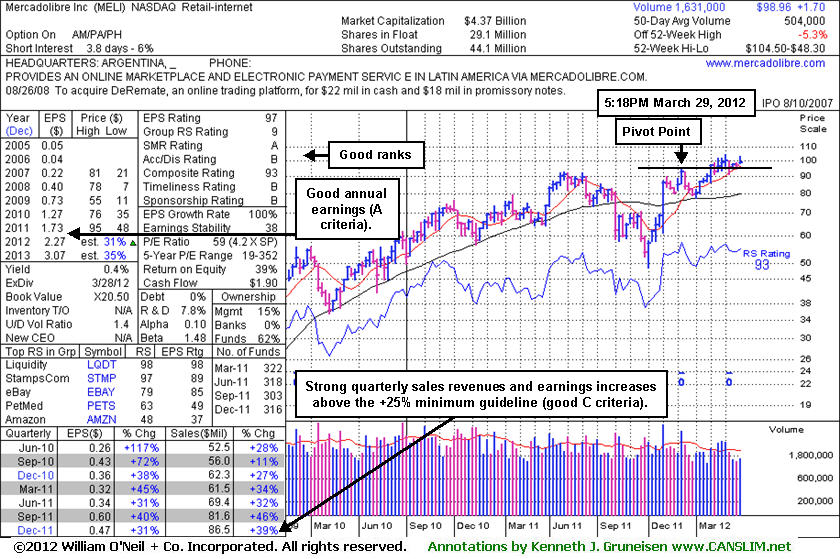
Consolidating Below "Max Buy" Level - Thursday, March 29, 2012
Mercadolibre Inc (MELI -$2.81 or -2.76% to $98.96) slumped back below its "max buy" level ($100.36) with a loss today on light volume and its color code was changed to yellow again. Disciplined investors avoid chasing stocks that are extended more than +5% above their pivot point. The weekly graph below shows that it has recently been consolidating and staying above its 10-week moving average (WMA) line and above the recent low ($91.38 on 3/06/12) defining important support areas to watch. It may be building a new base, yet its consolidation is under the 5-week minimum length for it to be considered a new "flat base" pattern.
Its last appearance in this FSU section was on 2/06/12 with an annotated daily graph came under the headline, "Negative Reversal After Touching New High Following Breakout", yet bullish action afterward included more volume-driven gains into new all-time high territory. The Latin American Internet - eCommerce firm has seen top-rated funds owning an interest in the company's shares rise from 303 in Sep '11 to 316 in Dec '11, but prior reports had noted slightly discouraging signs concerning the I criteria. Its current Up/Down Volume Ratio of 1.4 provides an unbiased indication that its shares have recently been under accumulation. Additional confirming gains backed by volume would be a welcome reassurance.
Disciplined investors limit losses if ever a stock falls -7% from their purchase price. Healthy stocks typically do not fall more than -7% below their pivot point, and the best way to prevent large losses is to follow a strict rule of limiting your losses as the fact-based investment system's rules specify!
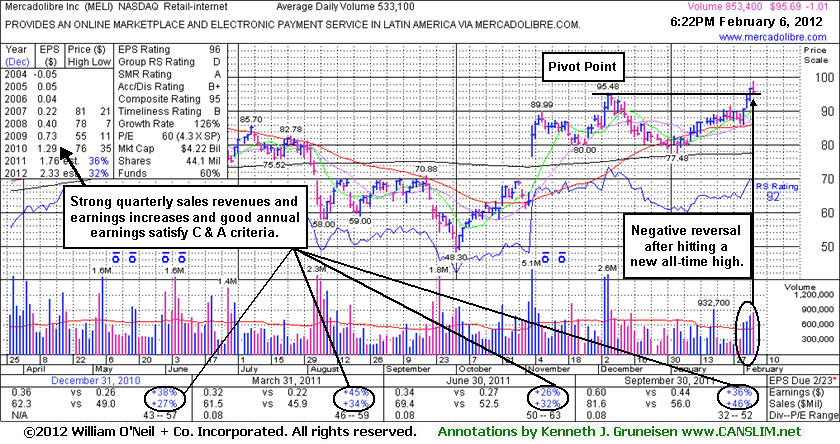
Nnegative Reversal After Touching New High Following Breakout - Monday, February 06, 2012
Often, when a leading stock is setting up to breakout of a solid base it is highlighted in CANSLIM.net's Mid-Day Breakouts Report. The most relevant factors are noted in the report which allows prudent CANSLIM oriented investors to place the issue in their watch list. After doing any necessary backup research, the investor is prepared to act if and when the stock triggers a technical buy signal (breaks above its pivot point on more than +50% average turnover). In the event the stock fails to trigger a technical buy signal and its price declines then it will simply be removed from the watch list. In other cases, stocks may be featured in CANSLIM.net's Mid-Day Breakouts Report.after recent action already triggered technical buy signal. Disciplined investors know to buy as near as possible to the pivot point and avoid chasing stocks after they have rallied more than +5% above their pivot point. It is crucial to always limit losses whenever any stock heads the wrong direction, and disciplined investors sell if a struggling stock ever falls more than -7% from their purchase price.Mercadolibre Inc (MELI -$1.01 or -1.04% to $95.69) touched a new all-time high today then slumped into the red for a "negative reversal" following 3 consecutive gains with above average volume. It was highlighted in yellow earlier in the mid-day report and added to the Featured Stocks list again. The new pivot point cited was based on its 12/06/11 high plus 10 cents after an 8-week cup shaped base without a handle. Technically it broke out on 2/03/12 with its volume-driven gain and strong close.
It had rebounded since weak action prompted it to be dropped from the Featured Stocks list on 12/30/11 as its last appearance in this FSU section with an annotated daily graph came under the headline, "Deterioration and Lack Of Buying Demand Raising Concerns." It found support at its 200-day moving average (DMA) line during the latest orderly consolidation. The Latin American Internet - eCommerce firm has seen top-rated funds owning an interest wane from 323 in Mar '11 to 304 in Dec '11, which prior reports had noted as a slightly discouraging sign concerning the I criteria. Its current Up/Down Volume Ratio of 1.3 provides an unbiased indication that its shares have recently been under accumulation, but additional confirming gains backed by volume would be a welcome reassurance.
The prior FSU analysis had stated - "Its 12/06/11 rally above its pivot point with nearly 4 times average volume had triggered a technical buy signal. However, disciplined investors limit losses if ever a stock falls -7% from their purchase price. Healthy stocks typically do not fall more than -7% below their pivot point, and the best way to prevent large losses is to follow a strict rule of limiting your losses as the fact-based investment system's rules specify! In the event strength returns, any stock that is dropped from the Featured Stocks list may return again in the future at which time a new pivot point may be cited and it will be highlighted in yellow."
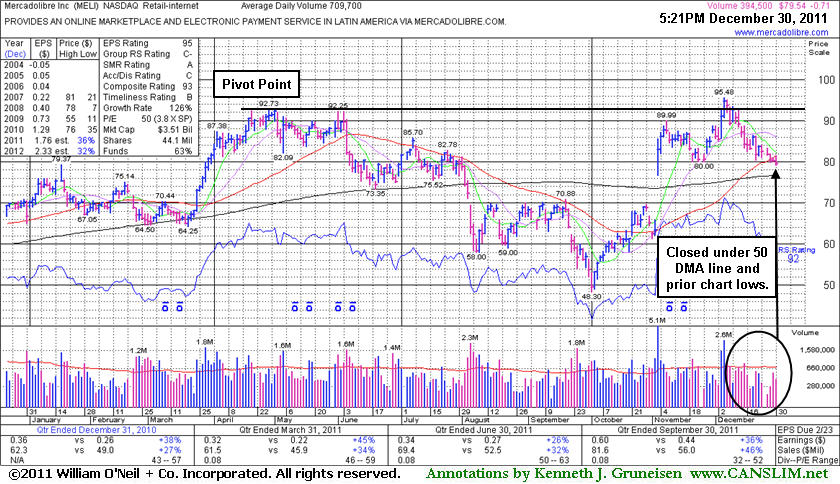
Deterioration and Lack Of Buying Demand Raising Concerns - Friday, December 30, 2011
Mercadolibre Inc (MELI -$0.71 or -0.88% to $79.54) added to its streak of losses with light volume today. It quietly slumped just below its 50-day moving average (DMA) line and below prior lows repeatedly noted as chart support near the $80 area. It stalled after volume-driven gains to new all-time highs in early-December. It has not encountered heavy distributional pressure, however, concerns are raised by the lack of buying demand evidenced by its deterioration and failure to produce any gains in the past few weeks backed by meaningful volume. MELI finished -16.7% off its 52-week high today. Based on the weak action it will be dropped from the Featured Stocks list tonight.Its last appearance in this FSU section was on 12/05/11 with an annotated daily graph under the headline, "Challenging 52-week High After Rebounding From Deep Correction," after featured in that day's mid-day report color coded yellow with new pivot point cited based on its 52-week high plus 10 cents. It had rebounded impressively after a deep consolidation below its 50-day and 200-day moving average (DMA) lines since dropped from the Featured Stocks list on 6/13/11. The Latin American Internet - eCommerce firm has seen top-rated funds owning an interest wane from 323 in Mar '11 to 307 in Sep '11, which prior reports had noted as a slightly discouraging sign concerning the I criteria. Its 12/06/11 rally above its pivot point with nearly 4 times average volume had triggered a technical buy signal. However, disciplined investors limit losses if ever a stock falls -7% from their purchase price. Healthy stocks typically do not fall more than -7% below their pivot point, and the best way to prevent large losses is to follow a strict rule of limiting your losses as the fact-based investment system's rules specify! In the event strength returns, any stock that is dropped from the Featured Stocks list may return again in the future at which time a new pivot point may be cited and it will be highlighted in yellow.
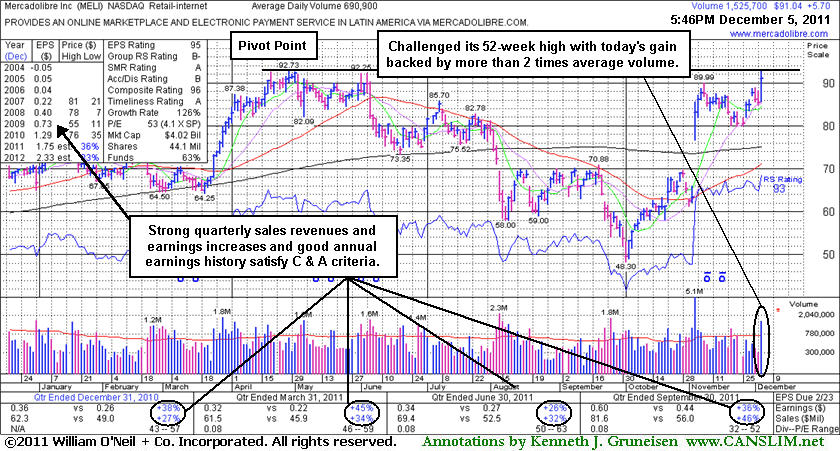
Challenging 52-week High After Rebounding From Deep Correction - Monday, December 05, 2011
Mercadolibre Inc (MELI +$5.70 or +6.68% to $91.04) challenged its 52-week high today and in the mid-day report it was color coded yellow with new pivot point cited based on its 52-week high plus 10 cents. It went through a deep consolidation below its 50-day and 200-day moving average (DMA) lines since dropped from the Featured Stocks list on 6/13/11. Its earnings history has remained strong, still satisfying the C and A criteria. Its last appearance in this FSU section was on 6/03/11 with an annotated daily graph under the headline, "Perched Near Highs While Negative Market Remains a Concern." It was then noted on 6/13/11 - "Down today with slightly higher volume after damaging losses last week violated its 50 DMA line and prior lows triggering technical sell signals. Based on its technical deterioration it will be dropped from the Featured Stocks list tonight." It subsequently fell from $77.31 to as low as $48.30 before making an impressive recovery in recent months.The Latin American Internet - eCommerce firm has seen top-rated funds owning an interest wane from 323 in Mar '11 to 306 in Sep '11, which is a slightly discouraging sign concerning the I criteria. This is a reminder for disciplined investors to watch for a proper technical breakout free of all resistance as a reassuring sign that fresh institutional accumulation is occurring which may lead to a more sustained and significant advance.
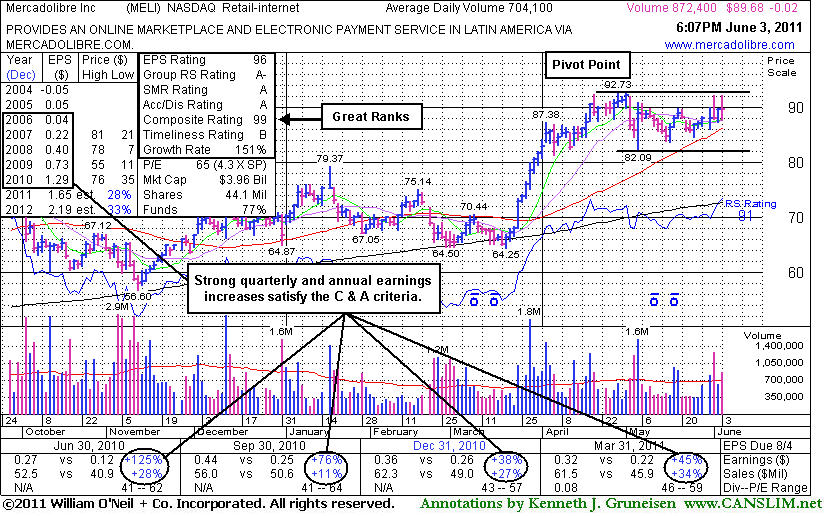
Perched Near Highs While Negative Market Remains a Concern - Friday, June 03, 2011
Mercadolibre Inc (MELI -$0.02 or -0.02% to $89.68) was approaching its all-time high when it was featured in the 6/01/11 mid-day report in yellow and noted with a new pivot point based on its high plus 10 cents. After a short flat base above its 50-day moving average (DMA) line and prior highs which define chart support on pullbacks. A technical breakout with sufficient volume may subsequently confirm a proper new buy signal. However, deteriorating market conditions (M criteria) late this week are again arguing against new buying efforts until a new rally is confirmed with a gain and subsequent follow-through day from at least one of the major averages.
Following its last appearance in this FSU section on 10/19/10 under the headline, "Deterioration Continues Following +41% Rally In Under 5 Months", it was dropped from the Featured Stocks list and went through a long consolidation during which its 200-day moving average (DMA) line acted as support. Meanwhile, its Relative strength rank suffered. In recent weeks the Latin American Internet - eCommerce firm enjoyed a streak of volume-driven gains to new 52-week and all-time highs. Its strong quarterly earnings and annual earnings history satisfy the C and A criteria. Top-rated funds owning an interest rose from 328 in Dec '10 to 352 in Mar '11, which is an encouraging sign concerning the I criteria.
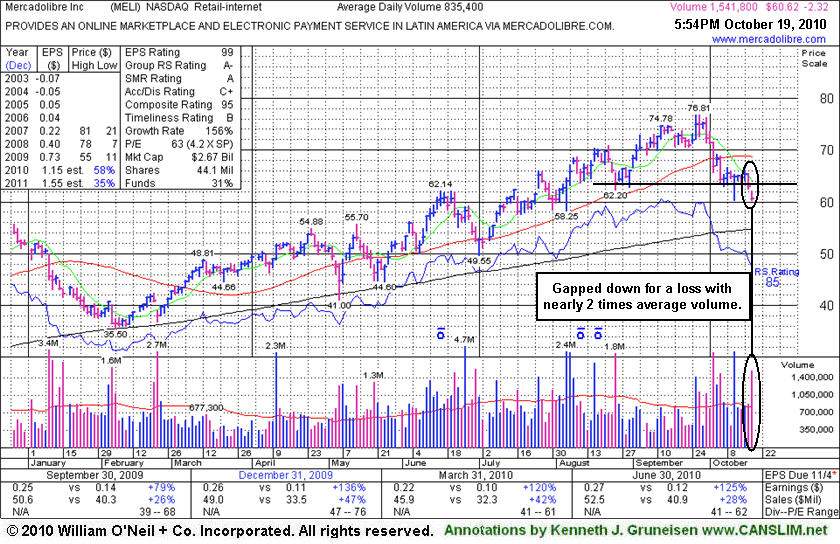
Deterioration Continues Following +41% Rally In Under 5 Months - Tuesday, October 19, 2010
Mercadolibre Inc (MELI -$2.29 or -3.64% to $60.65) gapped down today for another damaging loss with above average volume, closing more than -21% off its 52-week high after finishing below its low close of 8/25/10 on the prior session. It may test support at its long-term 200-day moving average (DMA) line, the long-term average which acted as a firm support level in the early part of the year. Meanwhile, a rebound above its 50 DMA line is needed for its outlook to improve. Based on weakness and technical deterioration it will be dropped from the Featured Stocks list tonight.
It endured damaging distributional pressure in recent weeks as a violation of its 50 DMA line triggered an earlier technical sell signal. The Latin American Internet - eCommerce firm was first featured in yellow in the 5/13/10 mid-day report (read here) and then noted as it traded within 5 cents of its 52-week high. It proceeded to rally as much as +41.7%, rising from $54.21 to as high as $76.81 in the span of less than 5 months. Its strong quarterly earnings and annual earnings history satisfy the C and A criteria. Top-rated funds owning an interest slumped from 94 in Jun '10 to 87 in Sep '10, which is a slightly discouraging sign concerning the I criteria.
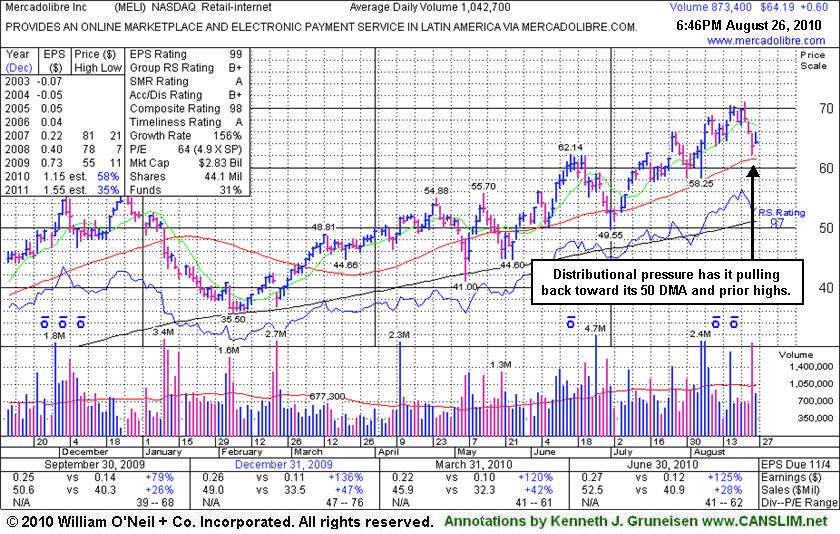
Sinking Near Support Amid Distributional Pressure - Thursday, August 26, 2010
Mercadolibre Inc (+$0.72 or +1.13% and $64.31) has endured distributional pressure, sinking near prior highs in the $62 area and its 50 DMA line defining chart support. The pullback may be offering investors a secondary buy point, however weakened market conditions (M criteria) are a concern now arguing against new buying effort until a new follow-through day occurs.
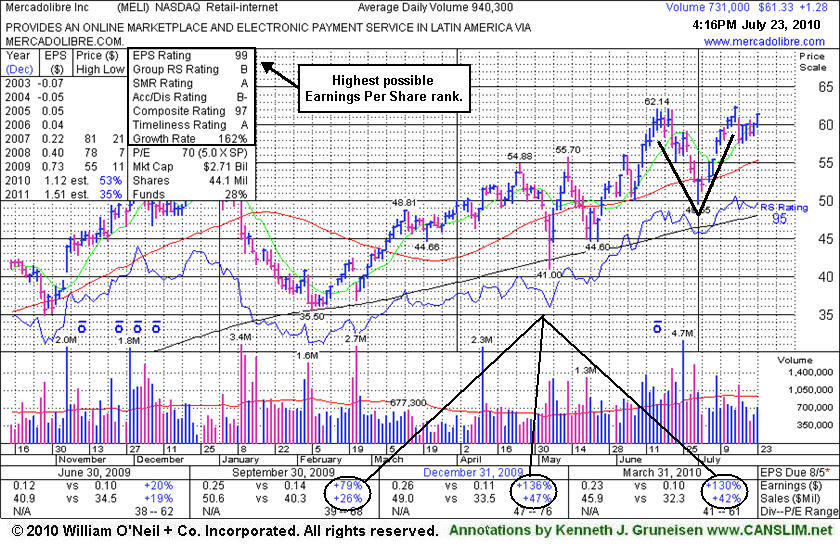
V-Shaped Pattern Not An Ideal Base - Friday, July 23, 2010
Mercadolibre Inc. (MELI +$1.42 or +2.36% to $61.47) finished at its second highest close of the year. Gains with light volume have followed a considerable 7/16/10 loss with above average volume. Recently it was noted as it wedged to new 52-week high territory with quiet volume behind its gains. Its current chart pattern has a sloppy "V" shape and is not a sound base of sufficient length, so patience is needed to see if a proper base will form. Meanwhile, the number of top-rated funds owning an interest fell from 95 in Mar '10 to 89 in Jun '10, a somewhat discouraging sign concerning the I criteria.
It found prompt support near its 50-day moving average (DMA) line, an encouraging sign after it encountered distributional pressure in late June. Worrisome action had erased all of its gains since it was shown in this FSU section on 6/10/10 under the headline Strong Finish On High Volume Triggers Technical Buy an annotated graph illustrated the bullish action as it "surged in the final hour of today's session and hit a new 52-week high with a considerable gain above its pivot point on volume backed by +79% above average, triggering a technical buy signal."
The Latin American Internet - eCommerce firm was featured in yellow in the 5/13/10 mid-day report (read here). It found great support at its long-term 200-day moving average (DMA) line on pullbacks this year, an encouraging sign. Its strong quarterly earnings and annual earnings history satisfy the C and A criteria.
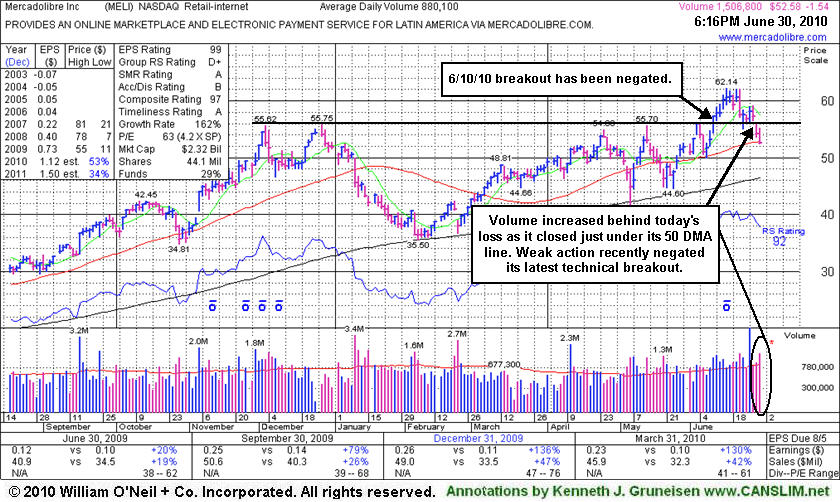
Recent Breakout Negated By Weak Action - Wednesday, June 30, 2010
Mercadolibre Inc. (MELI -$1.57 or -2.90% to $52.55) fell today with above average volume, marking its 3rd straight loss. It finished near but just below its 50-day moving average (DMA) line. Its slump under prior chart highs in the $55 area this week has raised concerns as it completely negated its 6/10/10 breakout. When it was last shown in this FSU section on 6/10/10 under the headline Strong Finish On High Volume Triggers Technical Buy an annotated graph illustrated the bullish action as it "surged in the final hour of today's session and hit a new 52-week high with a considerable gain above its pivot point on volume backed by +79% above average, triggering a technical buy signal."
The Latin American Internet - eCommerce firm was featured in yellow in the 5/13/10 mid-day report (read here). It found great support at its long-term 200-day moving average (DMA) line on pullbacks this year, an encouraging sign. Support near its shorter-term moving average would be a nice reassurance now, rather than more worrisome losses. Prompt gains back above the $55 level could help its outlook. Top-rated funds owning an interest rose from 62 in Dec '08 to 94 in Mar '10, which is encouraging concerning the I criteria. Its strong quarterly earnings and annual earnings history satisfy the C and A criteria.
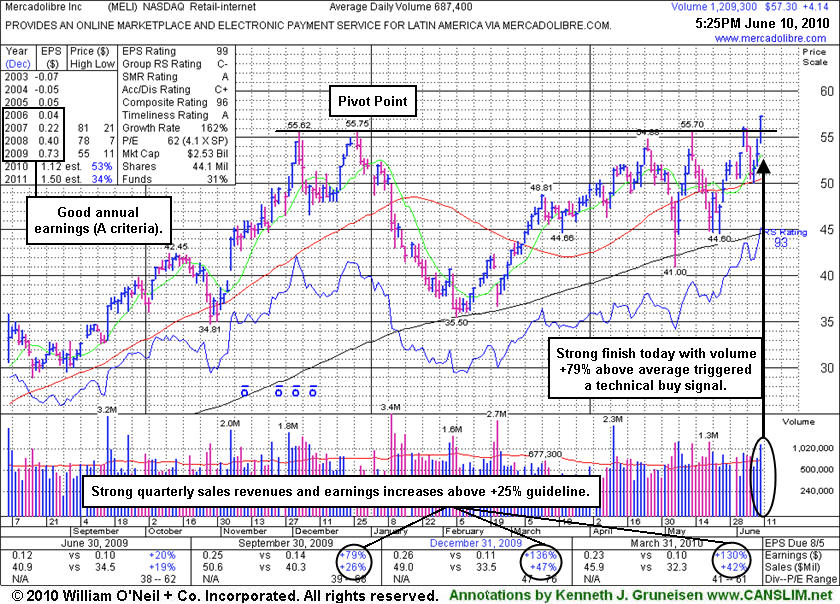
Strong Finish On High Volume Triggers Technical Buy Signal - Thursday, June 10, 2010
Mercadolibre Inc. (MELI +$4.14 or +7.79% to $57.30) surged in the final hour of today's session and hit a new 52-week high with a considerable gain above its pivot point on volume backed by +79% above average, triggering a technical buy signal. When it was last shown in this FSU section on 5/28/10 under the headline "Gains Above 50 DMA Line Follow Recent Distribution" an annotated graph showed it rebounding above its short-term average after enduring a wave of distributional pressure. In that article said - "It is an ideal candidate for one's watch list while awaiting the new rally effort's confirmation in the form of a sound follow-through day of gains from at least one of the major averages on higher volume." The considerable gains for the major averages today were an encouraging sign, but lower volume totals on the major exchanges suggested that conviction from the institutional crowd at present may not be sufficient to fuel a sustainable advance.
The Latin American Internet - eCommerce firm was featured in yellow in the 5/13/10 mid-day report (read here) and noted as it traded within 5 cents of its 52-week high. It has found great support at its long-term 200-day moving average (DMA) line, including earlier in the year. The high-ranked leader's pivot point is based upon its 12/28/09 high plus ten cents. Top-rated funds owning an interest rose from 62 in Dec '08 to 98 in Mar '10, which is encouraging concerning the I criteria. Its strong quarterly earnings and annual earnings history satisfy the C and A criteria.
Gains Above 50 DMA Line Follow Recent Distributional Action - Friday, May 28, 2010
Mercadolibre Inc. (MELI +$0.41 or +0.80% to $51.87) posted a 4th consecutive gain, rallying further above its 50-day moving average (DMA) line and finishing the week only -7% off its 52-week high. Its 200 DMA and recent lows define important near-term chart support. Market conditions (M criteria) remain doubtful until a follow-through day from at least one of the major averages confirms that sufficient institutional buying conviction has returned.When it was last shown in this FSU section on 5/13/10 under the headline "Put Latin-American Internet - eCommerce Firm On Watch List an annotated graph showed its negative reversal for a loss on higher volume, an indication it was encountering distributional pressure while challenging previously stubborn resistance. The Latin American Internet - eCommerce firm was featured in yellow in the 5/13/10 mid-day report (read here) and noted as it traded within 5 cents of its 52-week high. It has found great support at its long-term 200-day moving average (DMA) line, including earlier in the year. The high-ranked leader's pivot point is based upon its 12/28/09 high plus ten cents. Top-rated funds owning an interest rose from 62 in Dec '08 to 101 in Mar '10, which is encouraging concerning the I criteria. Its strong quarterly earnings and annual earnings history satisfy the C and A criteria. Disciplined investors will watch for a proper technical buy signal. It is an ideal candidate for one's watch list while awaiting the new rally effort's confirmation in the form of a sound follow-through day of gains from at least one of the major averages on higher volume.

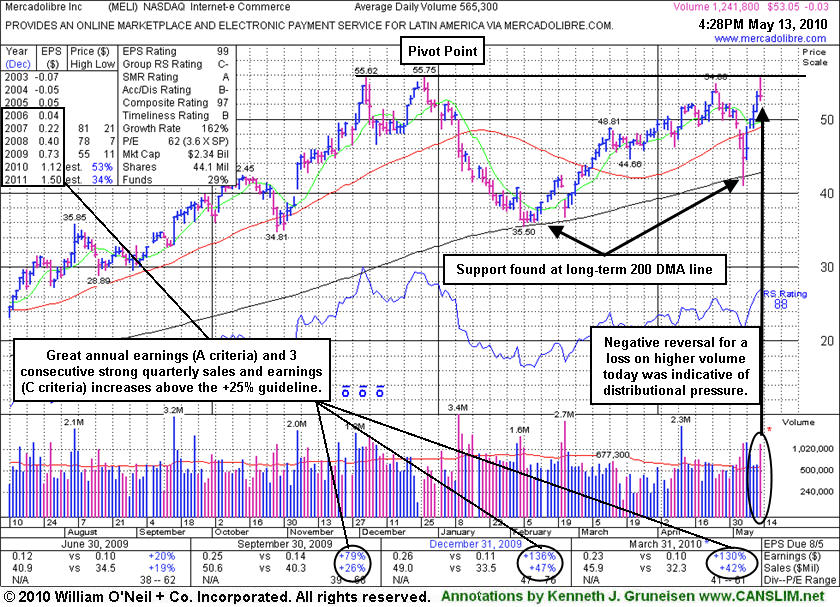
Put Latin-American Internet - eCommerce Firm On Watch List - Thursday, May 13, 2010
Mercadolibre Inc. (MELI -$0.03 or -0.06% to $53.05) negatively reversed for a loss on higher volume today, an indication it was encountering more distributional pressure while challenging previously stubborn resistance. The Latin American Internet - eCommerce firm was featured in yellow in today's mid-day report (read here) and noted as it traded within 5 cents of its 52-week high. It rallied back impressively from last week's test of support at its long-term 200-day moving average (DMA) line. That long-time average acted as a firm support level in the early part of the year. The high-ranked leader's pivot point is based upon its 12/28/09 high plus ten cents. Top-rated funds owning an interest rose from 62 in Dec '08 to 102 in Mar '10, which is encouraging concerning the I criteria. Its strong quarterly earnings and annual earnings history satisfy the C and A criteria. Disciplined investors will watch for a proper technical buy signal. It is an ideal candidate for one's watch list while awaiting the new rally effort's confirmation in the form of a sound follow-through day of gains from at least one of the major averages on higher volume.