Slumping Near 200 DMA Line and Still Only -12.3% Off High - Tuesday, September 19, 2023
Lattice Semiconductor (LSCC -$0.68 or -0.78% to $86.16) slumped further below its 50 DMA line ($91) toward its 200 DMA line and prior lows in the $84 area which define important near-term support to watch. It is still only -12.3% off its 52-week high. Its 50 DMA line may act as resistance, but subsequent gains above the 50 DMA line are needed for its outlook to improve.
Recently it reported Jun '23 quarterly earnings +24% on +18% sales revenues versus the year-ago period, just below the +25% minimum earnings guideline (C criteria). It still has a 99 Earnings Per Share Rating. Its annual earnings history (A criteria) has been very strong and steady. LSCC was highlighted in yellow with pivot point cited based on its 3/23/23 high plus 10 cents in the 6/13/23 mid-day report (read here). It was last shown in this FSU section on 8/17/23 with an annotated graph under the headline, "Rebound Needed Above 50-Day Moving Average for Lattice".
LSCC hails from the Elec-Semicondctor Fablss group which is currently ranked 88th on the 197 Industry Groups list (L criteria). The company has 137.8 million shares outstanding (S criteria). The number of top-rated funds owning its share rose from 765 in Jun '22 to 1,225 in Jun '23, a reassuring sign concerning the I criteria. It has a Timeliness Rating of B and an Accumulation/Distribution Rating of D+. Its current Up/Down Volume Ratio of 0.8 is an unbiased sign of distributional pressure over the past 50 days.
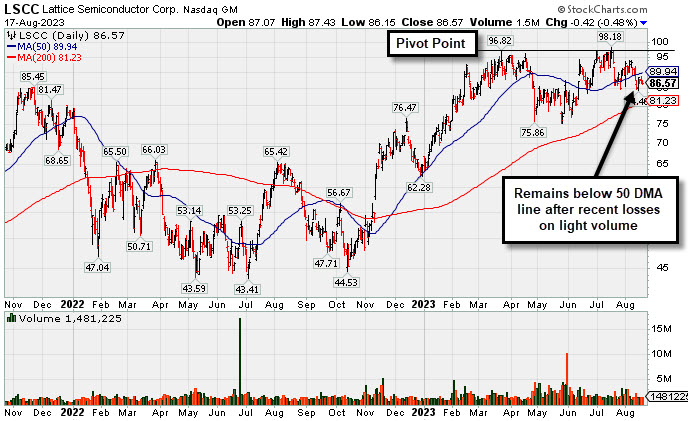
Rebound Needed Above 50-Day Moving Average for Lattice - Thursday, August 17, 2023
Lattice Semiconductor (LSCC -$0.42 or -0.48% to $86.57) is sputtering below its 50-day moving average (DMA) line ($89.94) which may act as resistance. Subsequent gains above the 50 DMA line are needed for its outlook to improve. Recently it reported Jun '23 quarterly earnings +24% on +18% sales revenues versus the year-ago period, just below the +25% minimum earnings guideline (C criteria). It still has a 99 Earnings Per Share Rating. Its annual earnings history (A criteria) has been very strong and steady.
LSCC was highlighted in yellow with pivot point cited based on its 3/23/23 high plus 10 cents in the 6/13/23 mid-day report (read here). It hails from the Elec-Semicondctor Fablss group which is currently ranked 17th on the 197 Industry Groups list (L criteria).
The company has 137.8 million shares outstanding (S criteria). The number of top-rated funds owning its share rose from 765 in Jun '22 to 1,171 in Jun '23, a reassuring sign concerning the I criteria. It has a Timeliness Rating of A but an Accumulation/Distribution Rating of C-. Its current Up/Down Volume Ratio of 1.1 is an unbiased sign of slight accumulation over the past 50 days.
Chart courtesy of www.stockcharts.com
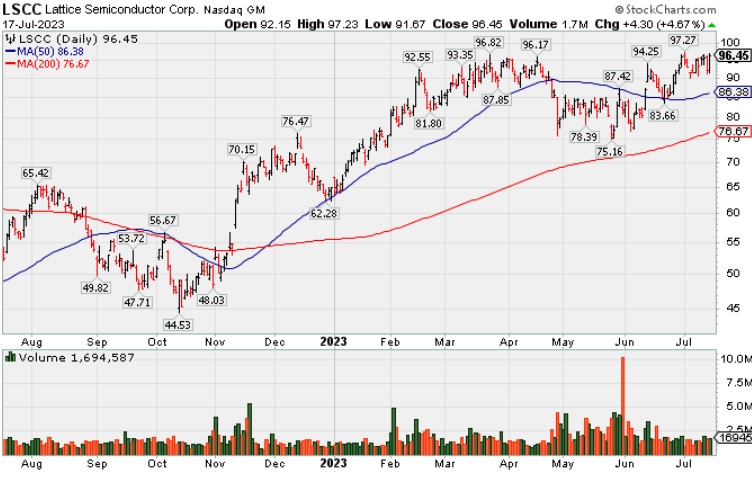
Perched Near Pivot Point After Best-Ever Close - Monday, July 17, 2023
Lattice Semiconductor (LSCC +$4.30 or +4.67% to $96.45) posted a gain today with below average volume for a best-ever close. It is perched within close striking distance of its 52-week high Subsequent gains above the pivot point backed by at least +40% above average volume may trigger a technical buy signal. Its 50-day moving average (DMA) line ($86.38) defines near-term support to watch on pullbacks
LSCC was highlighted in yellow with pivot point cited based on its 3/23/23 high plus 10 cents in the 6/13/23 mid-day report (read here). Fundamentals remain strong. The high-ranked Elec-Semicondctor Fablss firm reported Mar '23 quarterly earnings +38% on +22% sales revenues versus the year-ago period, its 9th consecutive strong quarterly comparison above the +25% minimum earnings guideline (C criteria). Its annual earnings history (A criteria) has been strong. It has a 99 Earnings Per Share Rating, the highest possible rank.
The company has 137.6 million shares outstanding (S criteria). The number of top-rated funds owning its share rose from 765 in Jun '22 to 1,043 in Jun '23, a reassuring sign concerning the I criteria. It has a Timeliness Rating of A but an Accumulation/Distribution Rating of C+. Its current Up/Down Volume Ratio of 0.9 is a sign of slight distribution over the past 50 days.
Chart courtesy of www.stockcharts.com
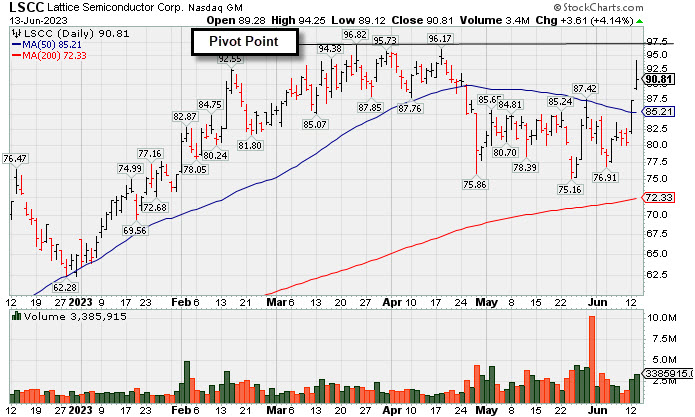
Lattice Posts Volume-Driven Gains Approaching Prior High - Tuesday, June 13, 2023
Lattice Semiconductor (LSCC +$3.61 or +4.14% to $90.81) was highlighted in yellow with pivot point cited based on its 3/23/23 high plus 10 cents in the earlier mid-day report (read here). It gapped up today approaching prior highs after rebounding above its 50-day moving aveage (DMA) line ($85.23) on the prior session with a volume-driven gain. Subsequent gains above the pivot point backed by at least +40% above average volume may trigger a technical buy signal.
The high-ranked Elec-Semicondctor Fablss firm reported Mar '23 quarterly earnings +38% on +22% sales revenues versus the year-ago period, its 9th consecutive strong quarterly comparison above the +25% minimum earnings guideline (C criteria). Its annual earnings history (A criteria) has been strong. It has a 99 Earnings Per Share Rating, the highest possible rank.
The company has 137.6 million shares outstanding (S criteria). The number of top-rated funds owning its share rose from 765 in Jun '22 to 964 in Mar '23, a reassuring sign concerning the I criteria. It has a Timeliness Rating of A but an Accumulation/Distribution Rating of D. Its current Up/Down Volume Ratio of 1.0 is neutral concerning acccumulation/distribution over the past 50 days.
The company has 137.6 million shares outstanding (S criteria). The number of top-rated funds owning its share rose from 765 in Jun '22 to 964 in Mar '23, a reassuring sign concerning the I criteria. It has a Timeliness Rating of A but an Accumulation/Distribution Rating of D. Its current Up/Down Volume Ratio of 1.0 is neutral concerning acccumulation/distribution over the past 50 days.
Chart courtesy of www.stockcharts.com
| Symbol/Exchange Company Name Industry Group | PRICE | CHANGE | Day High | Volume (% DAV) (% 50 day avg vol) | 52 Wk Hi | Featured Date | Price Featured | Pivot Featured |
| Max Buy | ||||||||
Graphic Packaging Paper and Paper Products | $26.22 | -0.74 -2.74% | $27.56 | 8,617,668 50 DAV is 2,851,000 | $27.02 -2.96% | 10/25/2022 | $22.75 | PP = $24.17 |
| MB = $25.38 | ||||||||
G - There was a "negative reversal" today for a loss with heavy volume after hitting new all-time highs with 8 consecutive gains. It did not form a sound new base of sufficient length but quickly recovered after testing its 4/27/23 low last week. Reported Mar '23 quarterly earnings +60% on +9% sales revenues versus the year-ago period. >>> FEATURED STOCK ARTICLE : Graphic Packaging Hits New High With 6th Consecutive Gain - 6/8/2023 | View all notes | Set NEW NOTE alert | Company Profile | SEC News | Chart | Request a new note | ||||||||
Sterling Infrastructure Bldg-Heavy Construction | $53.15 | +0.40 0.76% | $54.44 | 273,332 50 DAV is 262,000 | $53.97 -1.52% | 12/14/2022 | $32.41 | PP = $33.72 |
| MB = $35.41 | ||||||||
G - Hit yet another new all-time high today but ended near the session low. It is very extended from any sound base. Mar ''23 quarterly earnings were below the +25% minimum guideline (C criteria) raising fundamental concerns. >>> FEATURED STOCK ARTICLE : Impressive Streak of Gains for New Highs - 6/7/2023 | View all notes | Set NEW NOTE alert | Company Profile | SEC News | Chart | Request a new note | ||||||||
Comfort Systems USA Bldg-A/C and Heating Prds | $158.34 | -1.95 -1.22% | $162.16 | 264,074 50 DAV is 275,000 | $162.75 -2.71% | 4/27/2023 | $148.85 | PP = $152.23 |
| MB = $159.84 | ||||||||
| Most Recent Note - 6/12/2023 6:08:15 PM G - Color code is changed to green after hitting a new all-time high and closing above its "max buy" level with today''s big gain backed by +19% above average volume. No resistance remains due to overhead supply. >>> FEATURED STOCK ARTICLE : Churning Action While Recently Hovering Near All-Time High - 5/12/2023 | View all notes | Set NEW NOTE alert | Company Profile | SEC News | Chart | Request a new note | ||||||||
Coca-Cola Femsa ADR Beverages-Non-Alcoholic | $88.26 | -0.12 -0.14% | $89.27 | 157,915 50 DAV is 192,000 | $91.23 -3.26% | 6/9/2023 | $88.61 | PP = $91.33 |
| MB = $95.90 | ||||||||
| Most Recent Note - 6/9/2023 5:52:26 PM Y - Posted a 7th consecutive gain today after finding support near its 50 DMA line ($85.16). Color code is changed to yellow with new pivot point based on its 5/09/23 high plus 10 cents. Recent lows in the $81.50 area define the next important support to watch below its 50 DMA line. Reported Mar ''23 quarterly earnings +53% on +24% sales revenues versus the year-ago period. See the latest FSU analysis for more details and a new annotated graph. >>> FEATURED STOCK ARTICLE : Coca-Cola Femsa Posts 7th Consecutive Gain - 6/9/2023 | View all notes | Set NEW NOTE alert | Company Profile | SEC News | Chart | Request a new note | ||||||||
Clean Harbors Pollution Control | $155.36 | -2.26 -1.43% | $158.32 | 340,987 50 DAV is 380,000 | $158.72 -2.12% | 3/10/2023 | $136.89 | PP = $136.74 |
| MB = $143.58 | ||||||||
| Most Recent Note - 6/9/2023 12:25:35 PM G - Perched at its all-time high following 3 consecutive gains. Its 50 DMA line ($142.71) defines near-term support to watch on pullbacks. Reported Mar '23 quarterly earnings +64% on +12% sales revenues versus the year-ago period. Fundamentals remain strong. >>> FEATURED STOCK ARTICLE : Showed Resilience Near 50-Day Moving Average Following Sell-Off - 5/10/2023 | View all notes | Set NEW NOTE alert | Company Profile | SEC News | Chart | Request a new note | ||||||||
| Symbol/Exchange Company Name Industry Group | PRICE | CHANGE | Day High | Volume (% DAV) (% 50 day avg vol) | 52 Wk Hi | Featured Date | Price Featured | Pivot Featured |
| Max Buy | ||||||||
SPS Commerce Comp Sftwr-Spec Enterprs | $177.93 | +0.79 0.45% | $178.44 | 167,222 50 DAV is 149,000 | $177.34 0.33% | 4/24/2023 | $150.01 | PP = $157.56 |
| MB = $165.44 | ||||||||
| Most Recent Note - 6/12/2023 6:13:44 PM G - Hit yet another new 52-week high with today''s 3rd consecutive gain backed by +54% above average volume. Reported Mar ''23 quarterly earnings +22% on +20% versus the year-ago period, below the +25% minimum earnings guideline (C criteria) raising some fundamental concerns. >>> FEATURED STOCK ARTICLE : Pulled Back After Quietly Wedging to New Highs - 5/31/2023 | View all notes | Set NEW NOTE alert | Company Profile | SEC News | Chart | Request a new note | ||||||||
Hubbell Electrical-Power/Equipmt | $315.54 | +4.84 1.56% | $316.36 | 254,472 50 DAV is 405,000 | $311.69 1.24% | 4/25/2023 | $262.85 | PP = $257.51 |
| MB = $270.39 | ||||||||
G - Hit yet another new all-time high with today''s 6th consecutive gain, getting more extended from the prior base. Prior highs in the $263 area define initial support to watch on pullbacks. Fundamentals remain strong. >>> FEATURED STOCK ARTICLE : Extended From Prior Base and Perched Near High - 6/1/2023 | View all notes | Set NEW NOTE alert | Company Profile | SEC News | Chart | Request a new note | ||||||||
NVR Bldg-Resident/Comml | $5,929.63 | +60.77 1.04% | $5,960.35 | 20,725 50 DAV is 24,000 | $5,986.96 -0.96% | 4/25/2023 | $5,882.18 | PP = $5,978.25 |
| MB = $6,277.16 | ||||||||
G - Posted a 4th consecutive gain today with below-average volume. Its 50 DMA line ($5,747) defines near-term support above the recent low ($5,520 on 6/01/23). Reported Mar ''23 quarterly earnings -14% on -3% sales revenues versus the year-ago period, below the +25% minimum earnings guideline (C criteria) raising fundamental concerns, and its color code was changed to green. Prior quarterly comparisons were well above the +25% minimum earnings guideline (C criteria). Annual earnings (A criteria) growth has been very strong. >>> FEATURED STOCK ARTICLE : Rebounded Above 50 Day Average With Light Volume Gains - 6/6/2023 | View all notes | Set NEW NOTE alert | Company Profile | SEC News | Chart | Request a new note | ||||||||
PulteGroup Bldg-Resident/Comml | $73.89 | +0.99 1.36% | $74.20 | 3,231,331 50 DAV is 2,936,000 | $73.44 0.61% | 4/25/2023 | $65.17 | PP = $64.01 |
| MB = $67.21 | ||||||||
| Most Recent Note - 6/12/2023 6:12:42 PM G - Hit yet another new high with today''s 2nd consecutive gain backed by below average volume, getting more extended from any sound base. Reported earnings +28% for the Mar ''23 quarter versus the year-ago period. Important support to watch is defined by its 50 DMA line ($65) and recent low. >>> FEATURED STOCK ARTICLE : Rebounded Above "Max Buy" Level Toward Recent High - 6/2/2023 | View all notes | Set NEW NOTE alert | Company Profile | SEC News | Chart | Request a new note | ||||||||
Coca-Cola Consolidated Beverages-Non-Alcoholic | $653.65 | -0.79 -0.12% | $659.95 | 37,280 50 DAV is 36,000 | $694.20 -5.84% | 5/4/2023 | $646.66 | PP = $656.21 |
| MB = $689.02 | ||||||||
| Most Recent Note - 6/8/2023 12:48:26 PM Y - Pulled back below its "max buy" level with recent volume-driven losses. Recent lows in the $625 area define important near-term support above its 50 DMA line. Fundamentals remain strong. >>> FEATURED STOCK ARTICLE : COKE is Showing Real Strength - 5/4/2023 | View all notes | Set NEW NOTE alert | Company Profile | SEC News | Chart | Request a new note | ||||||||
| Symbol/Exchange Company Name Industry Group | PRICE | CHANGE | Day High | Volume (% DAV) (% 50 day avg vol) | 52 Wk Hi | Featured Date | Price Featured | Pivot Featured |
| Max Buy | ||||||||
Amphastar Pharm Medical-Biomed/Biotech | $47.10 | -0.13 -0.28% | $48.39 | 401,128 50 DAV is 411,000 | $47.46 -0.76% | 5/15/2023 | $43.56 | PP = $44.15 |
| MB = $46.36 | ||||||||
| Most Recent Note - 6/12/2023 6:10:42 PM G - Hit a new all-time high and closed above its "max buy" level today and its color code is changed to green. Prior highs in the $44 area define initial support to watch on pullbacks. Fundamentals remain strong. >>> FEATURED STOCK ARTICLE : Weak Finish After Early Gain When Perched Near All-Time High - 5/15/2023 | View all notes | Set NEW NOTE alert | Company Profile | SEC News | Chart | Request a new note | ||||||||
Arista Networks Computer-Networking | $168.60 | -1.40 -0.82% | $172.64 | 3,211,638 50 DAV is 3,240,000 | $178.36 -5.47% | 5/30/2023 | $176.35 | PP = $171.54 |
| MB = $180.12 | ||||||||
| Most Recent Note - 6/12/2023 6:05:36 PM Y - Posted a 3rd consecutive gain today with average volume. Stalled after recent gains triggered a technical buy signal. Its 50 DMA line ($154) defines important near-term support to watch. Fundamentals remain strong. See the latest FSU analysis for more details and a new annotated graph. >>> FEATURED STOCK ARTICLE : Rebounding Near Recent High With 3 Consecutive Gains - 6/12/2023 | View all notes | Set NEW NOTE alert | Company Profile | SEC News | Chart | Request a new note | ||||||||
Palo Alto Networks Computer Sftwr-Security | $233.63 | +4.49 1.96% | $234.50 | 5,938,156 50 DAV is 4,429,000 | $230.18 1.50% | 6/5/2023 | $228.35 | PP = $213.73 |
| MB = $224.42 | ||||||||
| Most Recent Note - 6/12/2023 6:14:34 PM Y - Posted a solid gain today backed by +24% above average volume for a best-ever close. The prior high ($213) defines initial support to watch. Fundamentals remain strong. >>> FEATURED STOCK ARTICLE : Palo Alto Powers to New Highs Again - 6/5/2023 | View all notes | Set NEW NOTE alert | Company Profile | SEC News | Chart | Request a new note | ||||||||
Lattice Semiconductor Elec-Semicondctor Fablss | $90.81 | +3.61 4.14% | $94.25 | 3,385,915 50 DAV is 2,367,000 | $96.82 -6.21% | 6/13/2023 | $91.73 | PP = $96.92 |
| MB = $101.77 | ||||||||
Y - Color code is changed to yellow with pivot point cited based on its 3/23/23 high plus 10 cents. Gapped up today approaching prior highs after rebounding above its 50 DMA line ($85.23) on the prior session with a volume-driven gain. Subsequent gains above the pivot point backed by at least +40% above average volume may trigger a technical buy signal. Reported Mar '23 quarterly earnings +38% on +22% sales revenues versus the year-ago period, its 9th consecutive strong quarterly comparison above the +25% minimum earnings guideline (C criteria). Annual earnings history (A criteria) has been strong. >>> FEATURED STOCK ARTICLE : Lattice Posts Volume-Driven Gains Approaching Prior High - 6/13/2023 | View all notes | Set NEW NOTE alert | Company Profile | SEC News | Chart | Request a new note | ||||||||