Rebound Toward 50-Day Average Which May Act as Resistance - Tuesday, November 10, 2020
Hovering Near High But Recent Gains Lacked Great Volume - Monday, October 19, 2020
New Base Formed by Strong Homebuilder - Thursday, October 1, 2020
Violation of 50-Day Average on Volume Triggered Technical Sell Signal - Friday, September 18, 2020
Homebuilder Halted Slide Near Prior Low and 50-Day Average - Tuesday, September 8, 2020
Leadership in Building - Residential/Commercial Group Improving - Thursday, August 20, 2020
Earning News Due Next Week for Homebuilder - Friday, July 31, 2020
Breakout to New High Backed by 53% Above Average Volume - Tuesday, July 7, 2020
50-Day Moving Average Line Recently Acted as Support - Thursday, September 29, 2016
Finished Strong While Rallying From Cup-With-Handle Base - Monday, August 29, 2016
Volume Heavy Behind Breakout Gain - Tuesday, December 1, 2015
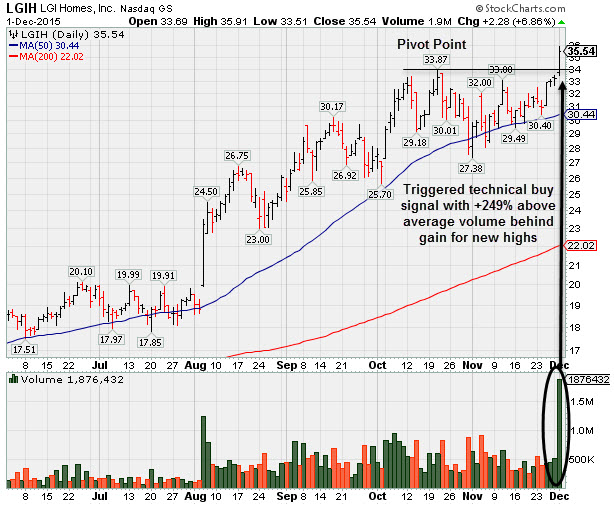
Rebound Toward 50-Day Average Which May Act as Resistance - Tuesday, November 10, 2020
L G I Homes Inc's (LGIH +$8.65 or +8.29% to $112.95) rebounded toward its 50-day moving average ($116.44) which may now act as resistance. It briefly undercut the prior low as the prior session's big volume-driven loss violated its 50 DMA line and triggered a technical sell signal. Subsequent gains above the 50 DMA line are needed for its outlook to improve. Members were repeatedly cautioned with prior notes - "Recent gains above the new pivot point lacked the +40% above average volume needed to clinch a proper new (or add-on) technical buy signal."
Recently it reported Sep '20 quarterly earnings +27% on +11% sales revenues versus the year ago period. It has an Earnings Per Share Rating of 97. The latest quarter was reassuring after the company had reported Jun '20 quarterly earnings +21% on +4% sales revenues versus the year ago period, breaking a streak of 4 comparisons above the +25% minimum guideline (C criteria).
The prior low ($101.30 on 9/21/20) defines the next important near-term support. LGIH traded up as much as +34% since highlighted in yellow with pivot point cited based on its 2/21/20 high plus 10 cents in the 7/07/20 mid-day report (read here). It was last shown in this FSU section on 10/19/20 under the headline, "Hovering Near High But Recent Gains Lacked Great Volume". Its annual earnings (A criteria) history has been strong. The Building - Residential / Commercial Group Relative Strength Rating is now B- (75). In recent weeks there has been greater leadership (L criteria) noted in the industry group. It has a small supply (S criteria) of only 22.1 million shares in the public float (S criteria). The number of top-rated funds owning its shares rose from 372 in Dec '19 to 414 in Sep '20, and its current Up/Down Volume Ratio of 0.9 is an unbiased indication its shares have been encountering slight distributional pressure over the past 50 days. It has a Timeliness Rating of A and a Sponsorship Rating of D. LGIH completed its IPO at $11 on 11/07/13.
Charts courtesy www.stockcharts.com
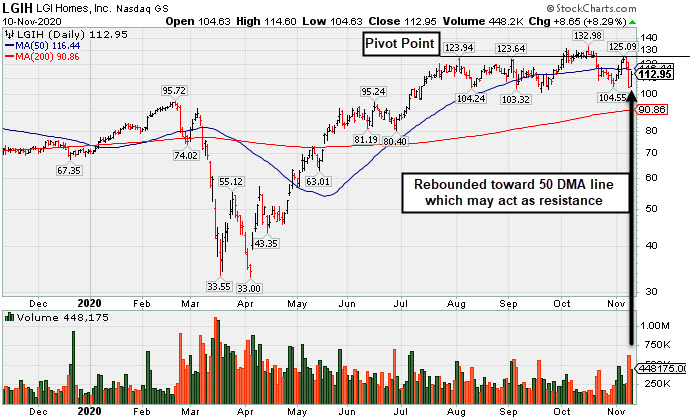
Hovering Near High But Recent Gains Lacked Great Volume - Monday, October 19, 2020
L G I Homes Inc's (LGIH -$1.71 or -1.35% to $125.19) volume totals have been cooling while hovering near its all-time high. Its color code was recently changed to yellow with new pivot point cited based on its 8/04/20 high plus 10 cents. Subsequent gains above the pivot point backed by at least +40% above average volume are still needed to clinch a proper new (or add-on) technical buy signal. The 50-day moving average (DMA) line ($115.87) and latest low ($101.30 on 9/21/20) define near-term support.
It still has the highest possible earnings Per Share Rating of 99. However, not long ago the company reported Jun '20 quarterly earnings +21% on +4% sales revenues versus the year ago period, breaking a streak of 4 comparisons above the +25% minimum guideline (C criteria).
LGIH traded up as much as +34% since highlighted in yellow with pivot point cited based on its 2/21/20 high plus 10 cents in the 7/07/20 mid-day report (read here). It was last shown in this FSU section on 10/01/20 under the headline, "New Base Formed by Strong Homebuilder". Its annual earnings (A criteria) history has been strong. The Building - Residential / Commercial Group Relative Strength Rating is now A+ (97). In recent weeks there has been greater leadership (L criteria) noted in the industry group.
It has a small supply (S criteria) of only 22.1 million shares in the public float (S criteria). The number of top-rated funds owning its shares rose from 372 in Dec '19 to 395 in Jun '20, and its current Up/Down Volume Ratio of 1.0 is an unbiased indication its shares have been neutral concerning accumulation/distribution over the past 50 days. It has a Timeliness Rating of A and a Sponsorship Rating of D. LGIH completed its IPO at $11 on 11/07/13.
Charts courtesy www.stockcharts.com
 XZ
XZ
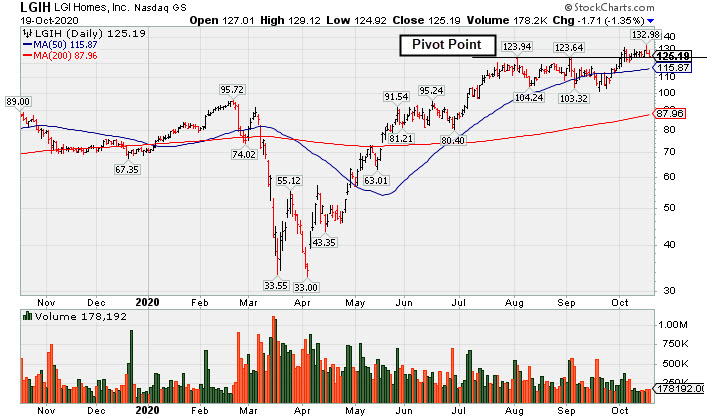
New Base Formed by Strong Homebuilder - Thursday, October 1, 2020
L G I Homes Inc (LGIH +$7.00 or +6.03% to $123.17) rallied for a best ever close today with a big gain on below average volume. The recent rebound above the 50-day moving average (DMA) line ($113.29) helped its outlook to improve. Its color code was changed to yellow with a new pivot point cited based on its 8/04/20 high plus 10 cents. Subsequent gains above the pivot point backed by at least +40% above average volume may trigger a new (or add-on) technical buy signal. Any losses below the latest low ($101.30 on 9/21/20) would raise greater concerns and trigger a worrisome technical sell signal.
It still has the highest possible earnings Per Share Rating of 99. However, not long ago the company reported Jun '20 quarterly earnings +21% on +4% sales revenues versus the year ago period, breaking a streak of 4 comparisons above the +25% minimum guideline (C criteria).
LGIH traded up as much as +21.5% since highlighted in yellow with pivot point cited based on its 2/21/20 high plus 10 cents in the 7/07/20 mid-day report (read here). It was last shown in this FSU section on 9/18/20 under the headline, "Violation of 50-Day Average on Volume Triggered Technical Sell Signal". Its annual earnings (A criteria) history has been strong. The Building - Residential / Commercial Group Relative Strength Rating is now A+ (97). In recent weeks there has been greater leadership (L criteria) noted in the industry group.
It has a small supply (S criteria) of only 22.1 million shares in the public float (S criteria). The number of top-rated funds owning its shares rose from 372 in Dec '19 to 389 in Jun '20, and its current Up/Down Volume Ratio of 0.9 is an unbiased indication its shares have been under slight distributional pressure over the past 50 days. It has a Timeliness Rating of A and a Sponsorship Rating of D. LGIH completed its IPO at $11 on 11/07/13.
Charts courtesy www.stockcharts.com
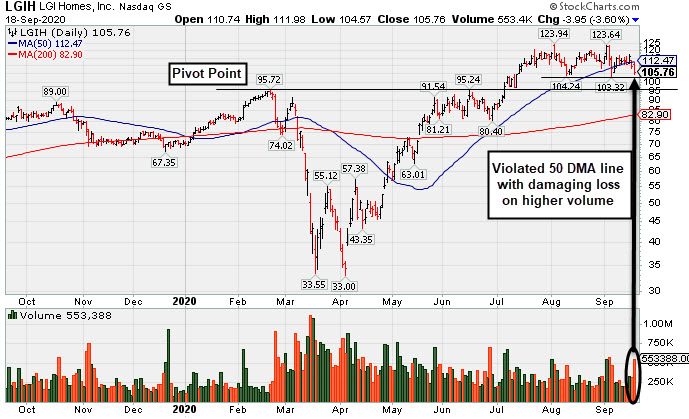
Violation of 50-Day Average on Volume Triggered Technical Sell Signal - Friday, September 18, 2020
L G I Homes Inc (LGIH -$3.95 or -3.60% to $105.76) slumped further below its 50-day moving average (DMA) line ($112.49) with today's damaging volume-driven loss raising greater concerns and triggering a technical sell signal. Prior lows in the $103-104 area define the next important support level to watch. Only a prompt rebound above the 50 DMA line would help its outlook improve.
LGIH traded up as much as +21.5% since highlighted in yellow with pivot point cited based on its 2/21/20 high plus 10 cents in the 7/07/20 mid-day report (read here). It was last shown in this FSU section on 9/08/20 under the headline, "Homebuilder Halted Slide Near Prior Low and 50-Day Average". It reported Jun '20 quarterly earnings +21% on +4% sales revenues versus the year ago period, breaking a streak of 3 consecutive quarterly comparisons above the +25% minimum earnings guideline (C criteria). Its annual earnings (A criteria) history has been strong.
Fundamentals have still been strong enough for it to get a 99 Earnings Per Share Rating, the highest possible rank. The Building - Residential / Commercial Group Relative Strength Rating is now A+ (97). In recent weeks there has been greater leadership (L criteria) noted in the industry group.
It has a small supply (S criteria) of only 22.1 million shares in the public float (S criteria). The number of top-rated funds owning its shares rose from 372 in Dec '19 to 388 in Jun '20, and its current Up/Down Volume Ratio of 1.0 is an unbiased indication its shares have been neutral concerning accumulation/distribution over the past 50 days. It has a Timeliness Rating of A and a Sponsorship Rating of D. LGIH completed its IPO at $11 on 11/07/13.
Charts courtesy www.stockcharts.com
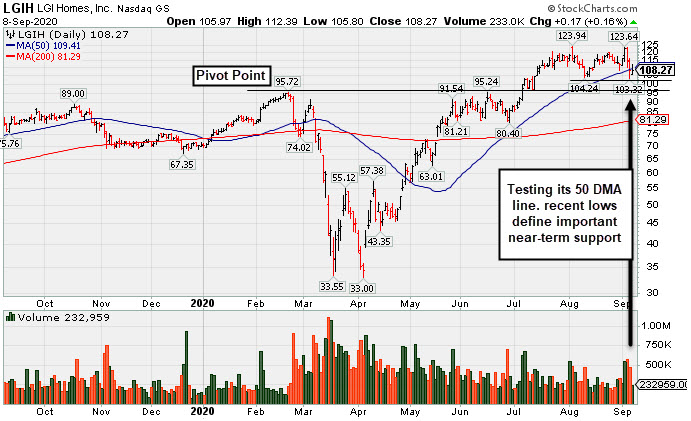
Homebuilder Halted Slide Near Prior Low and 50-Day Average - Tuesday, September 8, 2020
L G I Homes Inc (LGIH +$0.17 or +0.16% to $108.27) retreated from its 52-week high but halted its slide today near its 50-day moving average (DMA) line ($109.41). More damaging losses would raise greater concerns. Reported Jun '20 quarterly earnings +21% on +4% sales revenues, breaking a streak of 4 comparisons above the +25% minimum guideline (C criteria).
LGIH traded up as much as +21.5% since highlighted in yellow with pivot point cited based on its 2/21/20 high plus 10 cents in the 7/07/20 mid-day report (read here). It was last shown in this FSU section on 8/20/20 under the headline, "Leadership in Building - Residential/Commercial Group Improving". It reported Jun '20 quarterly earnings +21% on +4% sales revenues versus the year ago period, breaking a streak of 3 consecutive quarterly comparisons above the +25% minimum earnings guideline (C criteria). Its annual earnings (A criteria) history has been strong.
Fundamentals have still been strong enough for it to get a 99 Earnings Per Share Rating, the highest possible rank. The Building - Residential / Commercial Group Relative Strength Rating is now A (66). In recent weeks there has been greater leadership (L criteria) noted in the industry group.
It has a small supply (S criteria) of only 22.1 million shares in the public float (S criteria). The number of top-rated funds owning its shares rose from 372 in Dec '19 to 387 in Jun '20, and its current Up/Down Volume Ratio of 1.2 is an unbiased indication its shares have been under accumulation over the past 50 days. It has a Timeliness Rating of A and a Sponsorship Rating of D. LGIH completed its IPO at $11 on 11/07/13.
Charts courtesy www.stockcharts.com
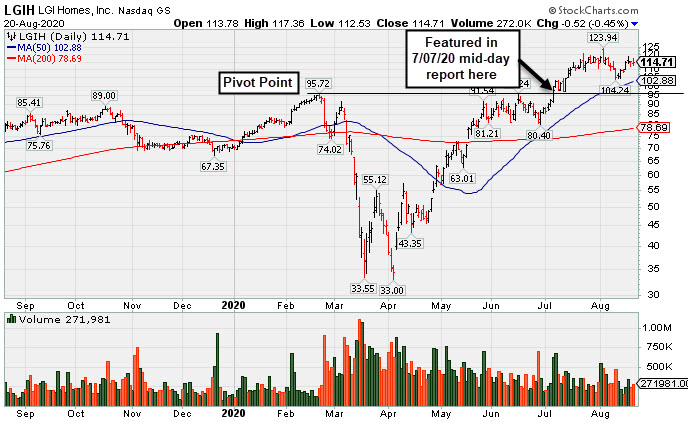
Leadership in Building - Residential/Commercial Group Improving - Thursday, August 20, 2020
L G I Homes Inc (LGIH -$0.52 or -0.45% to $114.71) recently rebounded toward its 52-week high. It is extended from the previously noted base. Its 50-day moving average (DMA) line ($102.88) defines near-term support to watch above prior highs in the $95 area. LGIH traded up as much as +21.5% since highlighted in yellow with pivot point cited based on its 2/21/20 high plus 10 cents in the 7/07/20 mid-day report (read here).
LGIH was last shown in this FSU section on 7/31/20 under the headline, "Earning News Due Next Week for Homebuilder". It reported Jun '20 quarterly earnings +21% on +4% sales revenues versus the year ago period, breaking a streak of 3 consecutive quarterly comparisons above the +25% minimum earnings guideline (C criteria). Its annual earnings (A criteria) history has been strong.
Fundamentals have still been strong enough for it to get a 99 Earnings Per Share Rating, the highest possible rank. The Building - Residential / Commercial Group Relative Strength Rating of B+ (74) has improved in recent weeks revealing greater leadership (L criteria) in the industry group.
It has a small supply (S criteria) of only 22.1 million shares in the public float (S criteria). The number of top-rated funds owning its shares rose from 372 in Dec '19 to 383 in Jun '20, and its current Up/Down Volume Ratio of 1.4 is an unbiased indication its shares have been under accumulation over the past 50 days. It has a Timeliness Rating of A and a Sponsorship Rating of E. LGIH completed its IPO at $11 on 11/07/13.
Charts courtesy www.stockcharts.com
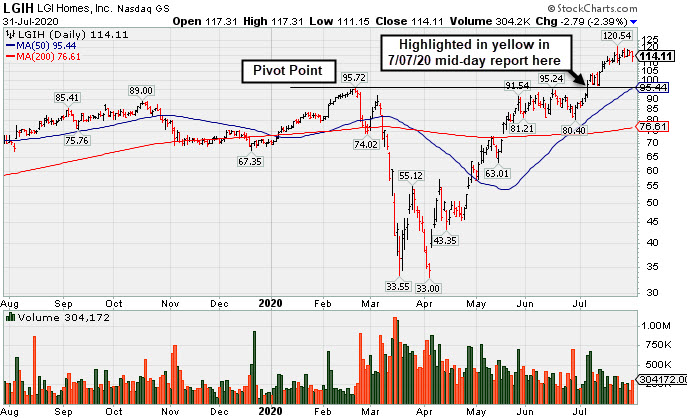
Earning News Due Next Week for Homebuilder - Friday, July 31, 2020
L G I Homes Inc (LGIH -$2.79 or -2.39% to $114.11) pulled back with below average behind today's small loss. It has been stubbornly holding its ground, extended from the previously noted base. Prior highs in the $95 area and its 50-day moving average (DMA) line ($95.44) coincide defining near-term support to watch.
LGIH traded up as much as +21.5% since highlighted in yellow with pivot point cited based on its 2/21/20 high plus 10 cents in the 7/07/20 mid-day report (read here). It hit a new 52-week high with a gain and strong close above the pivot point backed by +53% above average volume, enough to trigger a convincing technical buy signal. The Building - Residential / Commercial firm was last shown in this FSU section on 7/07/20 under the headline, "Breakout to New High Backed by 53% Above Average Volume".
Keep in mind that it is due to report Jun '20 quarterly results before the open on Tuesday. 8/04/20. Volume and volatility often increase near earnings news. It reported earnings +129% on +58% sales revenues for the Mar '20 quarter versus the year ago period, its 3rd consecutive quarterly comparison above the +25% minimum earnings guideline (C criteria). Its annual earnings (A criteria) history has been strong.
Improved earnings growth has been backed by solidly accelerating sales revenues increases which rose +3%, +10%, +27%, +42%, and +58% in the Mar, Jun, Sep, Dec '19 and Mar '20 comparisons, respectively. Fundamentals have been strong enough for it to get a 99 Earnings Per Share Rating, the highest possible rank. However, the current Group Relative Strength Rating of 61 reveals mediocre leadership (L criteria) in the industry group.
It has a small supply (S criteria) of only The number of top-rated funds owning its shares rose from 372 in Dec '19 to 377 in Jun '20, however its current Up/Down Volume Ratio of 1.6 is an unbiased indication its shares have been under accumulation over the past 50 days. It has a Timeliness Rating of A and a Sponsorship Rating of D. LGIH completed its IPO at $11 on 11/07/13.
Charts courtesy www.stockcharts.com
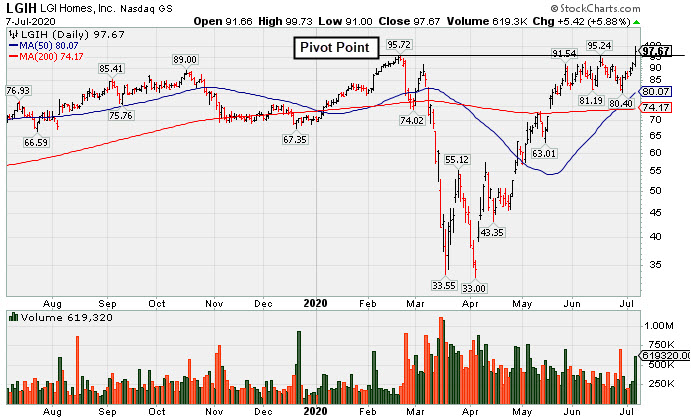
Breakout to New High Backed by 53% Above Average Volume - Tuesday, July 7, 2020
L G I Homes Inc (LGIH +$5.42 or +5.88% to $97.67) finished strong after highlighted in yellow with pivot point cited based on its 2/21/20 high plus 10 cents in the earlier mid-day report (read here). It hit a new 52-week high today. The gain and strong close above the pivot point was backed by +53% above average volume, enough to trigger a convincing technical buy signal.
LGIH went through a deep consolidation below its 200 DMA line and rebounded impressively in recent months. Reported earnings +129% on +58% sales revenues for the Mar '20 quarter versus the year ago period, its 3rd consecutive quarterly comparison above the +25% minimum earnings guideline (C criteria). Its annual earnings (A criteria) history has been strong.
LGIH completed its IPO at $11 on 11/07/13. The Building - Residential / Commercial firm was last shown in this FSU section on 9/29/16 under the headline, "50-Day Moving Average Line Recently Acted as Support".
Improved earnings growth has been backed by solidly accelerating sales revenues increases which rose +3%, +10%, +27%, +42%, and +58% in the Mar, Jun, Sep, Dec '19 and Mar '20 comparisons, respectively. Fundamentals have been strong enough for it to get a 99 Earnings Per Share Rating, the highest possible rank. However, the current Group Relative Strength Rating of 61 reveals mediocre leadership (L criteria) in the industry group.
The number of top-rated funds owning its shares rose from 372 in Dec '19 to 366 in Jun '20, however its current Up/Down Volume Ratio of 2.1 is an unbiased indication its shares have been under accumulation over the past 50 days. It has a Timeliness Rating of A and a Sponsorship Rating of D.
Charts courtesy www.stockcharts.com
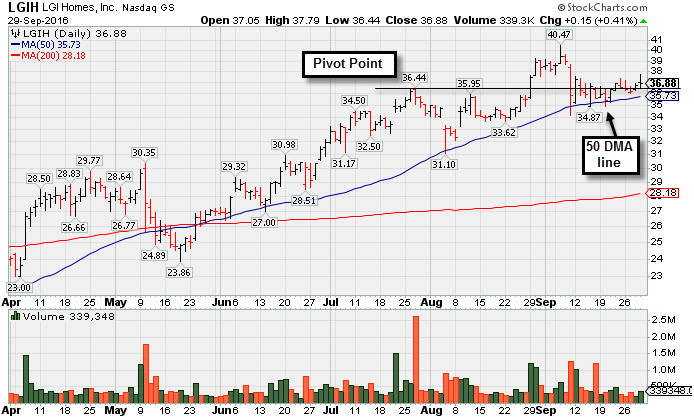
50-Day Moving Average Line Recently Acted as Support - Thursday, September 29, 2016
L G I Homes Inc (LGIH +$0.15 or +0.41% to $36.88) is still quietly consolidating above its 50-day moving average (DMA) line ($35.73) which has acted as support. Violations of the 50 DMA line and recent lows ($34.18 on 9/09/16) would raise greater concerns and trigger worrisome technical sell signals.
The Building - Residential / Commercial firm was last shown in this FSU section on 8/29/16 under the headline, "Finished Strong While Rallying From Cup-With-Handle Base". It finished strong after highlighted in yellow with pivot point cited based on its 7/26/16 high in the earlier mid-day report (read here). It hit a new 52-week high today with +130% above average volume while rising from a 39-week long cup-with-handle base, triggering a technical buy signal.
LGIH has a limited history since its IPO at $11 on 11/07/13. It reported +45% earnings on +40% sales revenues for the second quarter ended June 30, 2016 versus the year ago period, marking the 6th consecutive quarterly comparison above the +25% minimum earnings guideline (C criteria) and backed by solid sales revenues increases. Fundamentals remain strong. However, the current Group Relative Strength Rating of 62 reveals mediocre leadership (L criteria) in the industry group.
The number of top-rated funds owning its shares rose from 126 in Dec '14 to 220 in Jun '16, a reassuring sign considering the I criteria. Its Up/Down Volume Ratio of 1.0 is an unbiased indication its shares have been neutral over the past 50 days. It has a Timeliness Rating of B and a Sponsorship Rating of D.
LGIH was dropped from the Featured Stocks list on 12/09/15 and rebounded later from a very deep consolidation. It deteriorated quickly after last shown in this FSU section on 12/01/15 under the headline, "Volume Heavy Behind Breakout Gain". Stocks that get clobbered like that don't always come back. If and when they do, this example still serves as a reminder that it can take a long time and it can be very painful if losses are not limited whenever any stock falls more than -7% from your purchase price.
Charts courtesy www.stockcharts.com
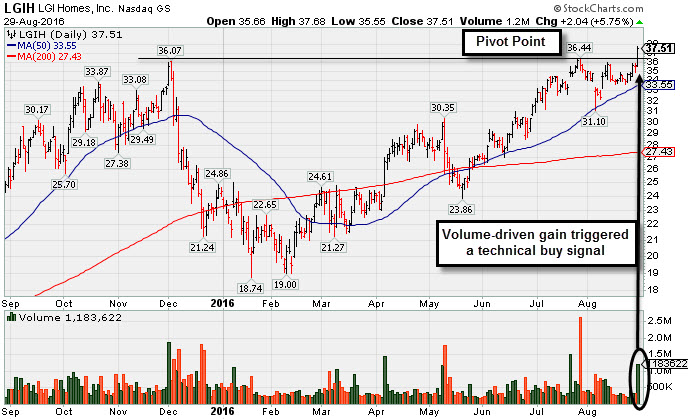
Finished Strong While Rallying From Cup-With-Handle Base - Monday, August 29, 2016
L G I Homes Inc (LGIH +$2.04 or +5.75% to $37.51) finished strong after highlighted in yellow with pivot point cited based on its 7/26/16 high in the earlier mid-day report (read here). It hit a new 52-week high today with +130% above average volume while rising from a 39-week long cup-with-handle base, triggering a technical buy signal. Recently it found support at its 50-day moving average (DMA) line. Fundamentals remain strong. However, the current Group Relative Strength Rating of 55 reveals mediocre leadership (L criteria) in the industry group.
The Building - Residential / Commercial firm has a limited history since its IPO at $11 on 11/07/13. It reported +45% earnings on +40% sales revenues for the second quarter ended June 30, 2016 versus the year ago period, marking the 6th consecutive quarterly comparison above the +25% minimum earnings guideline (C criteria) and backed by solid sales revenues increases.
The number of top-rated funds owning its shares rose from 126 in Dec '14 to 220 in Jun '16, a reassuring sign considering the I criteria. Its Up/Down Volume Ratio of 1.1 is an unbiased indication its shares have been under slight accumulation over the past 50 days. It has a Timeliness Rating of A and a Sponsorship Rating of D.
LGIH was dropped from the Featured Stocks list on 12/09/15 and rebounded later from a very deep consolidation. It deteriorated quickly after last shown in this FSU section on 12/01/15 under the headline, "Volume Heavy Behind Breakout Gain". Stocks that get clobbered like that don't always come back. If and when they do, this example still serves as a reminder that it can take a long time and it can be very painful if losses are not limited whenever any stock falls more than -7% from your purchase price.
Charts courtesy www.stockcharts.com
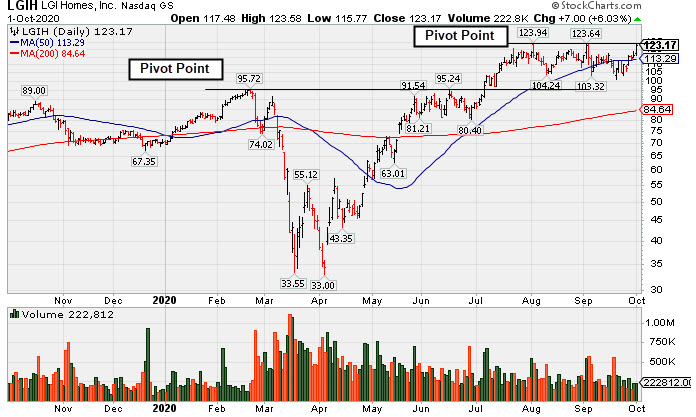
Volume Heavy Behind Breakout Gain - Tuesday, December 1, 2015
L G I Homes Inc (LGIH +$2.28 or +6.86% to $35.54) finished strong after highlighted in yellow with new pivot point based on its 10/21/15 high plus 10 cents in the earlier mid-day report (read here). It powered to a new 52-week high with today's considerable gain backed +249% above average volume as it triggering a technical buy signal. It found support at its 50-day moving average (DMA) line recently as it built an orderly base. Disciplined investors avoid chasing stocks more than +5% above their prior high or pivot point, and in this case the stock quickly spiked beyond its "max buy" level.
The Building - Residential / Commercial firm has a limited history since its IPO at $11 on 11/07/13. It reported Sep '15 earnings +124% on +88% sales revenues, showing solid sales revenues acceleration while also marking the 3rd consecutive quarterly comparison above the +25% minimum earnings guideline (C criteria). Earnings rose +50% and +53% in Mar and Jun '15 quarters, respectively, both backed by solid sales revenues increases.
The number of top-rated funds owning its shares rose from 126 in Dec '14 to 154 in Sep '15, a reassuring sign considering the I criteria. Its Up/Down Volume Ratio of 1.3 is an unbiased indication its shares have been under accumulation over the past 50 days. It has a Timeliness Rating of A and a Sponsorship Rating of C.
Charts courtesy www.stockcharts.com