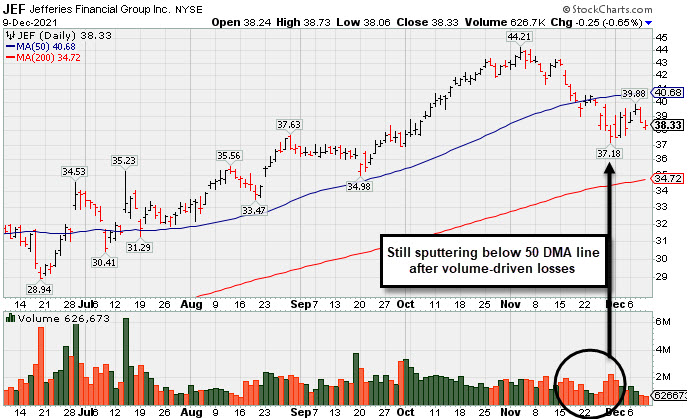
Volume Totals Cooling While Lingering Below 50-Day Moving Average - Thursday, December 9, 2021
Jefferies Financial Grp (JEF -$0.25 or -0.65% to $38.33) is still sputtering with volume totals cooling, meanwhile, a rebound above the 50-day moving average (DMA) line ($40.83) is needed for its outlook to improve.Fundamentals remain strong after it reported Aug '21 quarterly earnings +40% on +20% sales revenues versus the year ago period, its 5th strong quarterly comparison with solid earnings increases and sales revenues growth. Its annual earnings history (the A criteria) has been strong. It has an Earnings Per Share Rating of 97.
JEF traded up as much as +39.8% after highlighted in yellow in the 6/28/21 mid-day report (read here) with pivot point cited based on its 5/10/21 high while building on a 14-week "double bottom" base. However, it stalled and has slumped considerably triggering noted technical sell signals in recent weeks since last shown in this FSU section on 11/01/21 with an annotated graph under the headline, "Extended From Prior Highs and Stubbornly Holding Ground".
JEF hails from the Finance-Invest Bnk/Bkrs industry which is currently ranked 72nd on the 197 Industry Groups list (L criteria). Its Up/Down Volume Ration of 1.5 is an unbiased indication its shares have been under accumulation over the past 50 days, but its current Accumulation/Distribution Rating is D-. The number of top-rated funds that own its shares fell from 724 in Jun '21 to 718 in Sep '21, also a concern regarding the I criteria. It has a Timeliness Rating of B and a Sponsorship Rating of C.
JEF hails from the Finance-Invest Bnk/Bkrs industry which is currently ranked 72nd on the 197 Industry Groups list (L criteria). Its Up/Down Volume Ration of 1.5 is an unbiased indication its shares have been under accumulation over the past 50 days, but its current Accumulation/Distribution Rating is D-. The number of top-rated funds that own its shares fell from 724 in Jun '21 to 718 in Sep '21, also a concern regarding the I criteria. It has a Timeliness Rating of B and a Sponsorship Rating of C.
.
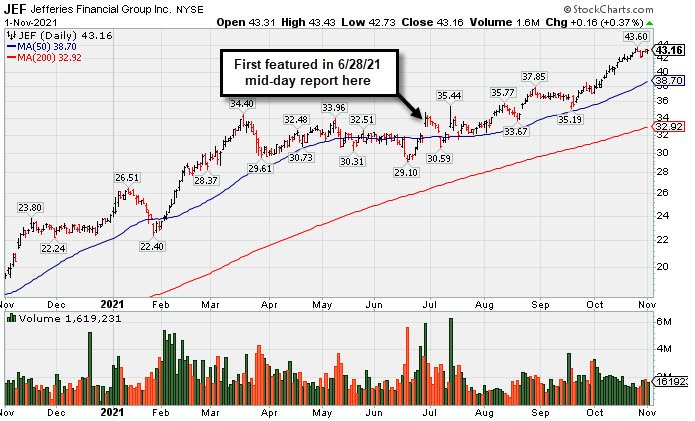
Extended From Prior Highs and Stubbornly Holding Ground - Monday, November 1, 2021
Jefferies Financial Grp (JEF +$0.16 or +0.37% to $43.16) is very extended from any sound base and perched near its all-time high. Its 50-day moving average (DMA) line ($38.70) defines important near-term support to watch on pullbacks. Recently it reported Aug '21 quarterly earnings +40% on +20% sales revenues versus the year ago period, its 5th strong quarterly comparison with solid earnings increases and sales revenues growth. Its annual earnings history (the A criteria) has been strong. It has an Earnings Per Share Rating of 97.JEF was highlighted in yellow in the 6/28/21 mid-day report (read here) with pivot point cited based on its 5/10/21 high while building on a 14-week "double bottom" base. It was last shown in this FSU section on 9/29/21 with an annotated graph under the headline, "Perched at 52-week High With Earnings News Due". JEF hails from the Finance-Invest Bnk/Bkrs industry which is currently ranked 57th on the 197 Industry Groups list (L criteria).
The number of top-rated funds that own its shares rose from 650 in Sep '20 to 735 in Sep '21, a reassuring sign concerning the I criteria. It has a Timeliness Rating of B and a Sponsorship Rating of C.
.
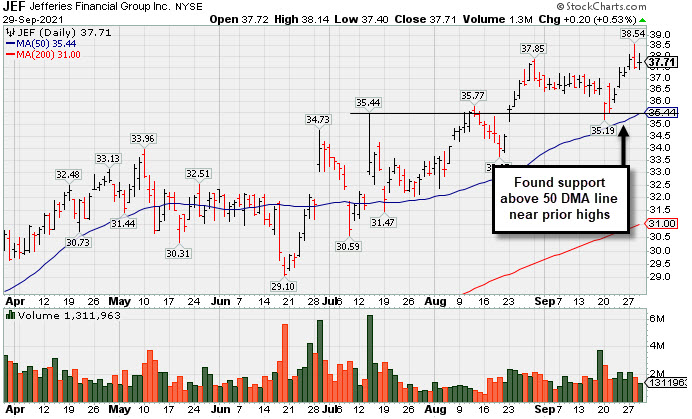
Perched at 52-week High With Earnings News Due - Wednesday, September 29, 2021
Jefferies Financial Grp (JEF +$0.20 or +0.53% to $37.71) is due to report Aug '21 quarterly results on Thursday, September 30, 2021 after market close. Volume and volatility often increase near earnings news. It reversed into the red on 9/28/21 after wedging to a new all-time high. Recently it found prompt support near prior highs in the $34-35 range and above its 50-day moving average (DMA) line ($35.16).JEF was highlighted in yellow in the 6/28/21 mid-day report (read here) with pivot point cited based on its 5/10/21 high while building on a 14-week "double bottom" base. It was last shown in this FSU section on 8/10/21 with an annotated graph under the headline, "Quiet Gains for New High Closes".
JEF hails from the Finance-Invest Bnk/Bkrs industry which is currently ranked 104th on the 197 Industry Groups list (L criteria). The firm's past 4 quarterly comparisons through May '21 showed very strong earnings increases with solid sales revenues growth. Annual earnings history (the A criteria) has been strong. It has an Earnings Per Share Rating of 99.
The number of top-rated funds that own its shares rose from 650 in Sep '20 to 736 in Jun '21, a reassuring sign concerning the I criteria. It has a Timeliness Rating of A and a Sponsorship Rating of D.
.
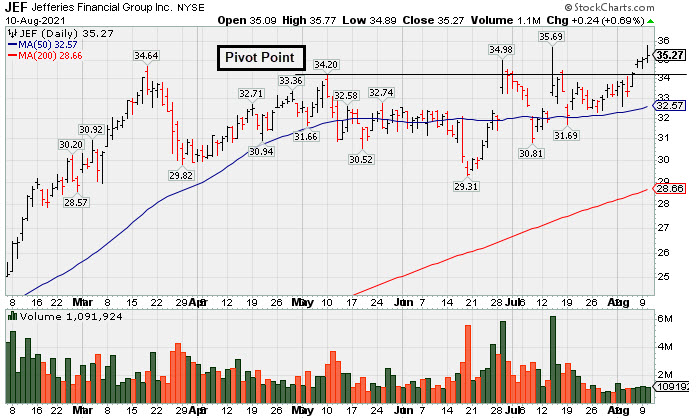
Quiet Gains for New High Closes - Tuesday, August 10, 2021
Jefferies Financial Grp (JEF +$0.24 or +0.69% to $35.27) quietly touched a new all-time high with today's 4th consecutive gain backed by lighter than average volume. It held its ground stubbornly and volume totals have been cooling since testing support at its 50-day moving average (DMA) line ($32.56). More damaging losses would raise concerns and trigger a technical sell signal. As previously noted - "Subsequent gains above the pivot point backed by at least +40% above average volume are necessary to trigger a technical buy signal."JEF was highlighted in yellow in the 6/28/21 mid-day report (read here) with pivot point cited based on its 5/10/21 high while building on a 14-week "double bottom" base. It hails from the Finance-Invest Bnk/Bkrs industry which is currently ranked 106th on the 197 Industry Groups list (L criteria). The firm's past 4 quarterly comparisons through May '21 showed very strong earnings increases with solid sales revenues growth. Annual earnings history (the A criteria) has been strong. It has an Earnings Per Share Rating of 99.
The number of top-rated funds that own its shares rose from 650 in Sep '20 to 736 in Jun '21, a reassuring sign concerning the I criteria. It has a Timeliness Rating of A and a Sponsorship Rating of D.
.
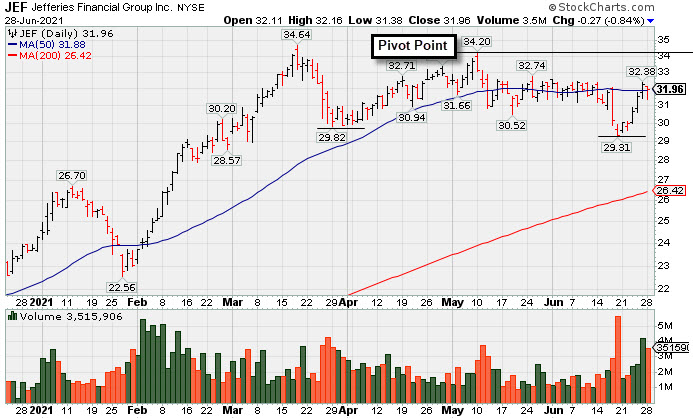
High-Ranked Financial Firm Formed "Double Bottom" Base - Monday, June 28, 2021
Jefferies Financial Grp (JEF -$0.27 or -0.84% to $31.96) was highlighted in yellow in the earlier mid-day report (read here) with pivot point cited based on its 5/10/21 high while building on a 14-week "double bottom" base. After dipping below prior lows it has rebounded near its 50-day moving average (DMA) line and toward its 52-week high. Subsequent gains above the pivot point backed by at least +40% above average volume are necessary to trigger a technical buy signal.It hails from the Finance-Invest Bnk/Bkrs industry which is currently ranked 39th on the 197 Industry Groups list (L criteria). firm's past 3 quarterly comparisons through Feb '21 showed strong earnings increases with solid sales revenues growth. Annual earnings history (the A criteria) has been strong. It has an Earnings Per Share Rating of 98.
The number of top-rated funds that own its shares rose from 650 in Sep '20 to 715 in Mar '21, a reassuring sign concerning the I criteria . It has a Timeliness Rating of A and a Sponsorship Rating of C.
.