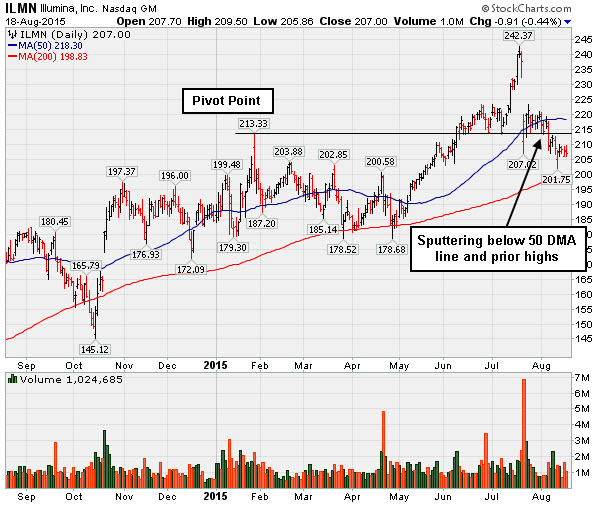
Illumina Inc (ILMN -$0.91 or -0.44% to $207.00) is still sputtering below its 50-day moving average (DMA) line. It outlook gets worse the longer it lingers below that important short-term average. The 200 DMA line ($198.83) defines the next important near-term support. Always follow the loss-limiting sell rules if any position ever falls more than -7% from your purchase price. The Medical - Research Equipment/Services firm has tallied only one gain with above average volume since it was last shown in this FSU section on 7/24/15 with an annotated graph under the headline, "Support Found After Abrupt Pullback Following Earnings News".
Its Relative Strength rating, now 80, is right at the 80+ minimum guideline for buy candidates. Resistance remains due to overhead supply up through the $242 level which may hinder its upward price progress for the near term. The number of top-rated funds owning its shares rose from 877 in Dec '13 to 1,174 in Jun '15, a reassuring sign concerning the I criteria. However, its abrupt pullback prompted a member inquiry and response which was included in the 7/23/15 After Market Report - see Ken's Mail Bag (read here).
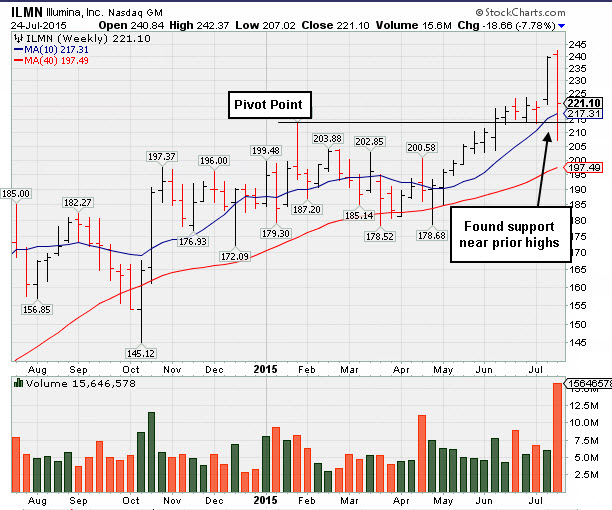
Illumina Inc (ILMN +$1.16 or +0.53% to $221.10) pulled back after it reported earnings +40% on +21% sales revenues for the Jun '15 quarter. Fundamentals remain strong, with earnings above the +25% minimum guideline (C criteria). However, in sequential quarterly comparisons the increases in sales revenues and earnings have shown deceleration in its growth rate. Its color code was changed to yellow after finding support near its 50-day moving average DMA line ($215.73) and prior highs in the $213 area. More damaging losses leading to violations would trigger technical sell signals.
The Medical - Research Equipment/Services firm wedged to new highs with gains lacking great volume conviction after last shown in this FSU section on 7/08/15 with am annotated graph under the headline, "Still Above Near-Term Support After Pullback on Higher Volume". Its Relative Strength rating, now 87, remains above the 80+ minimum guideline for buy candidates. But resistance remains due to overhead supply up through the $242 level which may hinder its upward price progress for the near term.
It reported earnings +33%, +71%, +93%, and +72% in the Jun, Sep, Dec '14 and Mar '15 quarters, respectively, versus the year ago periods. Sales revenues increases were +29%, +35%, +32%, and +28% during that span.Its annual earnings (A criteria) growth history has improved steadily since a downturn in FY '09.
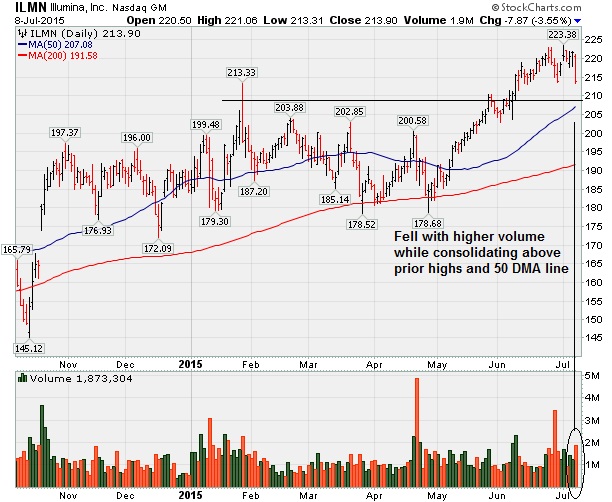
Illumina Inc (ILMN -$7.87 or -3.55% to $213.90) fell on higher volume today while consolidating above its 50-day moving average (DMA) line and above prior highs defining important near-term support. The Medical - Research Equipment/Services firm was last shown in this FSU section on 6/08/15 with annotated graphs under the headline, "Perched Within Striking Distance of All-Time Highs". It was highlighted in yellow with new pivot point cited based on its 1/28/15 high plus 10 cents in the 6/08/15 mid-day report (read here). Volume-driven gains for new highs triggered a technical buy signal on the next day. Its Relative Strength rating, now 90, also improved further above the 80+ minimum guideline. Little resistance remains due to overhead supply.
It reported earnings +33%, +71%, +93%, and +72% in the Jun, Sep, Dec '14 and Mar '15 quarters, respectively, versus the year ago periods. Sales revenues increases were +29%, +35%, +32%, and +28% during that span. Fundamentals remain strong, with earnings above the +25% minimum guideline (C criteria). Sequential quarterly comparisons show encouraging sales revenues and earnings acceleration. Its annual earnings (A criteria) growth history has improved steadily since a downturn in FY '09.
The number of top-rated funds owning its shares rose from 877 in Dec '13 to 1,158 in Jun '15, a reassuring sign concerning the I criteria. Its current Up/Down Volume Ratio of 1.4 is an unbiased indication its shares have been under accumulation over the past 50 days. Its weekly graph shows it on track for a 7th consecutive weekly gain.
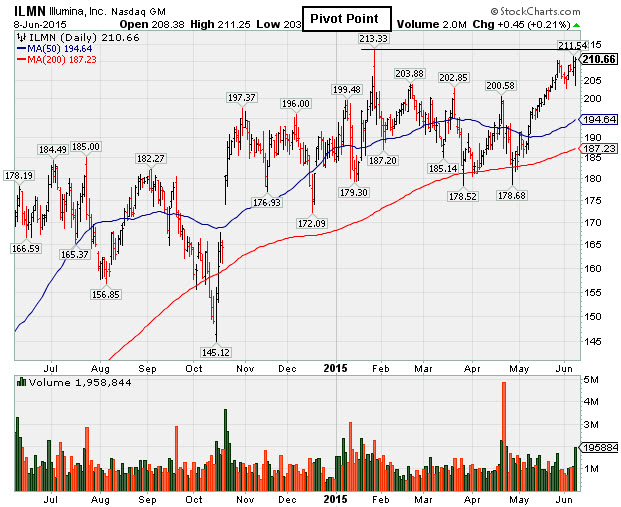
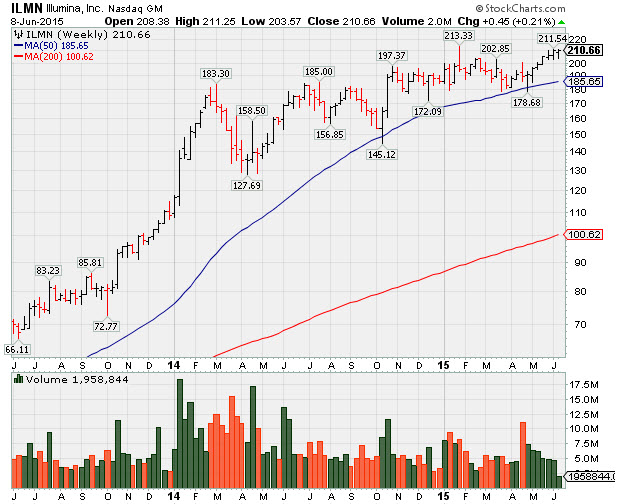
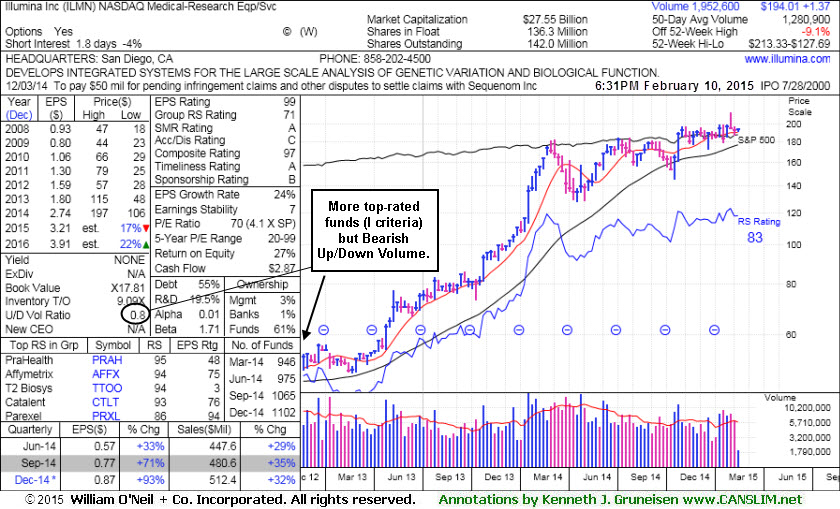
Illumina Inc (ILMN +$0.45 or +0.21% to $210.66) was highlighted in yellow with new pivot point cited based on its 1/28/15 high plus 10 cents in the earlier mid-day report (read here). Subsequent volume-driven gains for new highs may trigger a technical buy signal. It has rebounded within close striking distance of its 52-week high since last noted with caution on 4/27/15 as it found support at its 200 DMA line. Its Relative Strength rating, now 83, improved above the 80+ minimum guideline for buy candidates.
There was a "negative reversal" after touching a new 52-week high on 1/28/15, finishing with a loss on above average volume. Now very little resistance remains due to overhead supply up through the $213 level. The Medical - Research Equipment/Services firm was last shown in this FSU section on 4/15/15 with annotated graphs under the headline, "Earnings Report Due Next Week May Generate Volatility". It proved resilient since dropped from the Featured Stocks list on 4/27/15.
It reported earnings +33%, +71%, +93%, and +72% in the Jun, Sep, Dec '14 and Mar '15 quarters, respectively, versus the year ago periods. Sales revenues increases were +29%, +35%, +32%, and +28% during that span. Fundamentals remain strong, with earnings above the +25% minimum guideline (C criteria). Sequential quarterly comparisons show encouraging sales revenues and earnings acceleration. Its annual earnings (A criteria) growth history has improved steadily since a downturn in FY '09.
The number of top-rated funds owning its shares rose from 877 in Dec '13 to 1,141 in Mar '15, a reassuring sign concerning the I criteria. Its current Up/Down Volume Ratio of 1.5 is an unbiased indication its shares have been under accumulation over the past 50 days. Its weekly graph shows it on track for a 7th consecutive weekly gain.
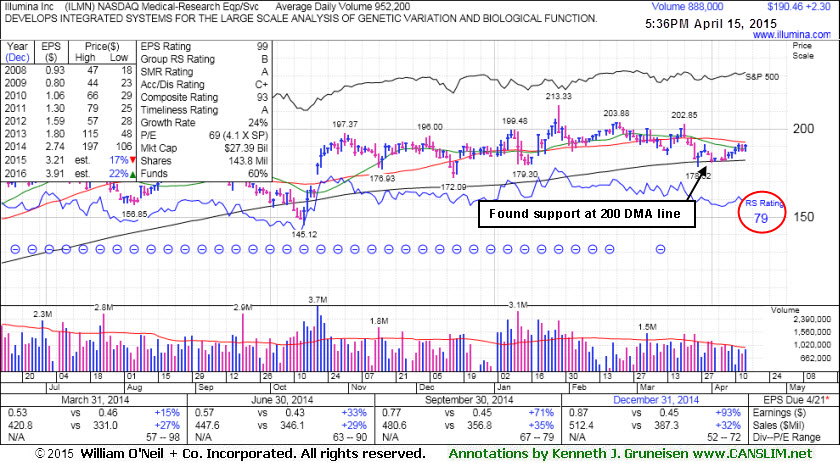
Illumina Inc (ILMN +$2.30 or +1.22% to $190.46) tallied another quiet today. This Medical - Research Equipment/Services firm was last shown in this FSU section on 3/25/15 with annotated graphs under the headline, "Relative Strength Rating Falls While Testing 200-Day Average". It found support at its 200-day moving average (DMA) line, but while it halted its slide recent gains have lacked great volume conviction.
The company will issue results for first quarter 2015 following the close of market on Tuesday, April 21, 2015. Keep in mind that volume and volatility often increase near earnings news. Its Relative Strength rating, now 79, remains just below the 80+ minimum guideline for buy candidates. Subsequent gains above the 50 DMA line ($192.49) would help its technical stance and near-term outlook to improve.
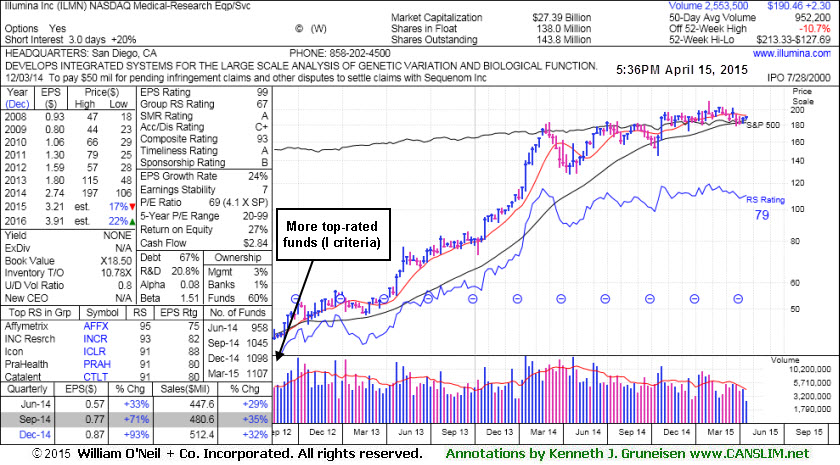
There was a "negative reversal" after touching a new 52-week high on 1/28/15, finishing with a loss on above average volume. ILMN now faces resistance due to overhead supply up through the $213 level. It really has made no headway since highlighted in the 10/22/14 mid-day report (read here). Fundamentals remain strong as it reported earnings +93% on +32% sales revenues for the Dec '14 quarter, its 3rd consecutive quarterly comparison with earnings above the +25% minimum guideline (C criteria). Sequential quarterly comparisons show encouraging sales revenues and earnings acceleration. Its annual earnings (A criteria) growth history has improved steadily since a downturn in FY '09. The number of top-rated funds owning its shares rose from 877 in Dec '13 to 1,107 in Mar '15, a reassuring sign concerning the I criteria.
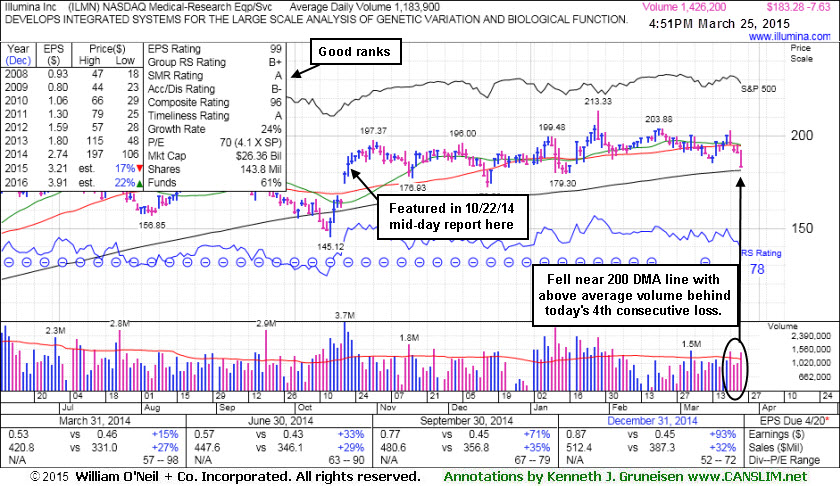
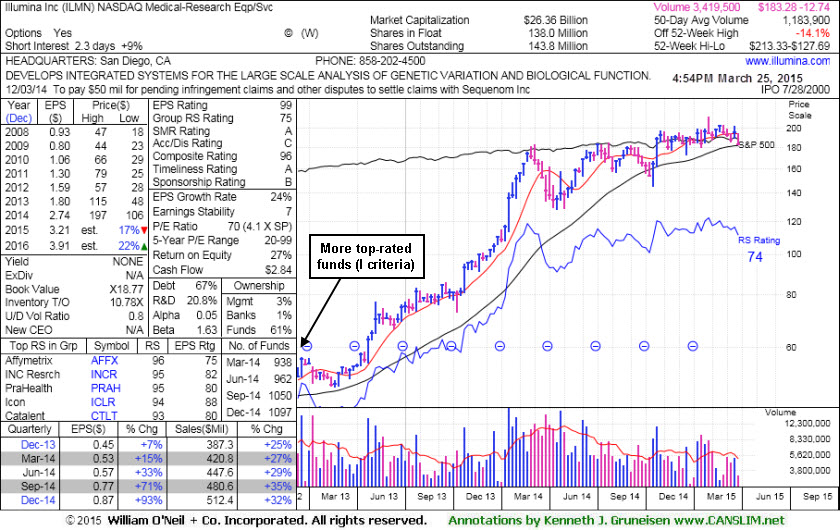
Illumina Inc (ILMN -$7.63 or -4.00% to $183.28) slumped further below its 50-day moving average (DMA) line and near its 200 DMA line with a big loss today on above average volume. There was a "negative reversal" after touching a new 52-week high on 1/28/15, finishing with a loss on above average volume.This Medical - Research Equipment/Services firm was last shown in this FSU section on 3/05/15 with annotated graphs under the headline, "Found Support at 50-Day Moving Average Line But Relative Strength Has Slumped". Now its Relative Strength rating has slumped to 74, below the 80+ minimum guideline for buy candidates.
ILMN now faces resistance due to overhead supply up through the $213 level. It really has made no headway since highlighted in the 10/22/14 mid-day report (read here). Fundamentals remain strong as it reported earnings +93% on +32% sales revenues for the Dec '14 quarter, its 3rd consecutive quarterly comparison with earnings above the +25% minimum guideline (C criteria). Sequential quarterly comparisons show encouraging sales revenues and earnings acceleration. Its annual earnings (A criteria) growth history has improved steadily since a downturn in FY '09. The number of top-rated funds owning its shares rose from 877 in Dec '13 to 1,097 in Dec '14, a reassuring sign concerning the I criteria.
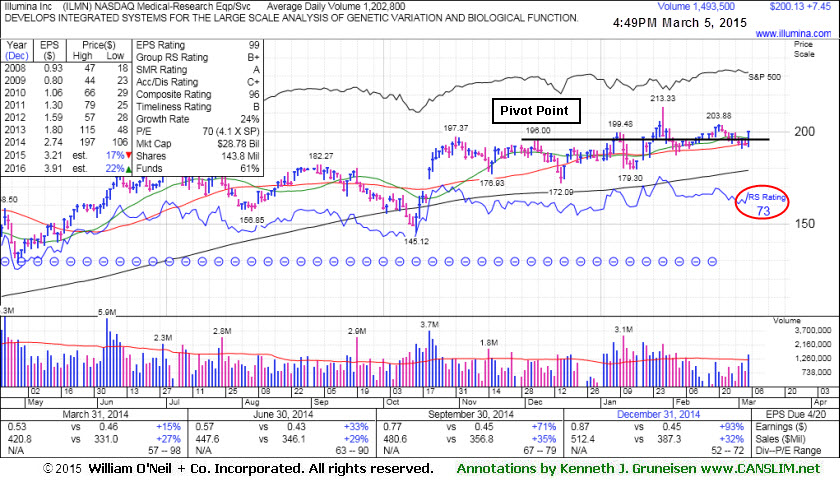
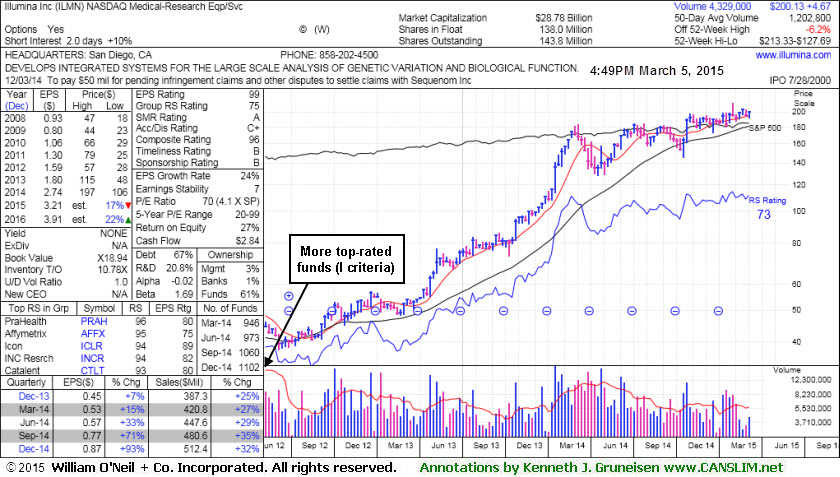
Illumina Inc (ILMN +$7.45 or +3.87% to $200.13) posted a gain today with above average volume. It found support while consolidating near its 50-day moving average (DMA) line ($193.59) where more damaging losses would raise greater concerns. There was a "negative reversal" after touching a new 52-week high on 1/28/15, finishing with a loss on above average volume.
This Medical - Research Equipment/Services firm was last shown in this FSU section on 2/10/15 with annotated graphs under the headline, "Following 'Negative Reversal' Gains Have Lacked Volume". Little resistance remains due to overhead supply, however, it has made limited headway since highlighted in the 10/22/14 mid-day report (read here). Its Relative Strength rating has slumped to 73 (see red circle), below the 80+ minimum for buy candidates.
It reported earnings +93% on +32% sales revenues for the Dec '14 quarter, its 3rd consecutive quarterly comparison with earnings above the +25% minimum guideline (C criteria). Sequential quarterly comparisons show encouraging sales revenues and earnings acceleration. Its annual earnings (A criteria) growth history has improved steadily since a downturn in FY '09. The number of top-rated funds owning its shares rose from 877 in Dec '13 to 1,102 in Dec '14, a reassuring sign concerning the I criteria.
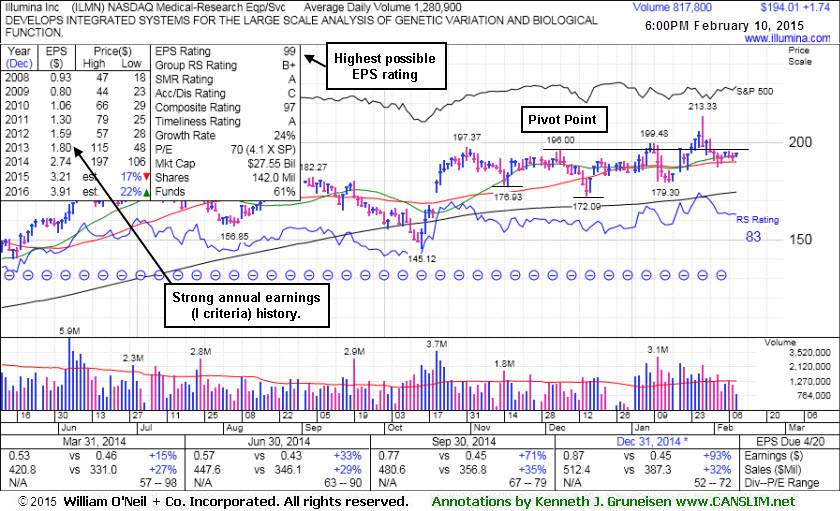
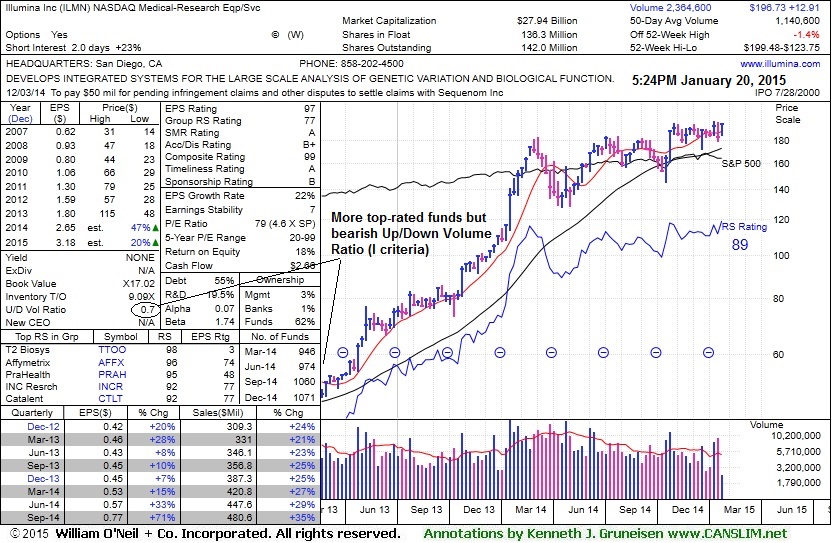
Illumina Inc (ILMN +$1.74 or +0.90% to $194.01) posted a small gain today with below average volume. Its 50-day moving average (DMA) line ($189.93) defines important near-term support to watch where more damaging losses would raise greater concerns. Little resistance remains due to overhead supply, however, it has made limited headway since highlighted in the 10/22/14 mid-day report (read here).
This Medical - Research Equipment/Services firm was last shown in this FSU section on 1/20/15 with annotated graphs under the headline, "Rebound Above 50-Day Moving Average Helped Technical Stance", as a big gain backed by twice average volume was noted as action indicative of meaningful institutional support. Its current Relative Strength (RS) rank is down from 89 to 83 since then, yet still above the 80+ minimum guideline for buy candidates. Subsequent gains above the $200 level lacked great volume conviction. Then, there was a "negative reversal" with higher volume on 1/28/15 after gapping up and hitting a new 52-week high. It has sputtered with small gains again lacking volume conviction.
It reported earnings +93% on +32% sales revenues for the Dec '14 quarter, its 3rd consecutive quarterly comparison with earnings above the +25% minimum guideline (C criteria). Sequential quarterly comparisons show encouraging sales revenues and earnings acceleration. Its annual earnings (A criteria) growth history has improved steadily since a downturn in FY '09. The number of top-rated funds owning its shares rose from 877 in Dec '13 to 1,102 in Dec '14, a reassuring sign concerning the I criteria.
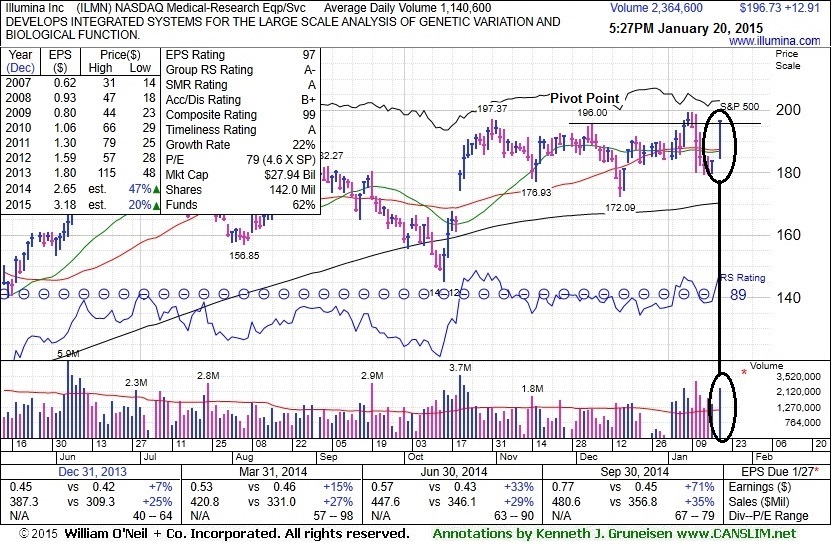
Illumina Inc (ILMN +$12.91 or +7.02% to $196.73) rebounded above its 50-day moving average (DMA) line with today's big gain backed by twice average volume, action indicative of meaningful institutional buying demand. That helped its technical stance improve and its color code was changed to yellow. This Medical - Research Equipment/Services firm was last shown in this FSU section on 12/30/14 with annotated graphs under the headline, "Forming New Base And Fundamentals Remain Favorable".
ILMN made limited headway since highlighted in the 10/22/14 mid-day report (read here). It stalled after rallying from the previously noted "double bottom" base. However, little resistance remains due to overhead supply after the impressive rebound today.
Disciplined investors avoid chasing stocks more than +5% above their prior highs and always limit losses by selling any stock that falls more than -7% from their purchase price. Any stock which is sold can always be bought back later if strength returns.
ILMN reported earnings +71% on +35% sales revenues for the Sep '14 quarter, its 2nd consecutive quarterly comparison with earnings above the +25% minimum guideline (C criteria). Sequential quarterly comparisons show encouraging sales revenues and earnings acceleration. Its current Relative Strength (RS) rank of 89 is well above the 80+ minimum guideline for buy candidates. Its annual earnings (A criteria) growth history has improved steadily since a downturn in FY '09. The number of top-rated funds owning its shares rose from 877 in Dec '13 to 1,071 in Dec '14, a reassuring sign concerning the I criteria.
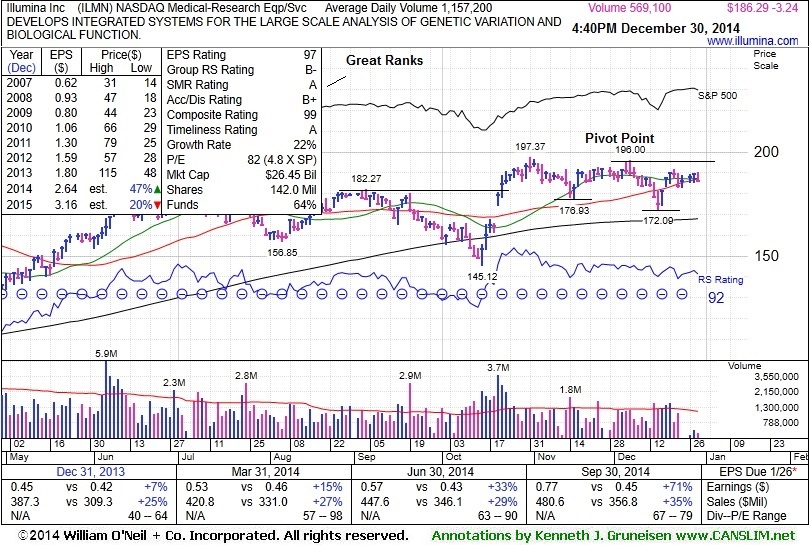
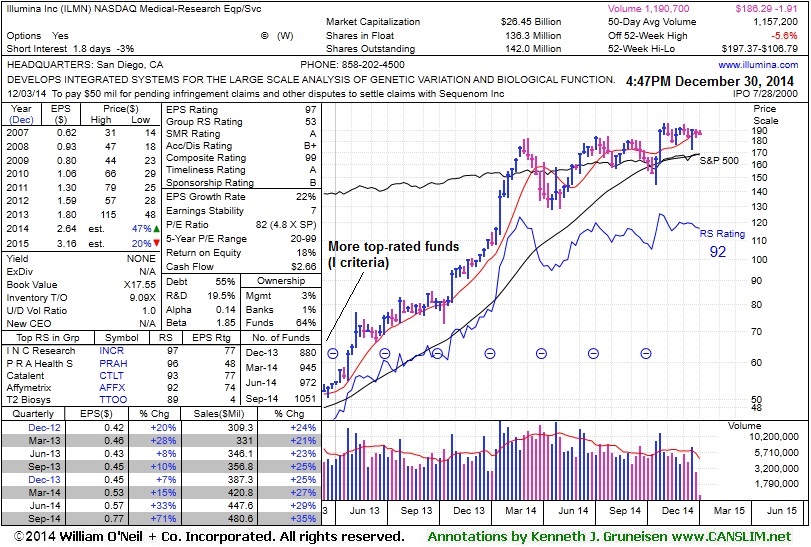
Illumina Inc (ILMN -$3.24 or -1.71% to $186.29) has been finding support near its 50-day moving average (DMA) line ($187.06). It appears to be forming a new "double bottom" base. There is some resistance due to overhead supply up through $197, however its color code was changed to yellow, and a volume-driven gain above the new pivot point cited based on its 12/05/14 high would trigger a new technical buy signal. Disciplined investors avoid chasing stocks more than +5% above their prior highs and always limit losses by selling any stock that falls more than -7% from their purchase price.
This Medical - Research Equipment/Services firm was last shown in this FSU section on 12/15/4 with annotated graphs under the headline, "Violation of 50-Day Average Triggered Technical Sell Signal , It undercut prior highs in the $182 area and triggered technical sell signals. ILMN made limited headway since highlighted in the 10/22/14 mid-day report (read here).
ILMN reported earnings +71% on +35% sales revenues for the Sep '14 quarter, its 2nd consecutive quarterly comparison with earnings above the +25% minimum guideline (C criteria). Sequential quarterly comparisons show encouraging sales revenues and earnings acceleration. Its current Relative Strength (RS) rank of 92 is well above the 80+ minimum guideline for buy candidates. Its annual earnings (A criteria) growth history has improved steadily since a downturn in FY '09. The number of top-rated funds owning its shares rose from 877 in Dec '13 to 1,051 in Sep '14, a reassuring sign concerning the I criteria.
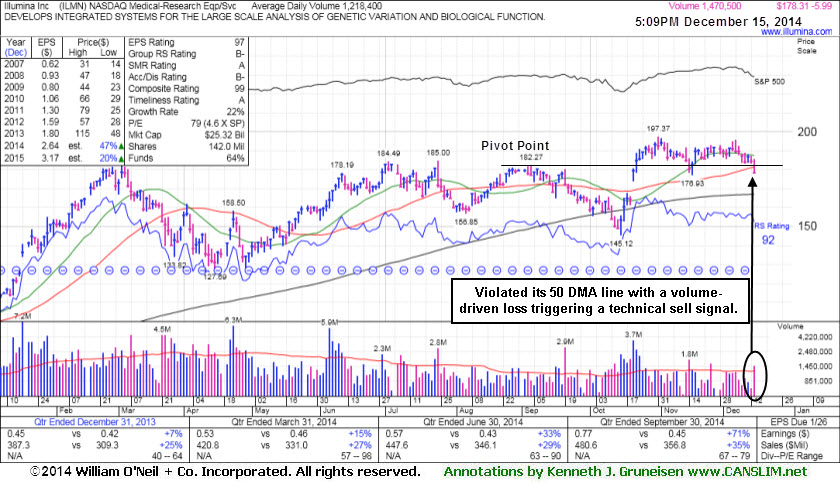
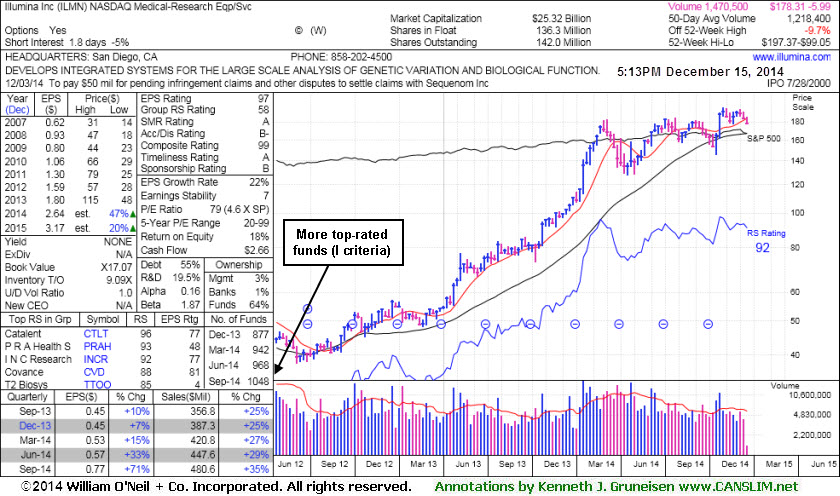
Illumina Inc (ILMN -$5.99 or -3.25% to $178.31) slumped below its 50-day moving average (DMA) line and below its prior highs in the $182 area raising concerns while falling back into its prior base and triggering a technical sell signal. Only a prompt rebound above its 50 DMA line would help its outlook improve.
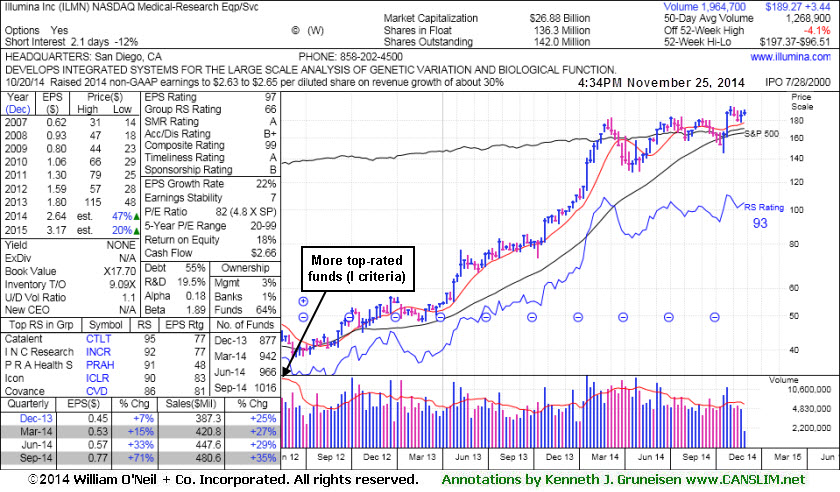
It was last shown in this FSU section on 11/25/14 with annotated graphs under the headline, "Quietly Consolidating Back Below 'Max Buy' Level". ILMN was highlighted in the 10/22/14 mid-day report (read here). The pivot point cited was based on its 9/04/14 high in a "double bottom" base pattern. Considerable volume-driven gains triggered a technical buy signal. It got a little bit extended, then its color code was changed to yellow after dipping back below its "max buy" level. Disciplined investors avoid chasing stocks more than +5% above their prior highs and always limit losses by selling any stock that falls more than -7% from their purchase price.
This Medical - Research Equipment/Services firm reported earnings +71% on +35% sales revenues for the Sep '14 quarter, its 2nd consecutive quarterly comparison with earnings above the +25% minimum guideline (C criteria). Sequential quarterly comparisons show encouraging sales revenues and earnings acceleration.
Its current Relative Strength (RS) rank of 92 is well above the 80+ minimum guideline for buy candidates. Its annual earnings (A criteria) growth history has improved steadily since a downturn in FY '09. The number of top-rated funds owning its shares rose from 877 in Dec '13 to 1,048 in Sep '14, a reassuring sign concerning the I criteria.
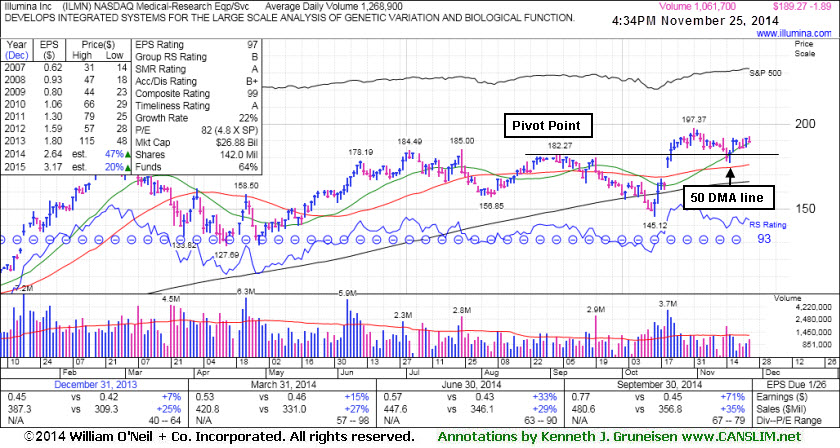
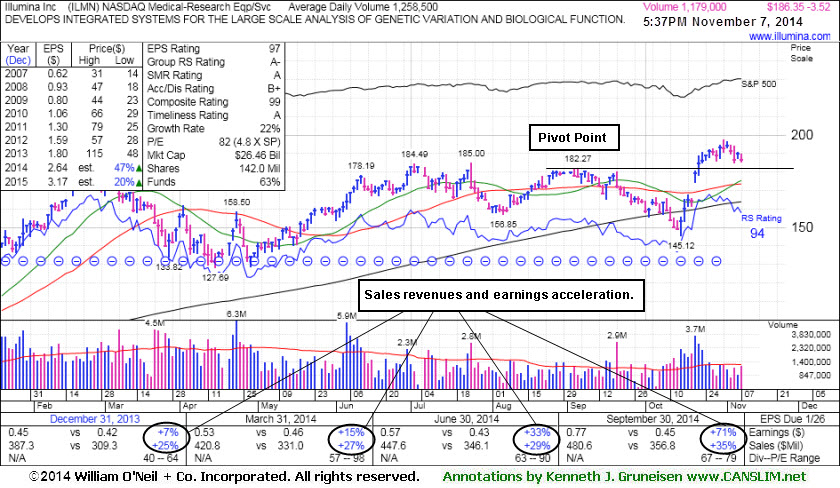
Illumina Inc (ILMN -$1.95 or -1.02% to $189.21) has seen its volume totals cooling while consolidating. Prior highs near $182 acted as support above its 50-day moving average (DMA) line on the recent pullback. More damaging losses would raise concerns and trigger a technical sell signal. It was last shown in this FSU section on 11/07/14 with annotated graphs under the headline, "Consolidating Above Prior Highs Which Define Initial Support".
ILMN was highlighted in the 10/22/14 mid-day report (read here). The pivot point cited was based on its 9/04/14 high in a "double bottom" base pattern. Considerable volume-driven gains triggered a technical buy signal. It got a little bit extended, then its color code was changed to yellow after dipping back below its "max buy" level. Disciplined investors avoid chasing stocks more than +5% above their prior highs and always limit losses by selling any stock that falls more than -7% from their purchase price.
This Medical - Research Equipment/Services firm reported earnings +71% on +35% sales revenues for the Sep '14 quarter, its 2nd consecutive quarterly comparison with earnings above the +25% minimum guideline (C criteria). Sequential quarterly comparisons show encouraging sales revenues and earnings acceleration.
Its current Relative Strength (RS) rank of 93 is well above the 80+ minimum guideline for buy candidates. Its annual earnings (A criteria) growth history has improved steadily since a downturn in FY '09. The number of top-rated funds owning its shares rose from 877 in Dec '13 to 1,015 in Sep '14, a reassuring sign concerning the I criteria.
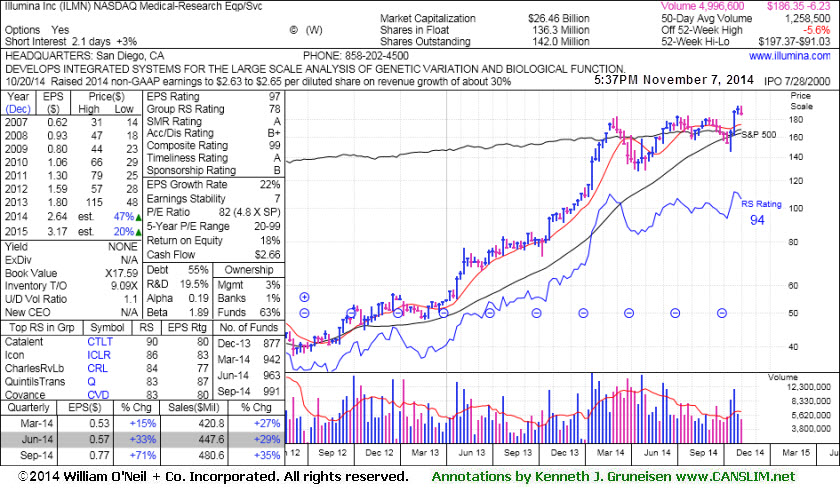
Illumina Inc (ILMN +$5.27 or +2.94% to $184.82) has recently endured mild distributional pressure, but recent losses were on below average volume. Its color code was changed to yellow after dipping below its "max buy" level. Prior highs near $182 define initial support to watch on pullbacks. Disciplined investors always limit losses by selling any stock that falls more than -7% from their purchase price.
It was last shown in this FSU section on 10/22/14 with annotated graphs under the headline, "Breakout Cleared 'Double Bottom' Base Pattern", after highlighted in the earlier mid-day report (read here). The pivot point cited was based on its 9/04/14 high in a "double bottom" base pattern. Considerable volume-driven gains added to its winning streak and triggered a technical buy signal. This Medical - Research Equipment/Services firm reported earnings +71% on +35% sales revenues for the Sep '14 quarter, its 2nd consecutive quarterly comparison with earnings above the +25% minimum guideline (C criteria). Sequential quarterly comparisons show encouraging sales revenues and earnings acceleration.
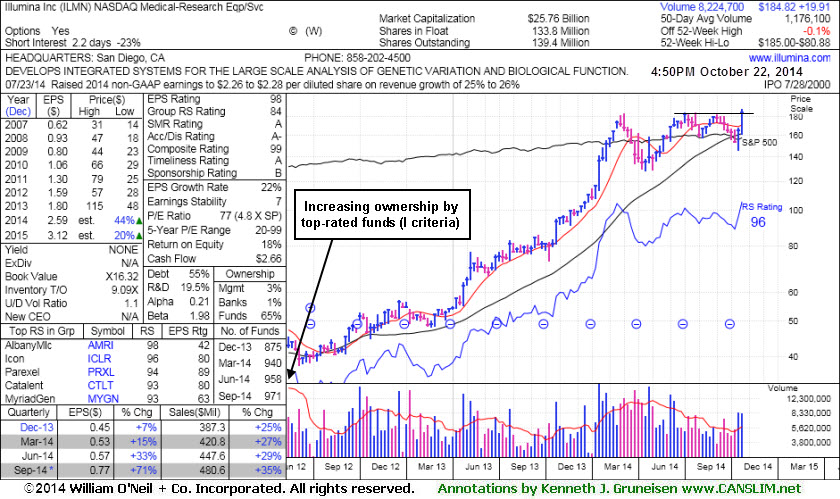
Its current Relative Strength (RS) rank of 94 is well above the 80+ minimum guideline for buy candidates. Historic examples of the market's biggest winners typically showed their relative strength lines (the jagged blue line) usually spiked to new highs ahead of, or while the stock was making new highs. In this case, however, its RS line peaked a bit higher in February of 2014. Its annual earnings (A criteria) growth history has improved steadily since a downturn in FY '09. The number of top-rated funds owning its shares rose from 877 in Dec '13 to 991 in Sep '14, a reassuring sign concerning the I criteria.
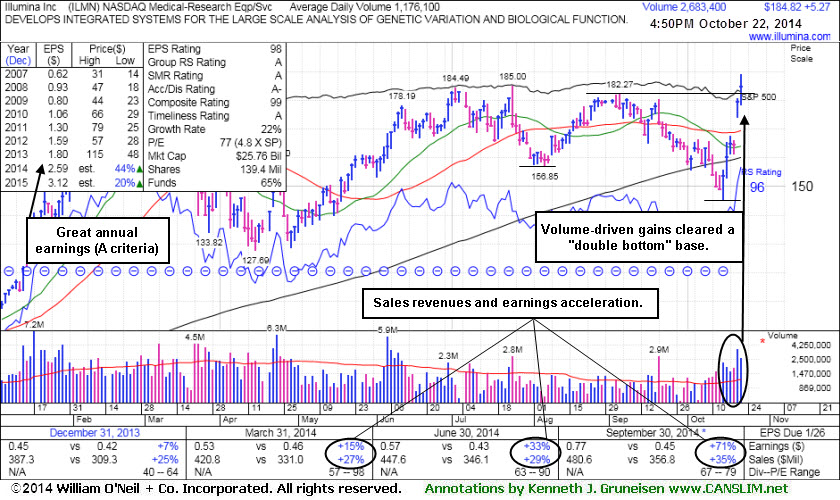
This Medical - Research Equipment/Services firm reported earnings +71% on +35% sales revenues for the Sep '14 quarter, its 2nd consecutive quarterly comparison with earnings above the +25% minimum guideline (C criteria). Sequential quarterly comparisons show encouraging sales revenues and earnings acceleration. Its current Relative Strength (RS) rank of 96 is well above the 80+ minimum guideline for buy candidates. Historic examples of the market's biggest winners typically showed their relative strength lines (the jagged blue line) usually spiked to new highs ahead of, or while the stock was making new highs. In this case, however, its RS line peaked a bit higher in February of 2014. Its annual earnings (A criteria) growth history has improved steadily since a downturn in FY '09.
ILMN endured deep consolidations below its 200-day moving average (DMA) line then made impressive progress since last shown in this FSU section on 6/12/09 with annotated graphs under the headline, "Sinking RS Rating Indicates Mediocre Price Performance". when the company began offering a new high-quality personal genome sequencing for consumers.
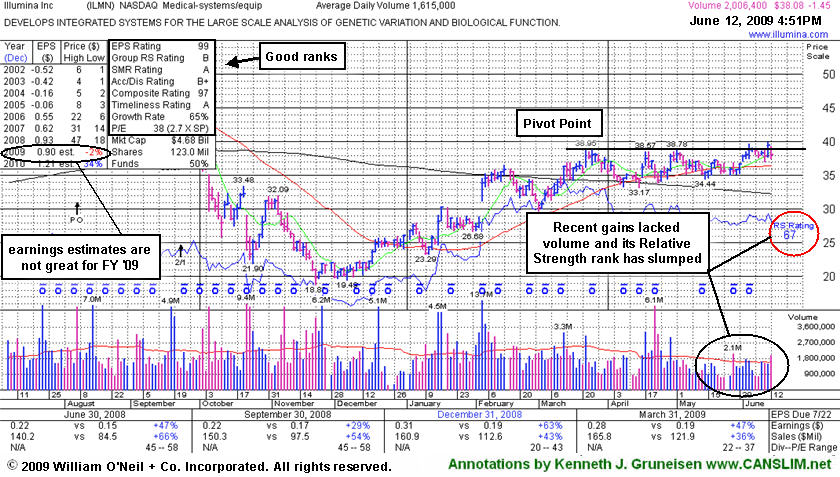
Illumina Inc (ILMN -$1.45 or -2.46% to $38.08) encountered distributional pressure today. Unimpressive volume totals behind recent gains are clear evidence that institutional investors were unmoved, even after news this week that the company began offering a new high-quality personal genome sequencing for consumers (read here). And as recently noted, this stock's Relative Strength (RS) rank has slumped well below the 80+ guideline (currently 67). Its RS rank was 88 when it was first featured featured in the May 2009 issue of CANSLIM.net News (read here). That rank fell off as it continued consolidating and failed to produce confirming gains above its pivot point to trigger a proper technical buy signal since featured. Historic examples of the market's biggest winners typically showed better relative strength, and their relative strength lines (the jagged blue line) usually spiked to new highs ahead of, or while the stock was making new highs.
Its prior chart high on March 23rd plus ten cents is the basis for its $39.05 pivot point and $41.00 maximum buy price cited in earlier reports. This Medical Systems/Equipment firm has shown solid quarterly sales revenues and earnings increases that satisfy the C criteria, and its annual earnings (the A criteria) growth history has improved in recent years. Another concern, along with its waning relative strength rating, is that Street estimates for its FY '09 are calling for earnings -2% versus the prior year. Technically, deterioration under its 50-day moving average line and recent chart low ($34.44) would raise more serious concerns and could trigger sell signals.
Illumina Inc (ILMN +$0.88 or +2.46% to $36.71) rallied to a close back above its 50-day moving average (DMA) line. It has been consolidating in a very tight trading range for nearly 3 months. Its Relative Strength has deteriorated and it has yet to produce confirming gains above its pivot point to trigger a proper technical buy signal since recently featured in the May 2009 issue of CANSLIM.net News (read here). Historic examples of the market's biggest winners typically showed better relative strength, and their relative strength lines (the jagged blue line) usually spiked to new highs ahead of, or while the stock was making new highs. Another concern is that Street estimates for its FY '09 are calling for earnings -2% versus the prior year. Technically, deterioration under its recent chart low ($34.44) would raise more concerns.
Its prior chart high on March 23rd is the basis for its $39.05 pivot point and a $41.00 maximum buy price cited in earlier reports. This Medical Systems/Equipment firm has shown solid quarterly sales revenues and earnings increases that satisfy the C criteria and its annual earnings (the A criteria) growth history has improved in recent years. The stock should remain on an updated watch list. Technically, sufficient gains above the pivot point with heavy volume are still needed to confirm a proper buy signal.
C A N S L I M | StockTalk | News | Chart | SEC | Zacks Reports | ![]()
![]()
![]()
View all notes | Alert me of new notes | CANSLIM.net Company Profile
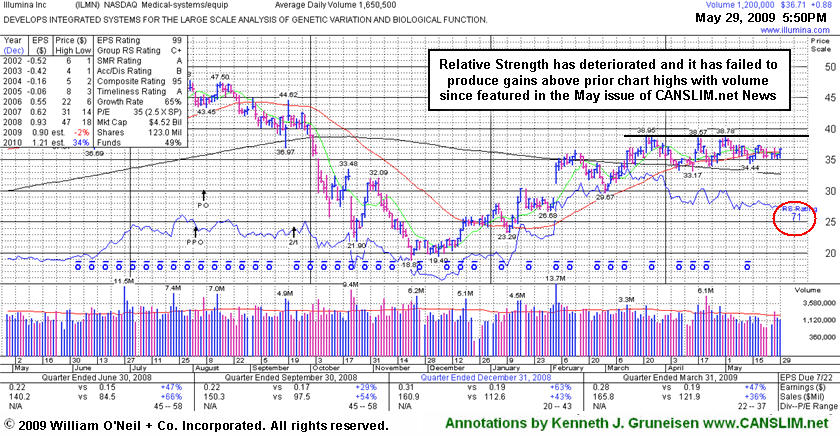
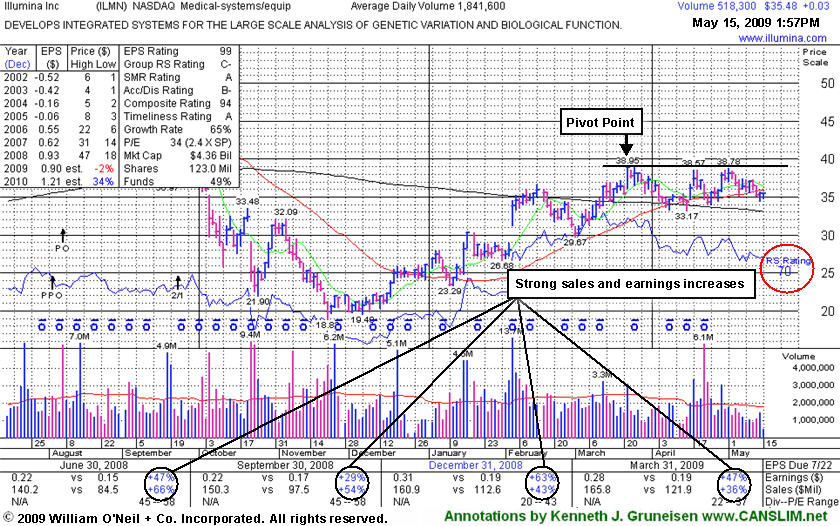
Illumina Inc's (ILMN $0.19 or +0.53% to $35.64) volume continues to dry up while it consolidates in a tight trading range in recent weeks, but it has quietly slumped just under its 50-day moving average (DMA) line. Its Relative Strength rank (see red circle) has also slipped to 70 from 85 when it last appeared in this Featured Stock Update section on May 5th (read here), which raises concerns the stock is lagging. Historic examples of the market's biggest winners typically showed better relative strength, and their relative strength lines (the jagged blue line) usually spiked to new highs ahead of, or while the stock was making new highs. Another concern is that Street estimates for its FY '09 are calling for earnings -2% versus the prior year.
Obviously, this high-ranked stock has yet to produce confirming gains above its pivot point to trigger a proper technical buy signal since recently featured in the May 2009 issue of CANSLIM.net News (read here). Its prior chart high on March 23rd is the basis for its $39.05 pivot point and a $41.00 maximum buy price cited in earlier reports. This high-ranked Medical Systems/Equipment firm has shown solid quarterly sales revenues and earnings increases that satisfy the C criteria and its annual earnings (the A criteria) growth history has improved in recent years. The stock should remain on an updated watch list. Technically, sufficient gains above the pivot point with heavy volume are still needed to confirm a proper buy signal
C A N S L I M | StockTalk | News | Chart | SEC | Zacks Reports | ![]()
![]()
![]()
View all notes | Alert me of new notes | CANSLIM.net Company Profile
Healthy stocks that are within close striking distance of new highs are often great buy candidates for investors to keep on their watch lists, especially when the companies match favorably with all of the investment system's criteria.
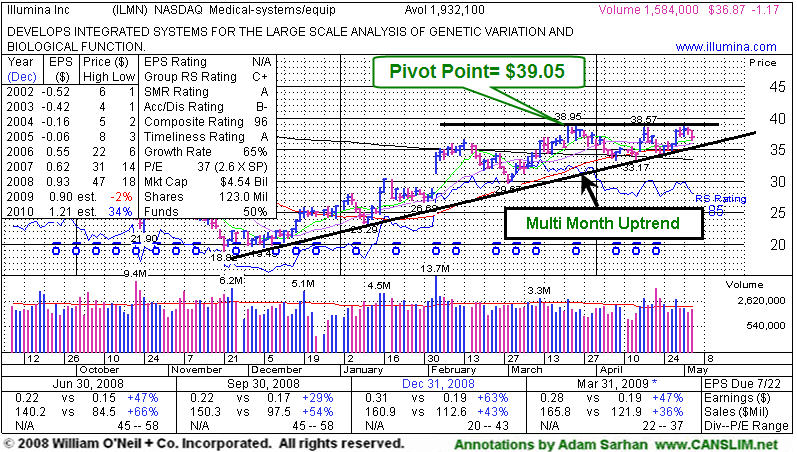
Illumina Inc. (ILMN DOWN -$1.17 or -3.08% to $36.87) closed lower as this high ranked stock continues working on its latest base. The stock's healthy action helped it appear in the May edition of the CANSLIM.net News here with a $39.05 pivot point and a $41.00 maximum buy price. This high-ranked Medical Systems/Equipment firm has shown solid quarterly sales revenues and earnings increases that satisfy the C criteria and its annual earnings (the A criteria) growth history has improved in recent years. At this point, the stock is still consolidating its recent move below its pivot point and above its multi month upward sloping trendline (support) and should remain on an updated watch list. Technically, sufficient gains above the pivot point with heavy volume are still needed to confirm a proper buy signal.
C A N S L I M | StockTalk | News | Chart | SEC | Zacks Reports | ![]()
![]()
![]()
View all notes | Alert me of new notes | CANSLIM.net Company Profile
|
Illumina Inc. |
| |
|
Ticker Symbol: ILMN (NASDAQ) |
Industry Group: Medical- Systems/Equip |
Shares Outstanding: 123,000,000 |
|
Price: $38.14 5/1/2009 4:00PM ET |
Day's Volume: 1,753,800 5/1/2009 |
Shares in Float: 116,900,000 |
|
52 Week High: $47.88 7/28/2008 |
50-Day Average Volume: 1,948,300 |
Up/Down Volume Ratio: 1.1 |
|
Pivot Point: $39.05 3/23/2009 plus $0.10 |
Pivot Point +5% = Max Buy Price: $41.00 |
Web Address: http://www.illumina.com |
C A N S L I M | StockTalk | News | Chart | SEC | Zacks Reports | ![]()
![]()
![]()
CANSLIM.net Profile: Illumina, Inc. engages in the development, manufacture, and marketing of integrated systems for the analysis of genetic variation and biological function. Its instrumentation products include Genome Analyzer II, an instrument for high-throughput sequencing using Illumina sequencing by synthesis technology; iScan System, a high-resolution imaging instrument to scan BeadArray based assays; and BeadXpress Reader, a low- to mid-multiplex, high-throughput instrument for readout of assays. Illumina was founded in 1998 and is headquartered in San Diego, California. ILMN resides in the Medical-Systems Equipment group which is presently ranked 104th on the 197 Industry Groups list, which is outside the top quartile needed to satisfy the L criteria. There were 214 top-rated funds with an ownership interest as of March '08 and that number grew to 227 in December '08. a sign of reasonable institutional interest. Its annual earnings growth history has been steady but not especially strong, and quarterly earnings increases in the 4 latest quarterly earnings comparisons were borderline with the +25% guideline. Strong earnings increases are always preferred.
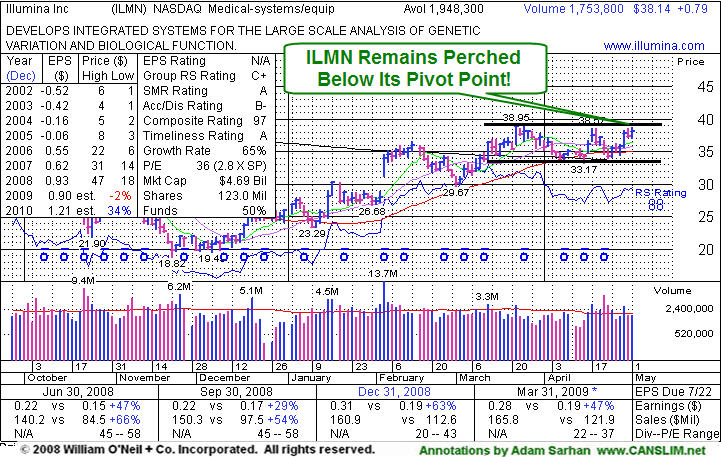
What to Look For and What to Look Out For: Look for the stock to confirm a new technical buy signal by breaking out and closing above its $39.05 pivot point with gains on heavy volume in the coming days and weeks. Remember that buyable breakouts require the stock to rise above its pivot point with considerable gains, and those gains must be backed by at least +50% above average volume. As always, it is of the utmost importance to sell a stock if it drops 7-8% below your purchase price. This high-ranked leader should remain on an active watchlist and could be considered as a new buy candidate in the event it closes above its pivot point on the necessary volume needed to trigger a technical buy signal.
Technical Analysis: ILMN is currently building a multi-month base and remains perched just below its pivot point. Illumina is trading above its upward sloping 50 day moving average line, which is typically a healthy sign. In addition, the 50 DMA line is currently above its longer term 200 DMA line which is also another positive.