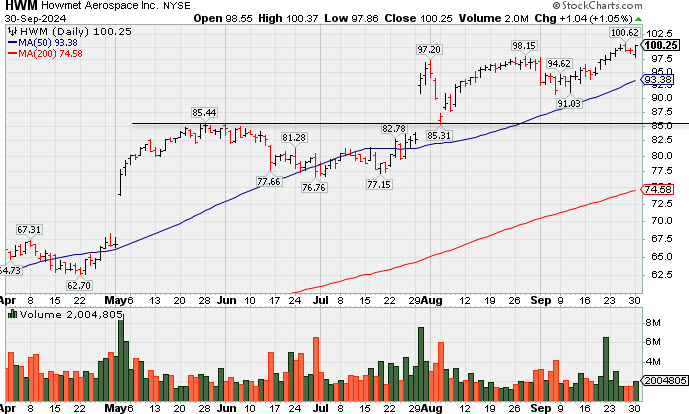
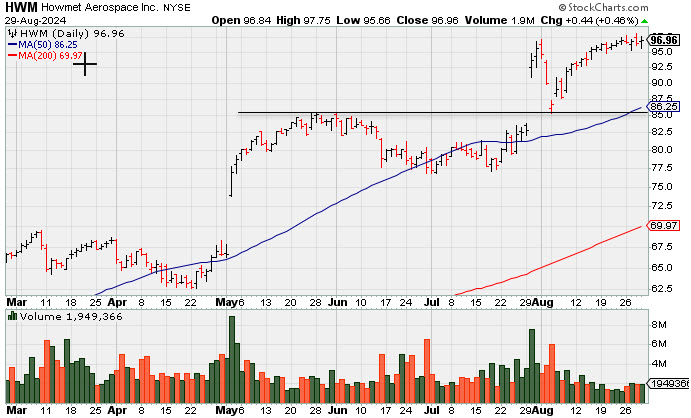
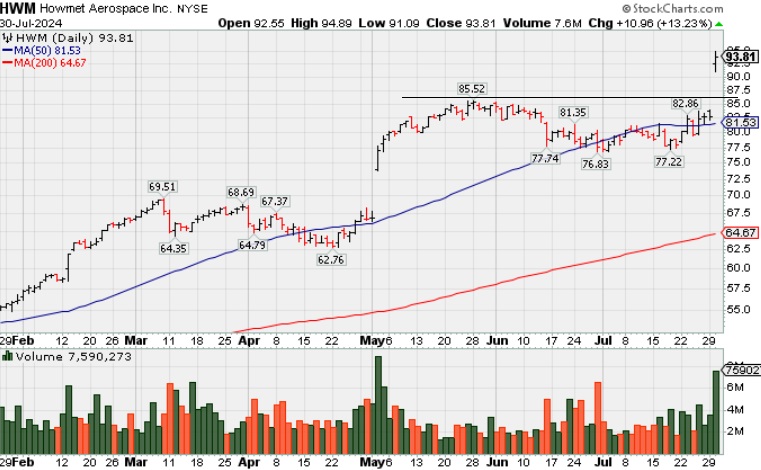
Chart courtesy of www.stockcharts.com
There is 1 more featured stock write-up on since to 3/3/2025

| Symbol/Exchange Company Name Industry Group | PRICE | CHANGE | Day High | Volume (% DAV) (% 50 day avg vol) | 52 Wk Hi | Featured Date | Price Featured | Pivot Featured |
| Max Buy | ||||||||
U.S. Lime & Minerals Bldg-Cement/Concrt/Ag | $121.34 | +10.78 9.75% | $121.78 | 111,722 50 DAV is 62,000 | $114.75 5.74% | 9/17/2024 | $71.26 | PP = $87.23 |
| MB = $91.59 | ||||||||
G - Powered to a new all-time high with a big gain today backed by above-average volume, its 8th gain in the span of 9 sessions. Its 50 DMA line ($94) defines important near-term support to watch on pullbacks. >>> FEATURED STOCK ARTICLE : Hovering Above Prior Highs Near All-Time High - 10/7/2024 | View all notes | Set NEW NOTE alert | Company Profile | SEC News | Chart | Request a new note | ||||||||
Granite Construction Bldg-Heavy Construction | $91.35 | +3.53 4.02% | $91.60 | 818,374 50 DAV is 670,000 | $89.11 2.51% | 6/11/2024 | $59.76 | PP = $64.33 |
| MB = $67.55 | ||||||||
G - Powered to another new all-time high with today''s 4th consecutive gain. Bullish action has come after it reported Sep '24 quarterly earnings +19% on +14% sales revenues versus the year-ago period, below the +25% minimum guideline (C criteria) of the fact-based investment system.. >>> FEATURED STOCK ARTICLE : Hovering Near All-Time High - 10/1/2024 | View all notes | Set NEW NOTE alert | Company Profile | SEC News | Chart | Request a new note | ||||||||
Texas Roadhouse Retail-Restaurants | $189.17 | +3.76 2.03% | $189.41 | 604,050 50 DAV is 717,000 | $196.29 -3.63% | 7/26/2024 | $173.08 | PP = $175.82 |
| MB = $184.61 | ||||||||
G - Posted a gain today with lighter volume after a pullback of 3 straight losses from its all-time high. Prior highs in the $177-180 area define initial support to watch above its 50 DMA line ($175.42) on pullbacks. >>> FEATURED STOCK ARTICLE : Gain With Light Volume for New High Close - 10/18/2024 | View all notes | Set NEW NOTE alert | Company Profile | SEC News | Chart | Request a new note | ||||||||
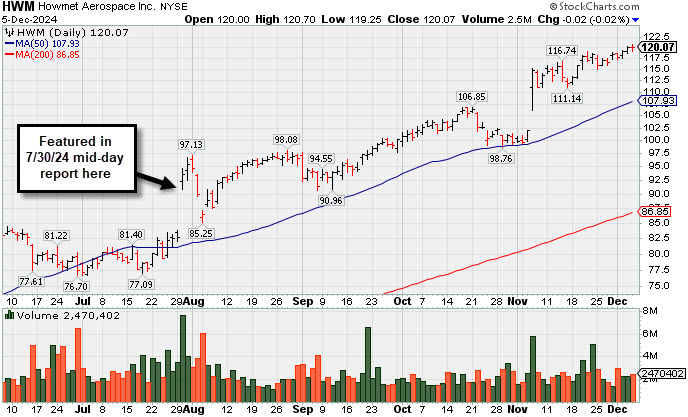
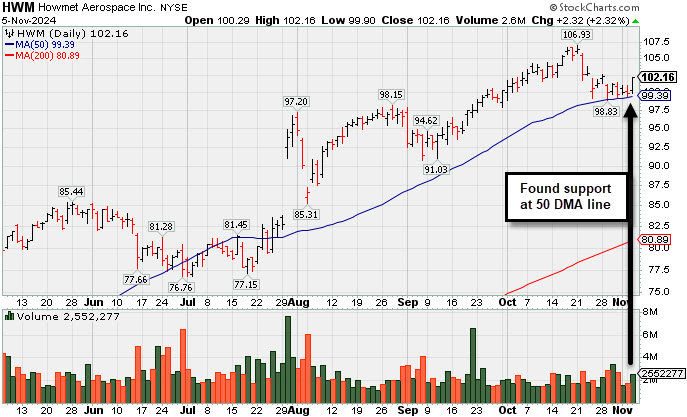
Howmet Aerospace Aerospace/Defense | $102.16 | +2.32 2.32% | $102.16 | 2,549,335 50 DAV is 2,223,000 | $106.93 -4.46% | 7/30/2024 | $93.95 | PP = $85.52 |
| MB = $89.80 | ||||||||
G - Found support with a gain today backed by higher volume while consolidating near its 50 DMA line and above prior highs in the $98 area. Keep in mind it is due to report Sep ''24 quarterly results before the open on Wednesday 11/06/24. Volume and volatility often increase near earnings news. More damaging losses would raise concerns and trigger a technical sell signal. See the latest FSU analysis for more details and a new annotated graph. >>> FEATURED STOCK ARTICLE : Found Support at 50-Day Moving Average Line Before Earnings Report - 11/5/2024 | View all notes | Set NEW NOTE alert | Company Profile | SEC News | Chart | Request a new note | ||||||||
MercadoLibre Retail-Internet | $2,090.01 | +26.31 1.27% | $2,094.92 | 282,587 50 DAV is 276,000 | $2,161.73 -3.32% | 8/5/2024 | $1,793.73 | PP = $1,792.15 |
| MB = $1,881.76 | ||||||||
| Most Recent Note - 11/4/2024 1:32:42 PM G - Posting a 3rd consecutive gain today, finding support near its 50 DMA line ($2,050). Little near-term resistance remains due to overhead supply up to the $2,161 level. >>> FEATURED STOCK ARTICLE : Testing 50-Day Moving Average Line - 10/3/2024 | View all notes | Set NEW NOTE alert | Company Profile | SEC News | Chart | Request a new note | ||||||||
| Symbol/Exchange Company Name Industry Group | PRICE | CHANGE | Day High | Volume (% DAV) (% 50 day avg vol) | 52 Wk Hi | Featured Date | Price Featured | Pivot Featured |
| Max Buy | ||||||||
Natural Grocers Retail-Super/Mini Mkts | $30.57 | +3.12 11.37% | $30.81 | 155,474 50 DAV is 82,000 | $30.32 0.82% | 11/5/2024 | $30.57 | PP = $30.42 |
| MB = $31.94 | ||||||||
Y - Color code is changed to yellow with new pivot point cited based on its 9/18/24 high plus 10 cents. Powered to a new all-time high with today''s considerable volume-driven gain triggering a new (or add-on) technical buy signal. Rallied abruptly from its 50 DMA line ($27.29) which acted as support. >>> FEATURED STOCK ARTICLE : Near 50-Day Moving Average After Volume-Driven Losses - 10/4/2024 | View all notes | Set NEW NOTE alert | Company Profile | SEC News | Chart | Request a new note | ||||||||
Celestica Elec-Contract Mfg | $75.63 | +3.31 4.58% | $76.28 | 2,842,081 50 DAV is 2,177,000 | $73.18 3.35% | 10/11/2024 | $57.62 | PP = $63.59 |
| MB = $66.77 | ||||||||
G - Hit yet another new all-time high with today''s 3rd consecutive gain backed by +31% above-average volume. Stubbornly holding its ground after noted volume-driven gains. Reported Sep '24 quarterly earnings +60% on +22% sales revenues versus the year-ago period. Fundamentals remain strong. Prior highs in the $63 area define initial support to watch on pullbacks. >>> FEATURED STOCK ARTICLE : Celistica Hits New All-Time High With 8th Straight Gain - 10/11/2024 | View all notes | Set NEW NOTE alert | Company Profile | SEC News | Chart | Request a new note | ||||||||
Paymentus Holdings Finance-CrdtCard/PmtPr | $24.88 | +0.61 2.51% | $24.92 | 128,605 50 DAV is 208,000 | $27.06 -8.06% | 10/17/2024 | $26.15 | PP = $25.31 |
| MB = $26.58 | ||||||||
| Most Recent Note - 11/4/2024 1:34:22 PM Y - Volume totals have been cooling while consolidating. Halted its slide near prior highs in the $25 area. >>> FEATURED STOCK ARTICLE : Paymentus Featured Breaking Out With Volume Driven Gains - 10/17/2024 | View all notes | Set NEW NOTE alert | Company Profile | SEC News | Chart | Request a new note | ||||||||
ResMed Medical-Products | $245.74 | +2.13 0.87% | $246.51 | 950,120 50 DAV is 1,073,000 | $260.49 -5.66% | 10/25/2024 | $256.64 | PP = $255.28 |
| MB = $268.04 | ||||||||
| Most Recent Note - 11/4/2024 1:36:36 PM Y - Consolidating above its 50 DMA line ($242.63) which defines important near-term support to watch. Damaging losses quickly negated the recent breakout. >>> FEATURED STOCK ARTICLE : ResMed Negated Friday''s Breakout Raising Concerns - 10/28/2024 | View all notes | Set NEW NOTE alert | Company Profile | SEC News | Chart | Request a new note | ||||||||
Adtalem Global Education Consumer Svcs-Education | $81.28 | +0.69 0.86% | $82.09 | 311,847 50 DAV is 361,000 | $85.26 -4.67% | 10/30/2024 | $83.34 | PP = $80.28 |
| MB = $84.29 | ||||||||
| Most Recent Note - 11/4/2024 5:11:05 PM Y - Holding its ground above prior highs. It was highlighted in yellow in the 10/30/24 mid-day report with pivot point citer based upon its 7/23/24 high plus 10 cents. It hit new 52-week and all-time highs with a big volume-driven gain triggering a technical buy signal. Bullish action came after it reported Sep ''24 quarterly earnings +39% on +13% sales revenues versus the year ago period, marking its 3rd strong quarterly earnings increase above the +25% minimum guideline (C criteria). Annual earnings growth has been strong. See the latest FSU analysis for more details and a new annotated graph. >>> FEATURED STOCK ARTICLE : Holding Ground Following Recent Technical Breakout - 11/4/2024 | View all notes | Set NEW NOTE alert | Company Profile | SEC News | Chart | Request a new note | ||||||||
| Symbol/Exchange Company Name Industry Group | PRICE | CHANGE | Day High | Volume (% DAV) (% 50 day avg vol) | 52 Wk Hi | Featured Date | Price Featured | Pivot Featured |
| Max Buy | ||||||||
