Fortinet Powered to New All-Time High - Monday, July 10, 2023
Fortinet Inc (FTNT +$3.18 or +4.26% to $77.86) was highlighted in yellow with new pivot point cited based on its 12/29/21 high plus 10 cents in theearlier mid-day report (read here). It hit a new all-time high with today's gain. The strong close above the pivot point was backed by +51% above average volume triggering a proper technical buy signal.
The high-ranked Computer Software - Security firm reported Mar '23 quarterly earnings +79% on +32% sales revenues versus the year-ago period, its 4th strong earnings comparison above the +25% minimum (C criteria). Annual earnings (A criteria) have remained strong since FTNT was last shown in this FSU section on 8/03/20 with an annotated graph under the headline, "Rebounded Above 50-Day Average; Earnings News Due".
The high-ranked Computer Software - Security firm reported Mar '23 quarterly earnings +79% on +32% sales revenues versus the year-ago period, its 4th strong earnings comparison above the +25% minimum (C criteria). Annual earnings (A criteria) have remained strong since FTNT was last shown in this FSU section on 8/03/20 with an annotated graph under the headline, "Rebounded Above 50-Day Average; Earnings News Due".
There are 659.6 million shares in the public float (S criteria). The number of top-rated funds owning its shares rose from 960 in Jun '18 to 2,469 in Jun '23, a reassuring sign concerning the I criteria. Its current Up/Down Volume Ratio of 1.2 is an unbiased indication its shares have been under accumulation over the past 50 days. It has a Timeliness rating of A and Sponsorship rating of C.
Charts courtesy of www.stockcharts.com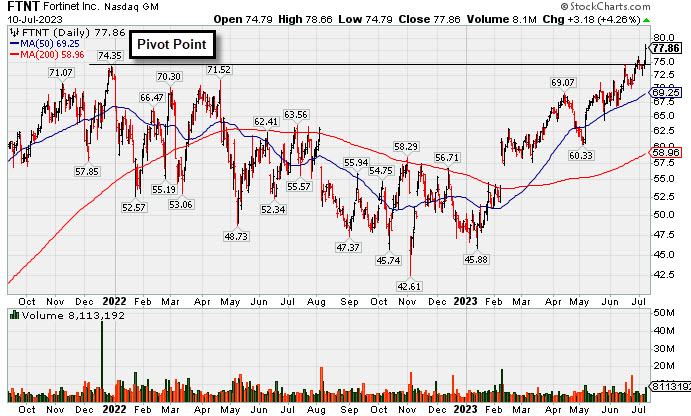
Rebounded Above 50-Day Average; Earnings News Due on - Monday, August 3, 2020
Fortinet Inc (FTNT -$0.08 or -0.06%to $138.22) is due to report earnings news on 8/06/20. Volume and volatility often increase near earnings news. A quiet gain and close back above its 50 DMA line ($136.91) recently helped its outlook to improve following a slump. It still faces some near-term resistance due to overhead supply up to the $151 level. Subsequent gains above the pivot point backed by at least +40% above average volume are needed to trigger a new (or add-on) technical buy signal.
FTNT was last shown in this FSU section on 7/08/20 with an annotated graph under the headline, "Best Ever Close With Volume-Driven Gain Approaching Pivot Point". Bullish action came after reporting earnings +30% on +22% sales revenues for the Mar '20 quarter, its 9th consecutive quarterly comparison with earnings above the +25% minimum guideline (C criteria). Annual earnings (A criteria) have been improving since FY '14, also helping it match with the fact-based investment system's guidelines.
There are 130.9 million shares in the public float (S criteria). The number of top-rated funds owning its shares rose from 960 in Jun '18 to 1,690 in Jun '20, a reassuring sign concerning the I criteria. Its current Up/Down Volume ratio of 1.0 is an unbiased indication its shares have been neutral concerning accumulation/distribution over the past 50 days. It has a Timeliness rating of A and Sponsorship rating of B.
Charts courtesy of www.stockcharts.com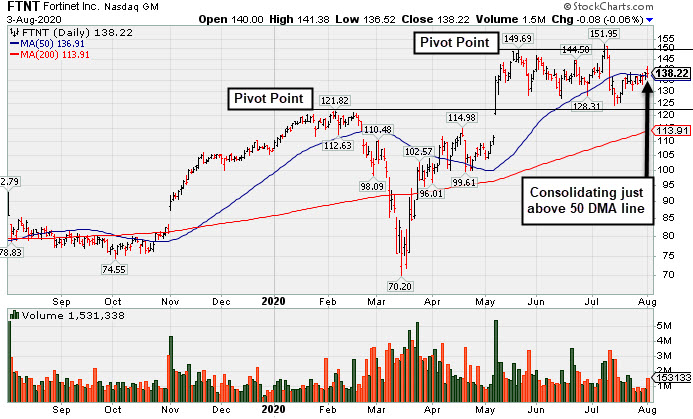
Best Ever Close With Volume-Driven Gain Approaching Pivot Point - Wednesday, July 8, 2020
Fortinet Inc (FTNT +$8.39 or +6.08% to $146.35) posted a solid volume-driven gain for a best ever close today, rising above the recent high and toward its pivot point. It found prompt support at its 50-day moving average (DMA) line ($134.14) and above the prior low ($126.88 on 6/15/20) during the recent consolidation. Subsequent gains above the pivot point backed by at least +40% above average volume are needed to trigger a new (or add-on) technical buy signal.
FTNT was last shown in this FSU section on 6/15/20 with an annotated graph under the headline, "Managed a 'Positive Reversal' After Brief Dip Below 'Max Buy' Level". Bullish action came after reporting earnings +30% on +22% sales revenues for the Mar '20 quarter, its 9th consecutive quarterly comparison with earnings above the +25% minimum guideline (C criteria). Annual earnings (A criteria) have been improving since FY '14, also helping it match with the fact-based investment system's guidelines.
The number of top-rated funds owning its shares rose from 960 in Jun '18 to 1,633 in Jun '20, a reassuring sign concerning the I criteria. Its current Up/Down Volume ratio of 1.4 is an unbiased indication its shares have been neutral concerning accumulation/distribution over the past 50 days. It has a Timeliness rating of A and Sponsorship rating of B.
Charts courtesy of www.stockcharts.com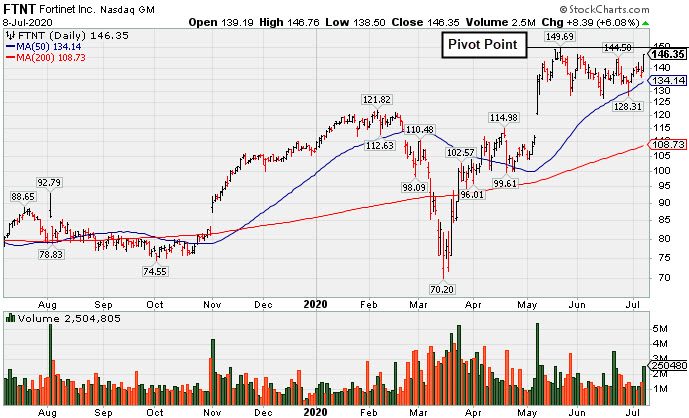
Managed a "Positive Reversal" After Brief Dip Below "Max Buy" Level - Monday, June 15, 2020
Fortinet Inc (FTNT +$5.57 or +4.27% to $135.91) managed a "positive reversal" after briefly undercutting its "max buy" level, posting a solid gain today with higher (+10% above average) volume. It closed -9.2% off its all-time high. Its 50-day moving average (DMA) line ($124.14) and prior highs in the $121 area define important near-term support to watch. FTNT was last shown in this FSU section on 5/22/20 with an annotated graph under the headline, "Extended From Prior Base and Holding Ground Stubbornly".
FTNT finished strong after highlighted in yellow with new pivot point cited based on its 2/06/20 high plus 10 cents in the 5/07/20 mid-day report (read here). Fundamentals remain strong. Bullish action came after reporting earnings +30% on +22% sales revenues for the Mar '20 quarter, its 9th consecutive quarterly comparison with earnings above the +25% minimum guideline (C criteria). Annual earnings (A criteria) have been improving since FY '14, also helping it match with the fact-based investment system's guidelines.
The number of top-rated funds owning its shares rose from 960 in Jun '18 to 1,599 in Mar '20, a reassuring sign concerning the I criteria. Its current Up/Down Volume ratio of 1.4 is an unbiased indication its shares have been neutral concerning accumulation/distribution over the past 50 days. It has a Timeliness rating of A and Sponsorship rating of B.
Charts courtesy of www.stockcharts.com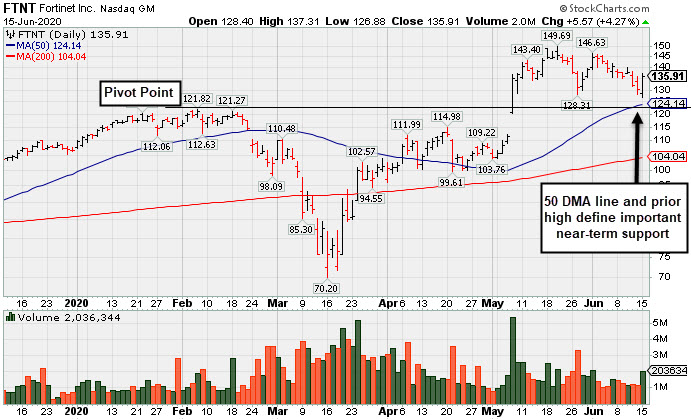
Extended From Prior Base and Holding Ground Stubbornly - Friday, May 22, 2020
Fortinet Inc (FTNT -$0.74 or -0.52% to $142.64) remains perched near its all-time high, extended from the prior base. Prior highs in the $121 area define initial support to watch on pullbacks.
FTNT finished strong after highlighted in yellow with new pivot point cited based on its 2/06/20 high plus 10 cents in the 5/07/20 mid-day report (read here). Fundamentals remain strong. Bullish action came after reporting earnings +30% on +22% sales revenues for the Mar '20 quarter, its 9th consecutive quarterly comparison with earnings above the +25% minimum guideline (C criteria). Annual earnings (A criteria) have been improving since FY '14, also helping it match with the fact-based investment system's guidelines.
FTNT was last shown in this FSU section on 5/07/20 with an annotated graph under the headline, "Gap Up and Big Volume-Driven Gain for Computer Security Firm". It rebounded impressively after slumping well below its 200 DMA line since dropped from the Featured Stocks list on 3/09/20.
The number of top-rated funds owning its shares rose from 960 in Jun '18 to 1,559 in Mar '20, a reassuring sign concerning the I criteria. Its current Up/Down Volume ratio of 1.6 is an unbiased indication its shares have been neutral concerning accumulation/distribution over the past 50 days. It has a Timeliness rating of A and Sponsorship rating of B.
Charts courtesy of www.stockcharts.com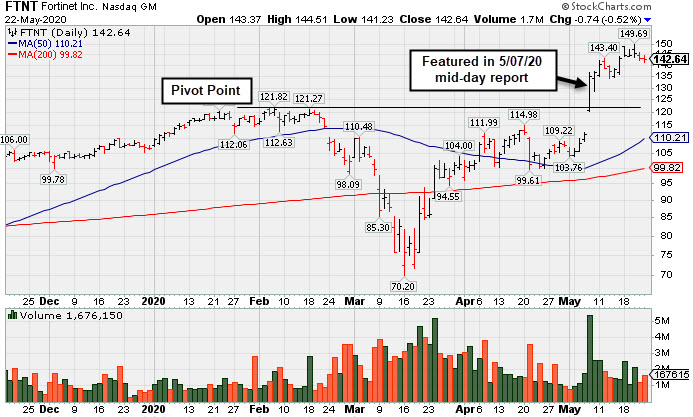
Gap Up and Big Volume-Driven Gain for Computer Security Firm - Thursday, May 7, 2020
Fortinet Inc (FTNT +$23.66 or +21.23% to $135.12) finished strong after highlighted in yellow with new pivot point cited based on its 2/06/20 high plus 10 cents in the earlier mid-day report (read here). Fundamentals remain strong. Bullish action came after reporting earnings +30% on +22% sales revenues for the Mar '20 quarter, its 9th consecutive quarterly comparison with earnings above the +25% minimum guideline (C criteria). Annual earnings (A criteria) have been improving since FY '14, also helping it match with the fact-based investment system's guidelines.
It hit a new all-time high with today's big "breakaway gap" and considerable gain backed by above average volume triggering a technical buy signal. A "breakaway gap" is the one exception to the rule where a stock may be bought more than +5% above the prior high, however, the further above the prior high any stock is purchased the greater the risk increases of being stopped out on an ordinary pullback. Disciplined investors always limit losses by selling any stocks that fall more than -7-8% from their purchase price.
FTNT was last shown in this FSU section on 2/26/20 with an annotated graph under the headline, "Volume Driven Losses Violated 50-Day Moving Average". It rebounded impressively after slumping well below its 200 DMA line since dropped from the Featured Stocks list on 3/09/20.
The number of top-rated funds owning its shares rose from 960 in Jun '18 to 1,574 in Mar '20, a reassuring sign concerning the I criteria. Its current Up/Down Volume ratio of 1.0 is an unbiased indication its shares have been neutral concerning accumulation/distribution over the past 50 days. It has a Timeliness rating of A and Sponsorship rating of B.
Charts courtesy of www.stockcharts.com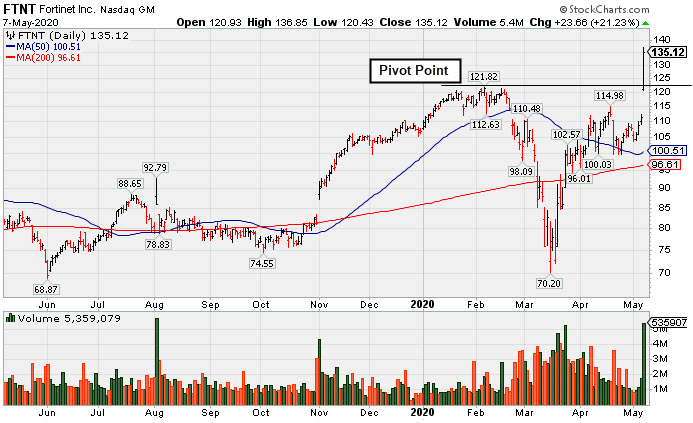
Volume Driven Losses Violated 50-Day Moving Average - Wednesday, February 26, 2020
Fortinet Inc (FTNT +$1.21 or +1.15% to $106.26) halted its slide today after violating the 50-day moving average (DMA) line ($113.92) and prior low ($112.06) with big losses on higher volume triggering technical sell signals. It may find support near the prior pivot point, however, a rebound above the 50 DMA line is needed for its outlook to improve.
Fundamentals remain strong. It reported earnings +29% on +21% sales revenues for the Dec '19 quarter, its 8th consecutive quarterly comparison with earnings above the +25% minimum guideline (C criteria). Annual earnings (A criteria) have been improving since FY '14, also helping it match with the fact-based investment system's guidelines.
FTNT was highlighted in yellow with new pivot point cited based on its 4/16/19 high plus 10 cents in the 11/11/19 mid-day report (read here). It was last shown in this FSU section on 2/04/20 with an annotated graph under the headline, "Fortinet Posted Gain for Best-Ever Close".
The number of top-rated funds owning its shares rose from 960 in Jun '18 to 1,553 in Dec '19, a reassuring sign concerning the I criteria. Its current Up/Down Volume ratio of 1.2 is an unbiased indication its shares have been under accumulation over the past 50 days. It has a Timeliness rating of A and Sponsorship rating of B.
Charts courtesy of www.stockcharts.com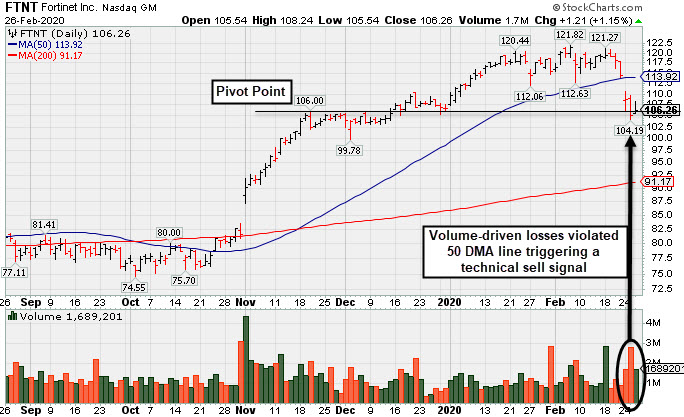
Fortinet Posted Gain for Best-Ever Close - Tuesday, February 4, 2020
Fortinet Inc (FTNT+$3.59 or +3.08% to $120.08) posted a gain with near average volume today for a best-ever close. It is very extended from any sound base. Its 50-day moving average (DMA) line ($110.35) defines important near-term support to watch. It wedged higher with recent gains lacking great volume conviction.
Keep in mind it is due to report earnings news after the close on Thursday 2/06/20. Volume and volatility often increase near earnings news. It reported earnings +37% on +21% sales revenues for the Sep '19 quarter versus the year ago period, its 7th consecutive quarterly comparison with earnings above the +25% minimum guideline (C criteria). Annual earnings (A criteria) have been improving since FY '14, also helping it match with the fact-based investment system's guidelines.
FTNT was highlighted in yellow with new pivot point cited based on its 4/16/19 high plus 10 cents in the 11/11/19 mid-day report (read here). It was last shown in this FSU section on 1/14/20 with an annotated graph under the headline, "Extended From Base After Wedging Higher".
The number of top-rated funds owning its shares rose from 960 in Jun '18 to 1,541 in Dec '19, a reassuring sign concerning the I criteria. Its current Up/Down Volume ratio of 1.2 is an unbiased indication its shares have been under accumulation over the past 50 days. It has a Timeliness rating of A and Sponsorship rating of B.
Charts courtesy of www.stockcharts.com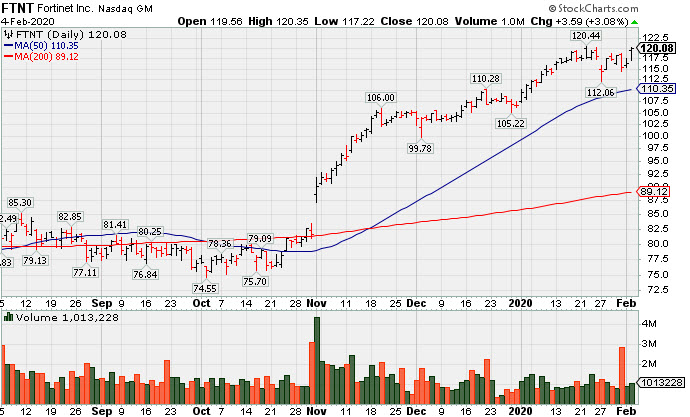
Extended From Base After Wedging Higher - Tuesday, January 14, 2020
Fortinet Inc (FTNT +$0.03 or +0.03% to $116.72) hit yet another new 52-week high with below average volume behind today's gain, getting very extended from any sound base. Its 50-day moving average (DMA) line ($104.75) defines important near-term support to watch. It has wedged higher with recent gains lacking great volume conviction.
Bullish action came after it reported earnings +37% on +21% sales revenues for the Sep '19 quarter versus the year ago period, its 7th consecutive quarterly comparison with earnings above the +25% minimum guideline (C criteria). Annual earnings (A criteria) have been improving since FY '14, also helping it match with the fact-based investment system's guidelines.
FTNT was highlighted in yellow with new pivot point cited based on its 4/16/19 high plus 10 cents in the 11/11/19 mid-day report (read here), It was last shown in this FSU section on 12/23/19 with an annotated graph under the headline, "Endured Distributional Pressure While Perched at High".
The number of top-rated funds owning its shares rose from 960 in Jun '18 to 1,521 in Dec '19, a reassuring sign concerning the I criteria. Its current Up/Down Volume ratio of 1.6 is an unbiased indication its shares have been under accumulation over the past 50 days. It has a Timeliness rating of A and Sponsorship rating of B.
Charts courtesy of www.stockcharts.com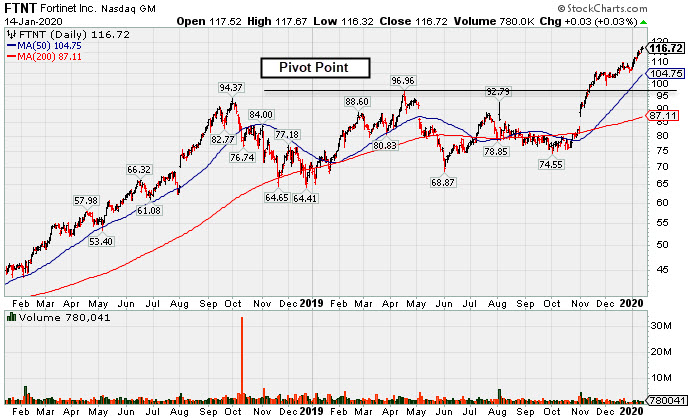
Endured Distributional Pressure While Perched at High - Monday, December 23, 2019
Fortinet Inc (FTNT +$0.90 or +0.84% to $107.82) posted a small gain on light volume. There was a "negative reversal" for a loss with heavier volume after hitting another new 52-week high on the prior session. It had wedged higher with gains lacking great volume conviction after highlighted in yellow with pivot point cited based on its 11/20/19 high plus 10 cents. The prior high in the $97 area defines initial support to watch on pullbacks.
Bullish action came after it reported earnings +37% on +21% sales revenues for the Sep '19 quarter versus the year ago period, its 7th consecutive quarterly comparison with earnings above the +25% minimum guideline (C criteria). Annual earnings (A criteria) have been improving since FY '14, also helping it match with the fact-based investment system's guidelines.
FTNT was highlighted in yellow with new pivot point cited based on its 4/16/19 high plus 10 cents in the 11/11/19 mid-day report (read here), It was last shown in this FSU section on 12/02/19 with an annotated graph under the headline, "Extended From Prior Base Perched Near Record High".
The number of top-rated funds owning its shares rose from 960 in Jun '18 to 1,533 in Sep '19, a reassuring sign concerning the I criteria. Its current Up/Down Volume ratio of 1.5 is an unbiased indication its shares have been under accumulation over the past 50 days. It has a Timeliness rating of A and Sponsorship rating of B.
Charts courtesy of www.stockcharts.com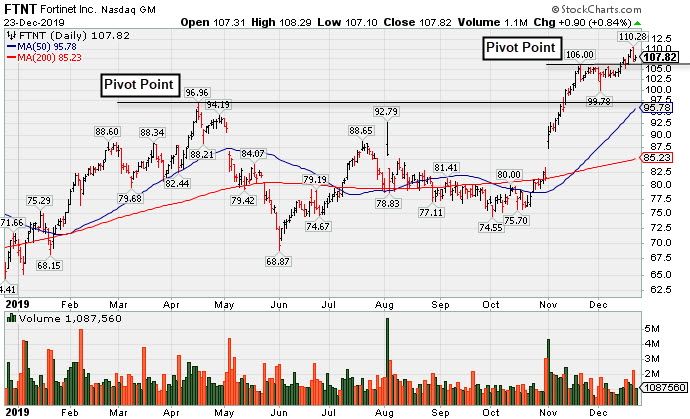
Extended From Prior Base Perched Near Record HIgh - Monday, December 2, 2019
Fortinet Inc (FTNT -$1.19 or -1.13% to $103.92) has been stubbornly holding its ground after getting extended from the prior base. Prior highs in the $97 area defines initial support to watch on pullbacks.
FTNT gapped up on 11/01/19 helping its outlook to improve. Bullish action came after it reported earnings +37% on +21% sales revenues for the Sep '19 quarter versus the year ago period, its 7th consecutive quarterly comparison with earnings above the +25% minimum guideline (C criteria). Annual earnings (A criteria) have been improving since FY '14, also helping it match with the fact-based investment system's guidelines.
It was highlighted in yellow with new pivot point cited based on its 4/16/19 high plus 10 cents in the 11/11/19 mid-day report (read here), It was last shown in this FSU section that evening with an annotated graph under the headline, "Reversed Into Red Today After Touching New High".
The number of top-rated funds owning its shares rose from 960 in Jun '18 to 1,554 in Sep '19, a reassuring sign concerning the I criteria. Its current Up/Down Volume ratio of 1.7 is an unbiased indication its shares have been under accumulation over the past 50 days. It has a Timeliness rating of A and Sponsorship rating of B.
Charts courtesy of www.stockcharts.com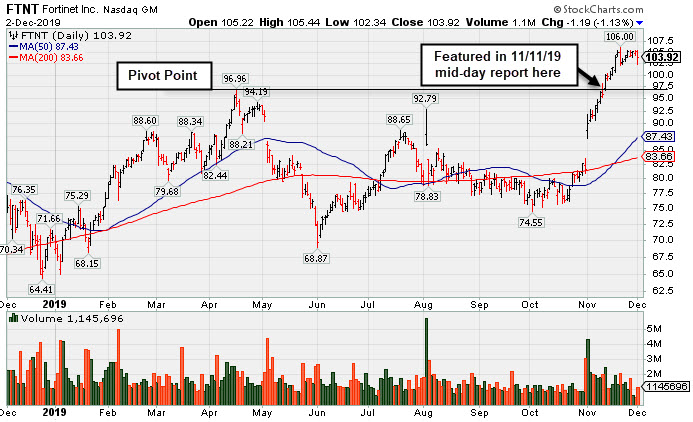
Reversed Into Red Today After Touching New High - Monday, November 11, 2019
Fortinet Inc (FTNT -$0.28 or -0.29% to $95.95) finished lower after highlighted in yellow with new pivot point cited based on its 4/16/19 high plus 10 cents in the earlier mid-day report (read here). There was a "negative reversal" after hitting a new all-time high today, breaking a streak of 3 consecutive volume-driven gains. Subsequent gains and a strong close above the pivot point backed by at least +40% above average volume is needed to trigger a proper new (or add-on) technical buy signal.
FTNT gapped up on 11/01/19 helping its outlook to improve. Bullish action came after it reported earnings +37% on +21% sales revenues for the Sep '19 quarter versus the year ago period, its 7th consecutive quarterly comparison with earnings above the +25% minimum guideline (C criteria). It was last shown in this FSU section on 4/10/19 with an annotated graph under the headline, "Volume-Driven Gain Cleared Flat Base and Little Resistance Remains". It was dropped from the Featured Stocks list on 5/13/19 due to weak technical action, however, its fundamentals remained strong. Annual earnings (A criteria) have been improving since FY '14, also helping it match with the fact-based investment system's guidelines.
The number of top-rated funds owning its shares rose from 960 in Jun '18 to 1,557 in Sep '19, a reassuring sign concerning the I criteria. Its current Up/Down Volume ratio of 1.4 is an unbiased indication its shares have been under accumulation over the past 50 days. It has a Timeliness rating of A and Sponsorship rating of B.
Charts courtesy of www.stockcharts.com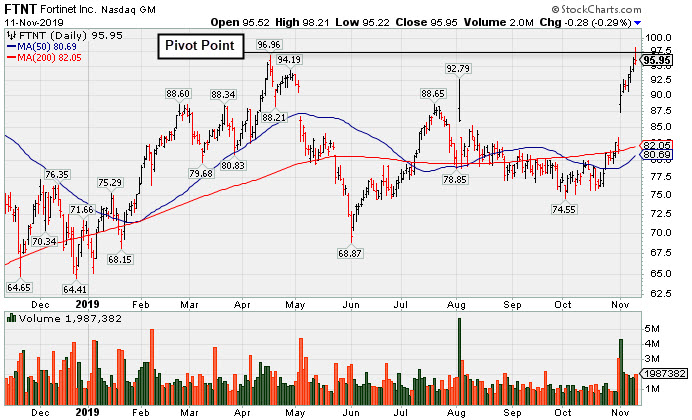
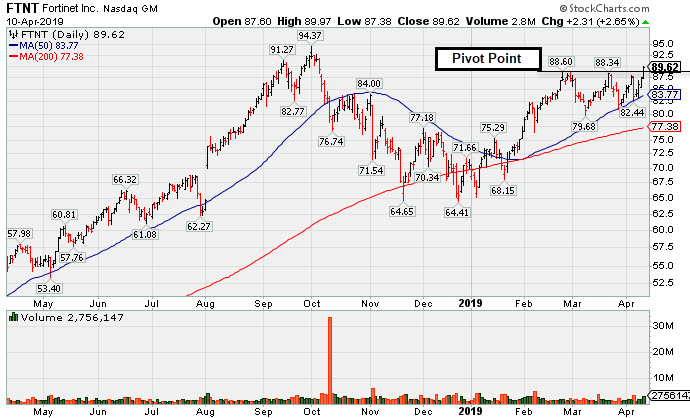
Volume-Driven Gain Cleared Flat Base and Little Resistance Remains - Wednesday, April 10, 2019
Fortinet Inc (FTNT +$2.31 or +2.65% to $89.62) finished strong after highlighted in yellow with pivot point cited based on its 2/25/19 high plus 10 cents in the earlier mid-day report (read here) . Today's gain backed by +56% above average volume helped it break out from a flat base during which its 50-day moving average (DMA) line ($83.77) acted as support. It still faces a little resistance due to overhead supply up to the $94 level.
Recently it reported Dec '18 earnings +84% on +22% sales revenues, its 4th consecutive quarterly comparison with earnings above the +25% minimum guideline (C criteria). Annual earnings (A criteria) have been improving since FY '14, also helping it better match with the fact-based investment system's guidelines.
The number of top-rated funds owning its shares rose from 960 in Jun '18 to 1,323 in Mar '19, a reassuring sign concerning the I criteria. Its current Up/Down Volume ratio of 1.3 is an unbiased indication its shares have been under accumulation over the past 50 days. It has a Timeliness rating of A and Sponsorship rating of B.
Charts courtesy of www.stockcharts.com