Triple Average Volume Behind Breakout Today - Monday, February 28, 2011
Leading stocks setting up and breaking of solid bases have often been highlighted in the CANSLIM.net Mid-Day Breakouts Report. The most relevant factors are briefly noted in the report including the pivot point and max buy level. More detailed analysis is published soon after a stock's initial appearance in yellow as these new candidates are added to the Featured Stocks list. Letter-by-letter details concerning strengths or shortcomings of the company in respect to key fundamental criteria of the investment system appear along with annotated datagraphs highlighting technical chart patterns in the Featured Stock Update (FSU) section included in the CANSLIM.net After Market Update each day.
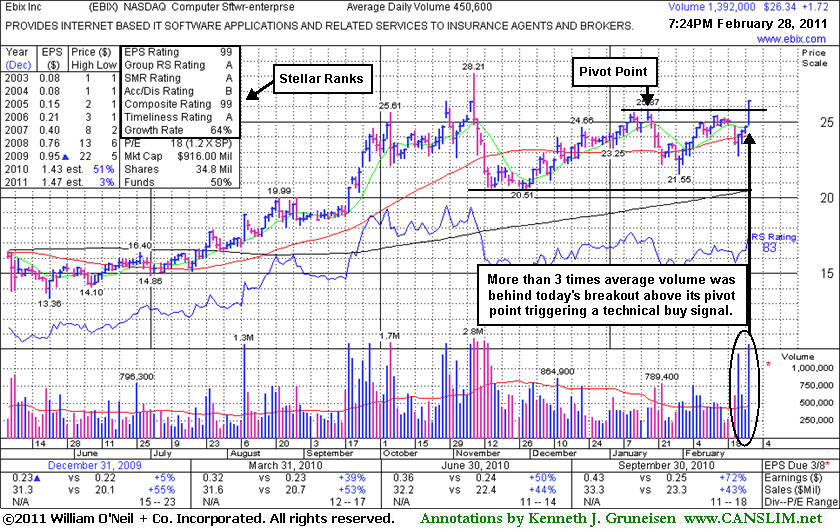
Ebix Inc (EBIX +$1.72 or +6.99% to $26.34) finished the session with more than 3 times average volume while closing near the day's high well above its pivot point, triggering a technical buy signal. Today's 4th consecutive gain helped it trade above its January high after a choppy new 6-week flat base. In the mid-day report today its color code was changed to yellow with new pivot point cited based on its 1/18/11 high plus ten cents as it was noted - "Little resistance remains due to overhead supply. Since dropped from the Featured Stocks list on 11/16/10 the prior resistance previously noted in the $20 area acted as support and its fundamentals have remained strong."
It has the highest possible Earnings Per Share rank of 99, and a Relative Strength rank of 83. Recent quarterly sales revenues and earnings increases have been strong, satisfying the C criteria. Return on Equity of 30% is solidly above the +17% guideline. Its Up/Down Volume Ratio is currently 1.4, an unbiased indication of the recent accumulation, and the number of top-rated funds owning its shares increased from 227 in June '10 to 246 in Dec '10, a reassuring sign concerning the I criteria. Technically, the spike higher today led to its best ever close.
Big Weekly Gain And Breakout For High-Ranked Computer Software Firm - Friday, September 24, 2010
In recent weeks an increasing number of leading stocks setting up and breaking of solid bases have been highlighted in the CANSLIM.net Mid-Day Breakouts Report. The most relevant factors are briefly noted in the report which allows disciplined investors to place the issue in their custom watch list and receive subsequent notes directly via email immediately when they are published (click the "Alert me of new notes" link). More detailed analysis is published soon after a stock's initial appearance in yellow once any new candidates are added to the Featured Stocks list. Letter-by-letter details concerning strengths or shortcomings of the company in respect to key fundamental criteria of the investment system appear along with annotated datagraphs highlighting technical chart patterns in the Featured Stock Update (FSU) section included in the CANSLIM.net After Market Update each day.
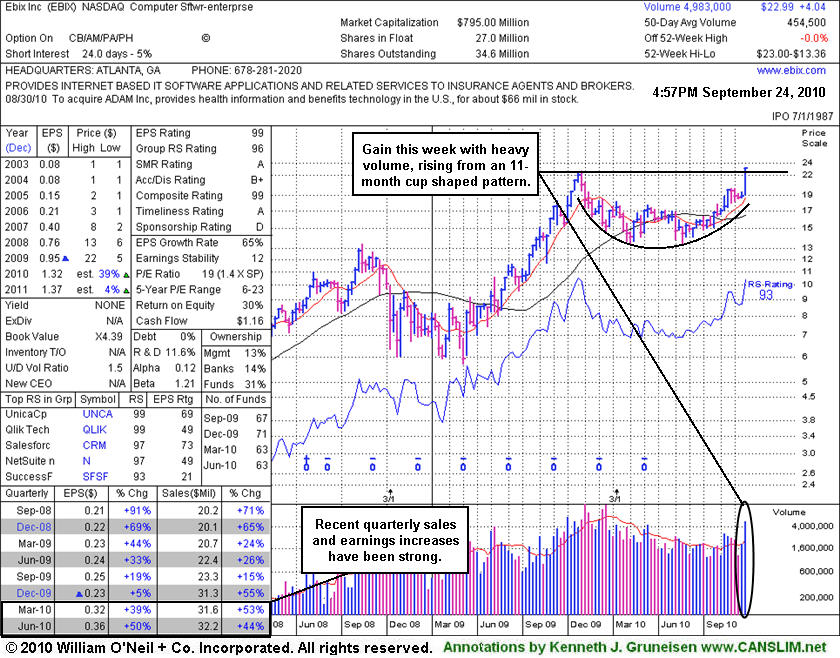
Ebix Inc (EBIX +$1.36 or +6.28% to $23.00) gapped up today and rose above its pivot point with volume more than +150% above average. It has closed strong on the prior session after it was featured in yellow in the 9/23/10 mid-day report (read here) and noted - "It may encounter resistance near its old high and form a handle after its recent rally. It has formed a large cup shaped pattern in the past year, maintaining strong fundamentals since it was dropped from the Featured Stocks list on 11/05/09."
It has the highest possible Earnings Per Share rank of 99, and a Relative Strength rank of 93. Recent quarterly sales revenues and earnings increases have been strong. Return on Equity of 30% is solidly above the +17% guideline. Its Up/Down Volume Ratio is currently 1.5, a clear and unbiased indication of the bullish bias to its recent trading. It did not form a right side to its cup after reaching its old high, where it is considered most ideal for a handle to form. Technically, the spike into new all-time high territory with heavy volume, and the greater number of up weeks with above average volume versus down weeks on volume, are bullish indications on its weeks chart below.
50 DMA and Prior Chart Highs Coincide Near $54 As Next Support Level - Monday, November 02, 2009
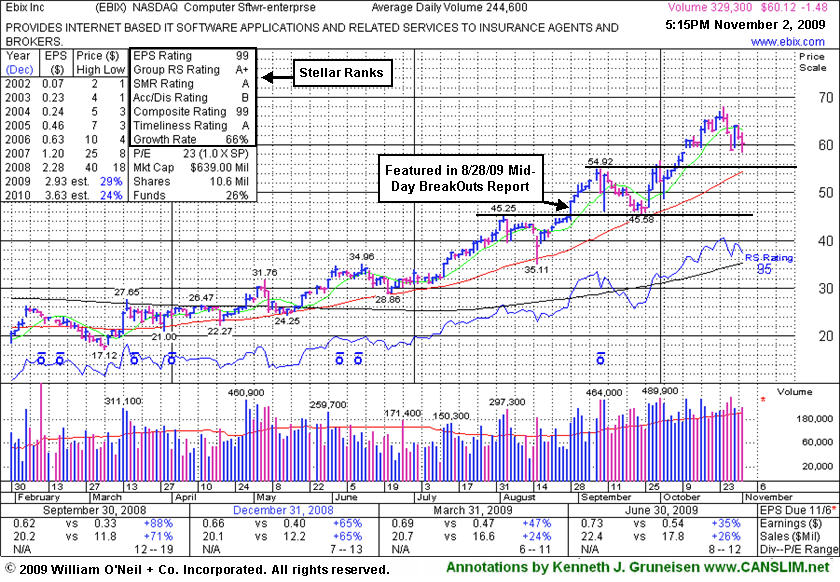
Ebix Inc (EBIX -$1.48 or -2.46% to $60.12) ended lower today on slightly higher volume, continuing its consolidation that began with the previously noted negative reversal from all-time highs on 10/26/09, followed by more worrisome distributional pressure. It is still well above prior chart highs and its 50-day moving average (DMA) line coinciding in the $54 area, the next important support level to watch. Since its last appearance on 10/13/09 under the headline "Computer Software Firm Is Extended From Latest Base it went on rallying to get even more extended, trading as much as +48% above its price when featured at $45.86 in yellow in the 8/28/09 CANSLIM.net Mid-Day BreakOuts Report (read here) as it was reaching a new all-time high. Prior to that, it formed the big cup-with-high-handle shaped pattern (finding great support at its 50 DMA line) since weak action prompted it to be dropped from the Featured Stocks list on 10/07/08. As shown in the annotated graph below, earnings increases in quarterly comparisons have been strong and above the +25% guideline, but previously noted earnings deceleration is of some concern. It is preferred when earnings growth is strong and accelerating, not losing steam.
EBIX had traded up more than +59% after it was first featured in the March 2008 CANSLIM.net News (read here). At that time its average daily volume was only 4,900 shares, whereas today its average volume is at 244,600 shares. Today there are 10.6 million shares (the S criteria) in the public float, so its share price still could be very volatile in the event of heavy institutional buying or selling. The number of top-rated funds owning an interest in its shares rose from 31 in Dec '08 to 58 in Jun '09, which is a good sign concerning the I criteria of the investment system. Return on Equity is now reported at +42%, well above the +17% guideline. Do not be confused by the 3:1 split that took effect on 10/09/08.
Computer Software Firm Is Extended From Latest Base - Tuesday, October 13, 2009
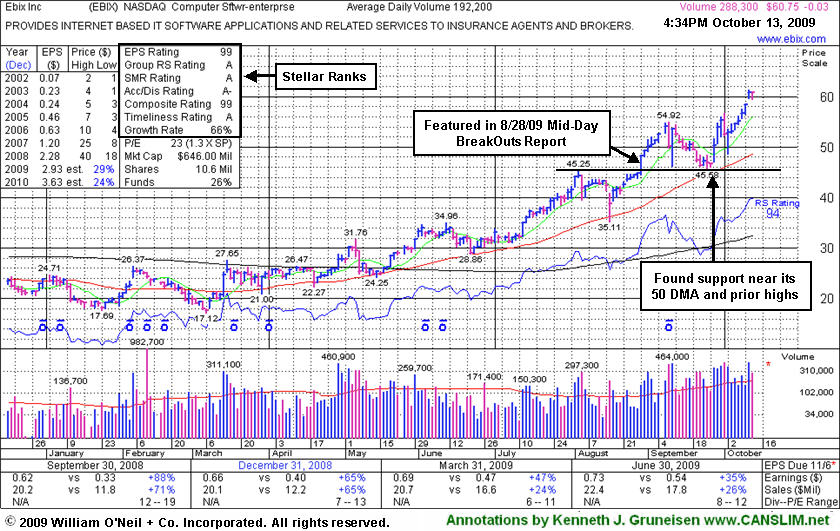
Ebix Inc (EBIX +$0.02 or +0.03% to $60.80) held its ground today after a gap up gain on 10/12/09 for a new all-time high. It is very extended from any sound base and well above support at its 50-day moving average (DMA) line, and more than +84% above its 200 DMA line, which are reminders to be watchful for sell signals. It endured some distributional pressure in September but found support at prior chart highs and its 50 DMA line in the $45 area. EBIX has rallied as much as +33.5% since featured in yellow in the 8/28/09 CANSLIM.net Mid-Day BreakOuts Report (read here) as it was reaching a new all-time high. Prior to that, it formed the big cup-with-high-handle shaped pattern (finding great support at its 50 DMA line) since weak action prompted it to be dropped from the Featured Stocks list on 10/07/08. As shown in the annotated graph below, earnings increases in quarterly comparisons have been strong and above the +25% guideline, but previously noted earnings deceleration is of some concern. It is preferred when earnings growth is strong and accelerating, not losing steam.
EBIX had traded up more than +59% after it was first featured in the March 2008 CANSLIM.net News (read here). At that time its average daily volume was only 4,900 shares, whereas today its average volume is at 192,200 shares. Today there are 10.6 million shares (the S criteria) in the public float, so its share price still could be very volatile in the event of heavy institutional buying or selling. The number of top-rated funds owning an interest in its shares rose from 31 in Dec '08 to 58 in Jun '09, which is a good sign concerning the I criteria of the investment system. Return on Equity is now reported at +42%, well above the +17% guideline. Do not be confused by the 3:1 split that took effect on 10/09/08.
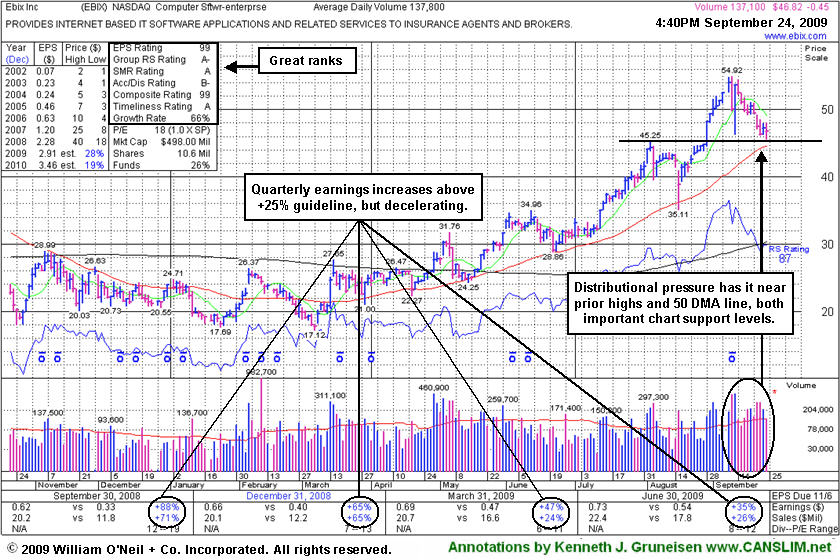
Prior Highs and 50 DMA Are Important Support Now - Thursday, September 24, 2009
Ebix Inc (EBIX -$0.45 or -0.96% to $46.82) has shown recent weakness indicative of distributional pressure while consolidating toward important support at prior chart highs and its 50-day moving average (DMA) line in the $44-45 area. It has struggled since another wild whipsaw-like shakeout briefly tested support, much like its shakeout in mid-August nearly tested prior chart highs. As shown in the annotated graph below, earnings increases in quarterly comparisons have been strong and above the +25% guideline, but previously noted "steady sequential deceleration" is of some concern. It is preferred when earnings growth is strong and accelerating, not losing steam.
Volatility like we have recently seen serves as a reminder for investors to always make disciplined buys and sells! EBIX rallied as much as +19.76% since featured in yellow in the 8/28/09 CANSLIM.net Mid-Day BreakOuts Report (read here) as it was reaching a new all-time high. It has erases most of its gains since a technical buy signal was triggered with a considerable gain backed by volume +81.94% above average as it cleared a cup-with-high-handle pattern after "3-weeks tight". It formed the big cup-with-high-handle shaped pattern (finding great support at its 50 DMA line) since weak action prompted it to be dropped from the Featured Stocks list on 10/07/08.
EBIX traded up more than +59% after it was first featured in the March 2008 CANSLIM.net News (read here). At that time its average daily volume was only 4,900 shares, whereas today its average volume is at 137,800 shares. Today there are 8.09 million shares (the S criteria) in the public float, so its share price still could be very volatile in the event of heavy institutional buying or selling. The number of top-rated funds owning an interest in its shares rose from 31 in Dec '08 to 59 in Jun '09, which is a good sign concerning the I criteria of the investment system. Return on Equity is now reported at +42%, well above the +17% guideline. Do not be confused by the 3:1 split that took effect on 10/09/08. It has rebounded impressively and cleared its August '08 high (the $40 area) in July, after steadily climbing from this year's lows in the $17 range.
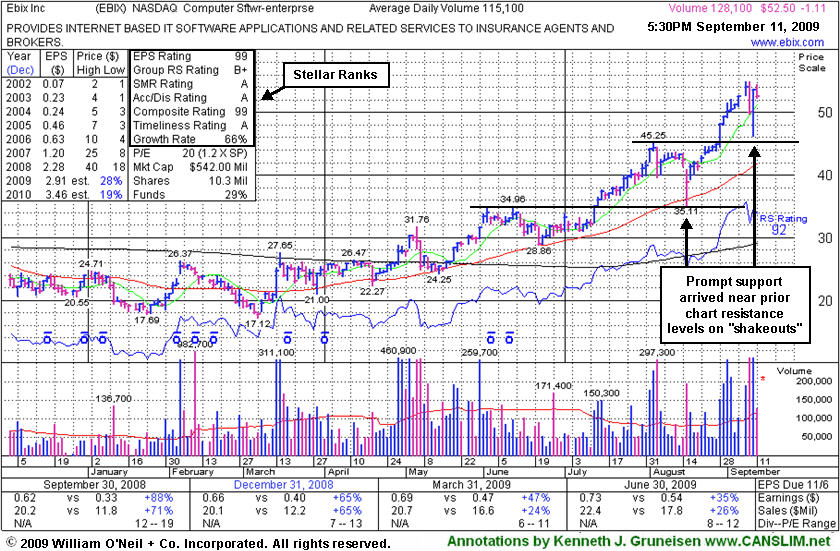
Whipsaw Pullbacks Found Prompt Support Near Prior Resistance - Friday, September 11, 2009
Ebix Inc (EBIX -$1.11 or -2.11% to $52.50) has held its ground reasonably well after another wild whipsaw-like shakeout briefly tested support, like its shakeout in mid-August that nearly tested prior chart highs. On the prior 2 sessions it dove as low as $46.25, briefly trading under its $47.62 "max buy" level, and it positively reversed for a big gain on 4 times average volume. Now it is too extended from an ideal buy point within the investment system guidelines. Sales and earnings increases in quarterly comparisons have been strong, but they have shown steady sequential deceleration which is of some concern. EBIX has a small supply of only 6.62 million shares in the float, which has been previously noted as a reason one might expect great volatility.
Volatility like we have recently seen serves as a reminder for investors to always make disciplined buys and sells! Now EBIX rallied as much as +19.76% since featured in yellow in the 8/28/09 CANSLIM.net Mid-Day BreakOuts Report (read here) as it was reaching a new all-time high. A technical buy signal was triggered with a considerable gain backed by volume +81.94% above average as it cleared a cup-with-high-handle pattern after "3-weeks tight". It formed the big cup-with-high-handle shaped pattern (finding great support at its 50 DMA line) since weak action prompted it to be dropped from the Featured Stocks list on 10/07/08.
EBIX traded up more than +59% after it was first featured in the March 2008 CANSLIM.net News (read here). At that time its 50-day average daily volume was only 4,900 shares, whereas today its average volume is at 115,000 shares. Today there are 6.62 million shares (the S criteria) in the public float, so its share price still could be very volatile in the event of heavy institutional buying or selling. The number of top-rated funds owning an interest in its shares rose from 31 in Dec '08 to 55 in Jun '09, which is a good sign concerning the I criteria of the investment system. Do not be confused by the 3:1 split that took effect on 10/09/08. It has rebounded impressively and cleared its August '08 highs in the $40 area recently, after steadily climbing from this year's lows in the $17 range.
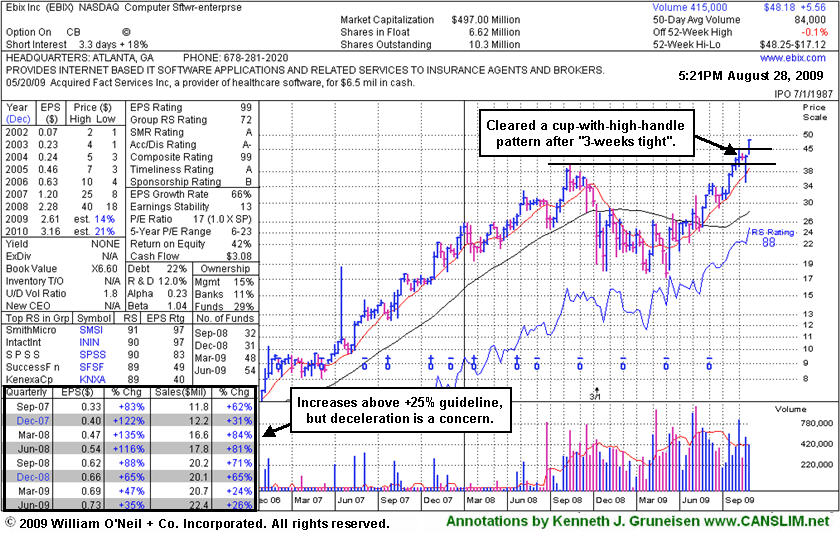
Software Firm Ended Strong After Mid-Day Report Appearance - Friday, August 28, 2009
Ebix Inc (EBIX +$3.36 or +6.97% to $48.18) was highlighted in yellow with new pivot point and max buy levels noted in the 8/28/09 CANSLIM.net Mid-Day BreakOuts Report today (read here) as it was reaching a new all-time high. It triggered a technical buy signal and closed the session near its intra-day high with a considerable gain backed by volume +81.94% above average as it cleared a cup-with-high-handle pattern after "3-weeks tight". It formed the big cup-with-high-handle shaped pattern (finding great support at its 50 DMA line) since weak action prompted it to be dropped from the Featured Stocks list on 10/07/08. Sales and earnings increases in quarterly comparisons have been strong, but they have shown steady sequential deceleration which is of some concern.
EBIX traded up more than +59% after it was first featured in the March 2008 CANSLIM.net News (read here). At that time its 50-day average daily volume was only 4,900 shares, whereas today its average volume is at 84,000 shares. Today there are 6.62 million shares (the S criteria) in the public float, so its share price still could be very volatile in the event of heavy institutional buying or selling. The number of top-rated funds owning an interest in its shares rose from 31 in Dec '08 to 54 in Jun '09, which is a good sign concerning the I criteria of the investment system. Do not be confused by the 3:1 split that took effect on 10/09/08. It has rebounded impressively and cleared its August '08 highs in the $40 area recently, after steadily climbing from this year's lows in the $17 range.
Another Look At Late Stage Action - Tuesday, October 07, 2008
An important point for prudent investors to remain cognizant of is that a strong stock normally builds several bases before it eventually tops out. Needless to say, earlier stage bases are less risky than their later stage counterparts. A general rule that is derived from studying leading stocks over the course of the past several decades is that if volume swells as the stock advances then odds favor that further price appreciation is likely. However, the converse is also true, and a lack of volume behind gains gives investors another reason to question a stock's ability to make a sustained advance in price.
Ebix Inc (EBIX -$3.51 or -4.52% to $81.10) suffered another loss today, and it has violated its 200-day moving average (DMA) line and upward trendline, triggering technical sell signals. This stock had gone on to trade up as much as +59% higher after first featured at $76.00 in the March 2008 issue of CANSLIM.net News (read here). Initially it slumped, but it found support near its 50 DMA, then later triggered a technical buy signal on 4/22/08 and was noted in that evening's CANSLIM.net After Market Update as follows - "Considerable gain today in the final hour of the session helped it rise above its pivot point with volume more than triple its average daily trading total, triggering a proper technical buy signal." Its color code was soon changed to green after it got extended from an ideal buy level. Then, in June, its color code was changed to yellow again with new pivot point and max buy levels noted while it was consolidating in an orderly fashion. But it soon violated its 50 DMA line, and in July it fell near its prior chart highs before finding support. Later in July, it went on a winning streak, repairing the damage and eventually breaking out of its late stage base.
EBIX last appeared in the Featured Stock Update section of the 8/22/08 CANSLIM.net After Market Update with analysis with an annotated graph under the headline "Late-Stage Leader Endured Distribution While Basing Again". Sell signals were later triggered by its 9/17/08 violations of prior chart highs in the $99 area and its 50 DMA line. Recent damage has pressured it near prior chart lows (July) and its Accumulation/Distribution rank has slumped to a D- after losses with above average volume. It is now -32.9% off its 52-week high, and based on weak action it will be dropped from the Featured Stocks list tonight.
C A N S L I M | StockTalk | News | Chart | SEC | Zacks Reports | ![]()
![]()
![]()
View all notes | Alert me of new notes | CANSLIM.net Company Profile
Late-Stage Leader Endured Distribution While Basing Again - Friday, August 22, 2008
An important point for prudent investors to remain cognizant of is that a strong stock normally builds several bases before it eventually tops out. Needless to say, earlier stage bases are less risky than their later stage counterparts. A general rule that is derived from studying leading stocks over the course of the past several decades is that if volume swells as the stock advances then odds favor that further price appreciation is likely. However, the converse is also true, and a lack of volume behind gains gives investors another reason to question a stock's ability to make a sustained advance in price.
Ebix, Inc. (EBIX Unchanged or +0.00% to $104.00) has been consolidating above support at prior chart highs in the $99-100 area - previously noted as "an important support level to watch." It has recently encountered distributional pressure, and its Accumulation/Distribution rating is currently a disappointing D+. It has also held up impressively above its prior chart highs thus far, and its Up/Down Volume Ratio of 1.8 currently gives an otherwise bullish indication with respect to the recent 50-day period's overall activity. There are also some signs that the stock is becoming more popular among institutional investors (the I criteria). The number of top-rated funds owning an interest in its shares rose from 9 in Sept '07 to 16 in Jun '08. And since it was featured in March 2008, its average daily volume total has increased from about 5,000 shares to 20,000 shares.
Watch out for deterioration into its prior base, which would raise concerns and trigger technical sell signals. Meanwhile, in the weeks that follow, EBIX may form another base-on-base pattern and eventually break out again. But it is important to keep in mind the impressive 10-fold run the stock has enjoyed from its 2006 lows, which makes the present base building activity arguably "late-stage", and thus riskier. There were already a couple of clear buy signals triggered this year, and this high-ranked Computer Software - Enterprise firm has traded up as much as +59% since first featured in the March 2008 issue of CANSLIM.net News (read here).
C A N S L I M | StockTalk | News | Chart | SEC | Zacks Reports | ![]()
![]()
![]()
View all notes | Alert me of new notes | CANSLIM.net Company Profile
Consolidation Continues in Tight Range Above 50 DMA Line - Tuesday, June 17, 2008
A very important technical tool that savvy investors have learned to incorporate in their technical analysis is the 50-day moving average (DMA) line. The 50 DMA line plays a pivotal role relative to a stock's price. If the price of a stock is above its 50 DMA then odds are that its 50 DMA will act as formidable support. Conversely, if the price is below its 50 DMA then the moving average acts as resistance. Healthy stocks sometimes trade under their 50 DMA lines briefly, but usually a strong candidate will promptly bounce and repair a 50 DMA violation. When a stock has violated its 50 DMA line and then lingers beneath it, the stock's outlook gets worse and worse as it spends a greater period of time trading under that important short-term average line. Once the 50 DMA line starts sloping downward it should also be acknowledged that the stock has been struggling for a while, and it might be time to reduce exposure and look for places to put that money to work in stronger buy candidates.Ebix Inc. (EBIX +$0.78 or +0.86% to $91.69) continued consolidating above its 50 DMA line on quiet volume, building on an orderly 6-week flat base. A 50 DMA breach would raise concerns and trigger a technical sell signal, and then its prior chart highs in the $77-78 are its next important support level to watch. Since first featured the stock traded up as much as +30%. Always limit losses per the 7-8% sell rule, and never hold a stock if it falls more than that from your purchase price. The technical chart support remains its 50-day moving average line. EBIX sports very strong ranks; its Earnings Per Share (EPS) is a 99 and its Relative Strength (RS) rating is a 97. The number of top-rated funds owning an interest rose from 7 in June '07 to 13 in March '08, which shows increasing institutional demand (the I criteria). Concerns would be raised by any weakness leading to a violation of its 50 DMA line, and more serious concerns would be raised by deterioration under its old chart highs near the $78-80 area which would have the effect of technically negating its latest breakout.
This thinly traded, high-ranked leader was first featured in the March 2008 CANSLIM.net News with a detailed write up and an annotated chart (read here). The report cited a $77.60 pivot point and a $81.48 maximum price. A few weeks later, the stock triggered a proper technical buy signal when it surged above its pivot point on more than double its average volume. In the April 22, 2008 CANSLIM.net After-Market Update (read here) the following note summed up that day's action - "Considerable gain today in the final hour of the session helped it rise above its pivot point with volume more than triple its average daily trading total, triggering a proper technical buy signal."
C A N S L I M | StockTalk | News | Chart | SEC | Zacks Reports | ![]()
![]()
![]()
View all notes | Alert me of new notes | CANSLIM.net Company Profile
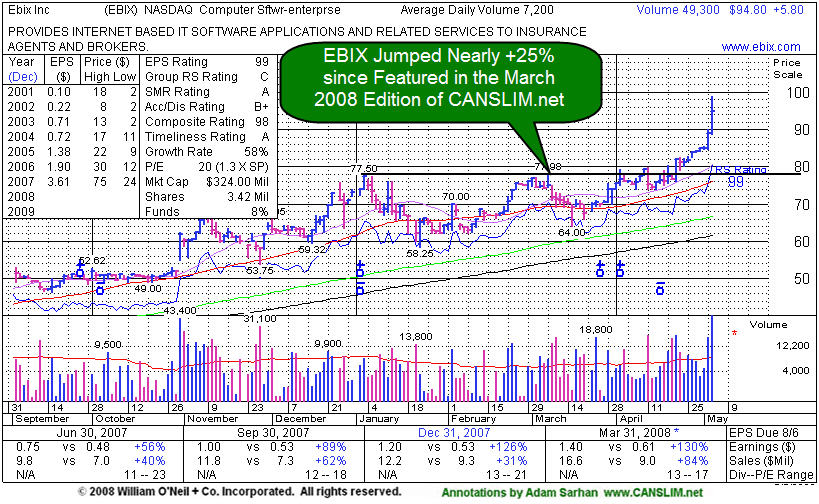
Computer Software Company Surges To New Highs! - Monday, May 05, 2008
A classic example of the success enjoyed by many CANSLIM.net readers usually starts when an investor reads a CANSLIM.net report and buys a featured stock before it has risen above the pivot point by greater than 5%. After a stock breaks out above its pivot point, there is only a +5% window that investors have to purchase the stock under the proper guidelines. Once a stock rises above the "maximum buy price" the risk of a shake out balloons, meaning that even a normal retracement in the stock might force you to employ the 7-8% loss cutting rule. Much can be told by the stock's daily action in the weeks and months that follow a breakout. Typically, a light volume and orderly pullback suggests that the bulls remain in control. However, high volume pullbacks that violate support paint a totally different picture.Ebix Inc. (EBIX UP $5.80 or 6.52% to $94.80) surged to another new multi year high on very heavy volume after smashing earnings estimates. EBIX sports very strong ranks; its Earnings Per Share (EPS) and its Relative Strength (RS) rating are 99, the highest possible reading. The number of top-rated funds owning an interest rose from 7 in Jun '07 to 11 in Mar '08, which shows increasing institutional demand (the I criteria). Concerns would be raised by any weakness leading to a close under its old chart highs near $78-80 area which would have the effect of technically negating its latest breakout.
This thinly traded, high-ranked leader was first featured in the March 2008 CANSLIM.net News with a detailed write up and an annotated chart (read here). The report cited a $77.60 pivot point and a $81.48 maximum price. A few weeks later, the stock triggered a proper technical buy signal when it surged above its pivot point on more than double its average volume. Since then, the stock jumped nearly +25% and just hit a fresh multi year high on heavy volume. At this point, the stock is very extended above a proper base to be considered buyable under the guidelines. Always limit losses per the 7-8% sell rule, and never hold a stock if it falls more than that from your purchase price.
C A N S L I M | StockTalk | News | Chart | SEC | Zacks Reports | ![]()
![]()
![]()
View all notes | Alert me of new notes | CANSLIM.net Company Profile
Gains On Better Volume After Bouncing Near 50 DMA Line - Friday, March 28, 2008
A very important technical tool that savvy investors have learned to incorporate in their technical analysis is the 50-day moving average (DMA) line. The 50 DMA line plays a pivotal role relative to a stock's price. If the price of a stock is above its 50 DMA then odds are that its 50 DMA will act as formidable support. Conversely, if the price is below its 50 DMA then the moving average acts as resistance. Healthy stocks sometimes trade under their 50 DMA lines briefly, but usually a strong candidate will promptly bounce and repair a 50 DMA violation. When a stock has violated its 50 DMA line and then lingers beneath it, the stock's outlook gets worse and worse as it spends a greater period of time trading under that important short-term average line. Once the 50 DMA line starts sloping downward it should also be acknowledged that the stock has been struggling for a while, and it might be time to reduce exposure and look for places to put that money to work in stronger buy candidates.
Ebix Inc. (EBIX +$3.43 or +4.86% to $74.00) rallied on above average volume and made more progress after recently finding prompt support near its 50 DMA line ($69.01 now). This thinly traded, high-ranked leader was first featured in the March 2008 CANSLIM.net News with a detailed write up and an annotated chart (read here). The report cited a $77.60 pivot point and a $81.48 maximum price. The stock has yet to trigger a new technical buy signal with a solid gain and close above its $77.60 pivot point. Look for the stock to confirm a new technical buy signal by breaking out above its pivot point with gains on heavy volume in the coming days and weeks. After any stock is properly bought, disciplined investors know that it is of the utmost importance to sell if it drops 7-8% below your purchase price. Any losses leading to a subsequent breach of its 50 DMA or recent chart lows would raise concerns and trigger technical sell signals as well.
EBIX has shown solid earnings increases and strong sales revenues growth in recent quarterly comparisons (good C criteria), and it has a good annual earnings history (good A criteria) over the past few years. There is very little resistance remaining due to overhead supply up to the $77-78 level. Its Earnings Per Share (EPS) is 99 and its Relative Strength (RS) rating stands at a very healthy 99. The number of top-rated funds owning an interest in its shares rose from 5 in Mar '07 to 11 in Dec '07, helping to satisfy the I criteria. The very small supply of only 1.58 million shares in its float and light trading volumes could lead dramatic price volatility, especially if the institutional crowd rushes in or out.
C A N S L I M | StockTalk | News | Chart | SEC | Zacks Reports | ![]()
![]()
![]()
View all notes | Alert me of new notes | CANSLIM.net Company Profile
Thinly Traded Issue Has Characteristics Of Many Great Winners - Sunday, March 02, 2008
|
Ebix Inc |
||
|
Ticker Symbol: EBIX (NASDAQ) |
Industry Group: Business Software & Services |
Shares Outstanding: 3,280,000 |
|
Price: $76.00 (2/29/2008 close) |
Day's Volume: 4,900 (02/29/08 close) |
Shares in Float: 1,580,000 |
|
52 Week High: $77.50 |
50-Day Average Volume: 4,900 |
Up/Down Volume Ratio: 1.2 |
|
Pivot Point: $77.60 1/03/08 high plus .10 |
Pivot Point +5% = Max Buy Price: $81.48 |
Web Address: http://www.ebix.com |
C A N S L I M | StockTalk | News | Chart | SEC | Zacks Reports | ![]()
![]()
![]()
View all notes | Alert me of new notes | CANSLIM.net Company Profile
CANSLIM.net Company Profile: Ebix Inc. is based in Atlanta, Georgia and provides software and Internet-based solutions for the insurance industry. It focuses on the sale, customization, development, implementation, and support of its insurance carrier system product, known as Business Reinsurance and Insurance Company System (BRICS). The company also sells and supports broker/agency management systems, such as EbixASP, a Web-enabled system for insurance agencies to manage their businesses; eGlobal, a multi-lingual and multi-currency modular agency management solution; and Winbeat self hosted broker systems. Additionally, Ebix, Inc. provides e-business solutions that provide an integrated exchange which is utilized by insurers, intermediaries, and other insurance channel providers in Australia. The company was founded in 1976. It was formerly known as Delphi Information Systems, Inc. and changed its name to Ebix, Inc. in 2003. It hails from the Computer Sftwr-Enterprse group which is presently ranked 60th on the 197 Industry Groups list, and while that places it outside of the much-preferred top quartile of groups, strength in other high-ranked leaders including Informatica Corp (INFA) and Open Text Corp (OTEX) helps provide confirming leadership to satisfy the L criteria. The number of top-rated funds with an ownership interest has grown from 5 funds in March '07 to 10 funds as of December '07, a sign of increasing institutional interest (the I criteria). It has a good annual earnings history (good A criteria) without any downturns. Strong quarterly earnings and sales revenues increases in its last 6 quarters have been well above the +25% guideline to satisfy the C criteria. Management owns a 17% interest in its shares, keeping directors focused on building and maintaining shareholder value.
What to Look For and What to Look Out For: Its small supply of shares and very light trading volumes could lead dramatic price volatility, especially if the institutional crowd rushes in or out. Dollar-wise, it trades more than twice as much on a daily basis as Hansen Natural Corp (HANS) did back when it was first featured in February 2004 issue of CANSLIM.net News (read here - to see how it looked before a greater than 50-fold increase), however, like that earlier example, there will surely be skeptics who voice concern over the lack of liquidity. Realize that 95% of the winners this investment system was modled after had less than 30 million shares outstanding, and be sure to always follow proper buy and sell discipline to control risk. Look for the stock to confirm a new technical buy signal by breaking out above its $77.60 pivot point with gains on heavy volume in the coming days and weeks. Much of EBIX's success will depend on the broader market's ability to sustain a meaningful rally, otherwise 3 out of 4 stocks are likely to struggle. As always, it is of the utmost importance to sell a stock if it drops 7-8% below your purchase price. Deterioration under its 50-day moving average (DMA) line, or worse, its prior chart lows in the $58 area, would raise concerns and trigger technical sell signals.
Technical Analysis: This high-ranked leader has been in a steady uptrend since bottoming out in August 2006. It has consolidated numeroius times along the way and typically found support near its 50-day moving average (DMA) line. During the market's correction this year it encountered some distribution, but without sustaining any serious technical damage. Little resistance remains in its way to higher ground.