Deckers Consolidating Near High - Thursday, June 13, 2024
Deckers Outdoor Corp (DECK -$9.36 or -0.90% to $1,030.16) pulled back for a 3rd consecutive loss today with below-average volume. It is consolidating well above the prior high ($956) which defines initial support to watch on pullbacks.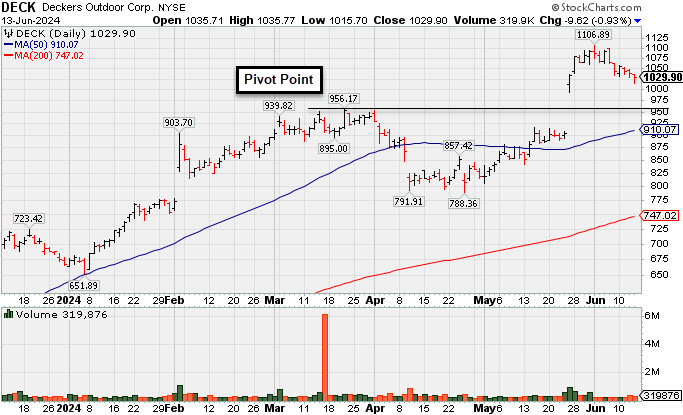
| Symbol/Exchange Company Name Industry Group | PRICE | CHANGE | Day High | Volume (% DAV) (% 50 day avg vol) | 52 Wk Hi | Featured Date | Price Featured | Pivot Featured |
| Max Buy | ||||||||
TransDigm Group Aerospace/Defense | $1,323.65 | +1.52 0.11% | $1,325.46 | 165,725 50 DAV is 210,000 | $1,369.58 -3.35% | 4/12/2024 | $1,224.21 | PP = $1,246.32 |
| MB = $1,308.64 | ||||||||
| Most Recent Note - 6/12/2024 5:29:08 PM G - Color code is changed to green after rising back above its "max buy" level. Its 50 DMA line ($1,278) defines near-term support to watch. Fundamentals remain strong. See the latest FSU analysis for more details and a new annotated graph. >>> FEATURED STOCK ARTICLE : Transdigm Consolidating Above 50-Day Moving Average - 6/12/2024 | View all notes | Set NEW NOTE alert | Company Profile | SEC News | Chart | Request a new note | ||||||||
U.S. Lime & Minerals Bldg-Cement/Concrt/Ag | $336.51 | -2.24 -0.66% | $340.48 | 9,435 50 DAV is 25,000 | $378.78 -11.16% | 2/9/2024 | $254.68 | PP = $265.09 |
| MB = $278.34 | ||||||||
| Most Recent Note - 6/12/2024 5:31:04 PM G - Gapped up today for a solid gain with average volume, finding prompt support near its 50 DMA line ($329). It has not formed a sound base. Fundamentals remain strong. >>> FEATURED STOCK ARTICLE : Streak of Losses Testing 50-Day Moving Average Line - 6/6/2024 | View all notes | Set NEW NOTE alert | Company Profile | SEC News | Chart | Request a new note | ||||||||
Celestica Elec-Contract Mfg | $56.77 | +1.88 3.43% | $56.90 | 1,786,715 50 DAV is 2,416,000 | $61.06 -7.03% | 5/15/2024 | $51.52 | PP = $51.22 |
| MB = $53.78 | ||||||||
G - Posted a 2nd consecutive gain today with lighter than average volume. Prior highs in the $51 area define initial support to watch above its 50 DMA line ($49.46). >>> FEATURED STOCK ARTICLE : Steady Pullback to Below "Max Buy" Level Following Rally - 6/4/2024 | View all notes | Set NEW NOTE alert | Company Profile | SEC News | Chart | Request a new note | ||||||||
Deckers Outdoor Apparel-Shoes and Rel Mfg | $1,030.16 | -9.36 -0.90% | $1,035.77 | 319,969 50 DAV is 360,000 | $1,106.89 -6.93% | 5/24/2024 | $1,010.60 | PP = $956.27 |
| MB = $1,004.08 | ||||||||
G - Consolidating near its all-time high, extended from the prior base. Prior highs in the $956 area define initial support to watch on pullbacks. >>> FEATURED STOCK ARTICLE : Deckers Consolidating Near High - 6/13/2024 | View all notes | Set NEW NOTE alert | Company Profile | SEC News | Chart | Request a new note | ||||||||
e.l.f. Beauty Cosmetics/Personal Care | $200.44 | +3.12 1.58% | $202.29 | 927,889 50 DAV is 1,701,000 | $221.83 -9.64% | 5/24/2024 | $193.79 | PP = $182.73 |
| MB = $191.87 | ||||||||
| Most Recent Note - 6/12/2024 5:32:54 PM G - Color code is changed to green after a 3rd consecutive solid gain today with average volume, rebounding above its "max buy" level near prior highs. Its 50 DMA line ($171) defines important near-term support to watch. >>> FEATURED STOCK ARTICLE : Down on Lighter Volume After Breakout From "Double Bottom" Base - 5/29/2024 | View all notes | Set NEW NOTE alert | Company Profile | SEC News | Chart | Request a new note | ||||||||
| Symbol/Exchange Company Name Industry Group | PRICE | CHANGE | Day High | Volume (% DAV) (% 50 day avg vol) | 52 Wk Hi | Featured Date | Price Featured | Pivot Featured |
| Max Buy | ||||||||
PDD Holdings ADR Retail-Internet | $151.07 | +0.07 0.05% | $152.90 | 4,550,853 50 DAV is 9,309,000 | $164.69 -8.27% | 5/24/2024 | $161.85 | PP = $153.09 |
| MB = $160.74 | ||||||||
| Most Recent Note - 6/11/2024 5:42:50 PM Y - Pulled back today with near average volume following 3 gains with below average volume. Raised concerns recently as it negated the breakout after clearing a 20-week base. Disciplined investors avoid big losses by selling any stock that falls more than 7-8% below their purchase price. >>> FEATURED STOCK ARTICLE : Pulled Back Below Prior Highs Raising Concerns - 5/28/2024 | View all notes | Set NEW NOTE alert | Company Profile | SEC News | Chart | Request a new note | ||||||||
CrowdStrike Holdings Computer Sftwr-Security | $382.81 | -4.56 -1.18% | $389.89 | 3,956,836 50 DAV is 3,453,000 | $390.71 -2.02% | 5/28/2024 | $351.47 | PP = $365.10 |
| MB = $383.36 | ||||||||
Y - Color code is changed to yellow after pulling back just below its "max buy" level today with near average volume following 4 consecutive volume-driven gains for new all-time highs. Its 50 DMA line ($323) defines near-term support to watch. Bullish action came after it reported Apr '24 quarterly earnings +63% on +33% sales revenues versus the year-ago period, continuing its strong earnings track record. >>> FEATURED STOCK ARTICLE : Volume-Driven Loss Triggered Technical Sell Signal - 5/30/2024 | View all notes | Set NEW NOTE alert | Company Profile | SEC News | Chart | Request a new note | ||||||||
Novo Nordisk ADR Medical-Ethical Drugs | $142.49 | -0.77 -0.54% | $142.91 | 2,852,959 50 DAV is 3,764,000 | $144.50 -1.39% | 6/7/2024 | $143.06 | PP = $138.38 |
| MB = $145.30 | ||||||||
| Most Recent Note - 6/11/2024 12:20:46 PM Y - Pausing today after 8 consecutive gains while wedging to new all-time highs. Color code was changed to yellow with pivot point cited based on its 3/07/24 high. To clinch a proper technical buy signal gains above the pivot point must be backed by at least +40% above-average volume. Fundamentals remain strong. >>> FEATURED STOCK ARTICLE : Wedging Into New High Ground - 6/7/2024 | View all notes | Set NEW NOTE alert | Company Profile | SEC News | Chart | Request a new note | ||||||||
Granite Construction Bldg-Heavy Construction | $62.60 | +0.16 0.26% | $62.71 | 380,512 50 DAV is 428,000 | $64.33 -2.69% | 6/11/2024 | $59.76 | PP = $64.33 |
| MB = $67.55 | ||||||||
| Most Recent Note - 6/12/2024 5:34:03 PM Y - Gapped up today for a 3rd consecutive volume-driven gain. Color code was changed to yellow when highlighted on the earlier mid-day report as it was noted that a valid secondary buy point exists up to +5% above the recent high after finding support at its 10 WMA line following a prior breakout. Reported improved earnings in the Jun, Sep, Dec '23, and Mar '24 quarters versus the year ago periods. Annual earnings growth has been strong and steady. See the latest FSU analysis for more details and an annotated graph. >>> FEATURED STOCK ARTICLE : Granite Construction Found Support at 10-Week Moving Average - 6/11/2024 | View all notes | Set NEW NOTE alert | Company Profile | SEC News | Chart | Request a new note | ||||||||
Big "Breakaway Gap" for Deckers Outdoor - Friday, May 24, 2024
Deckers Outdoor Corp (DECK +$128.25 or +14.18% to $1,032.90) finished strong after was highlighted in yellow with pivot point cited based on its 3/21/24 high plus 10 cents in the earlier mid-day report (read here). Its "breakaway gap" was backed by +101% above average volume as it hit a new all-time high today triggering a technical buy signal. The prior high ($956) defines initial support to watch on pullbacks.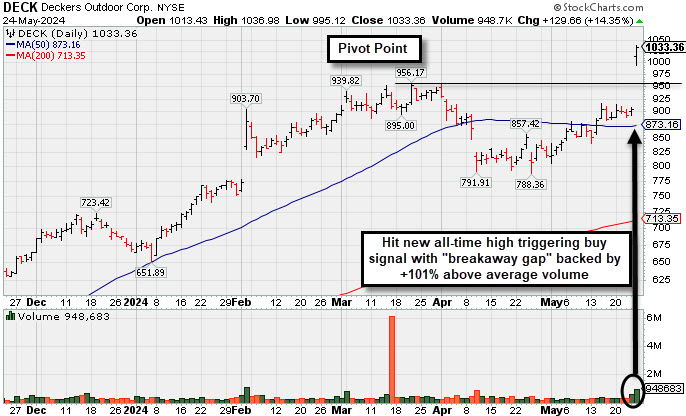
Touched New High But Closed Below Pivot Point - Thursday, September 16, 2021
Deckers Outdoor Corp (DECK +$3.69 or +0.85% to $439.94) was highlighted in yellow with pivot point cited based on its 8/05/21 high plus 10 cents in the earlier mid-day report (read here). It touched a new all-time high today while adding to recent volume-driven gains as it rallied from support at its 50-day moving average (DMA) line ($415). Subsequent gains and a strong close above the pivot point backed by at least +40% above average volume may trigger a technical buy signal.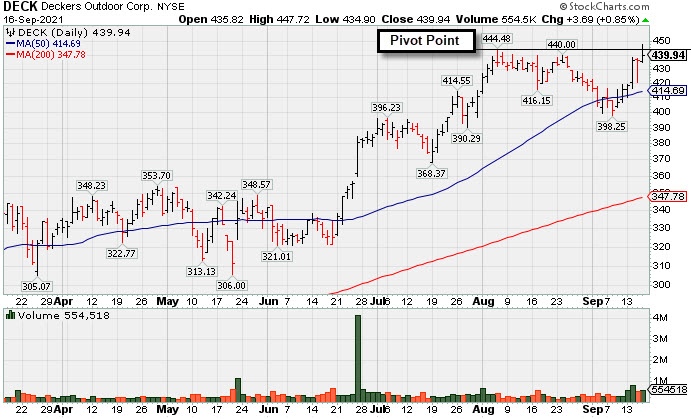
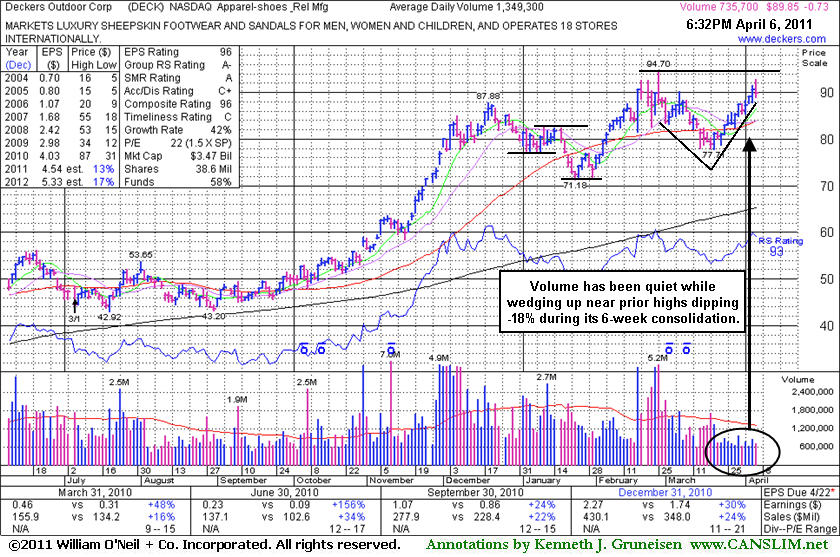
Quietly Wedging Near Highs After Choppy Consolidation - Wednesday, April 06, 2011
Deckers Outdoor Corp (DECK -$0.73 or -0.81% to $89.85) finished with a small loss on lighter volume today after it was poised for a best-ever close. Subsequent gains to new highs with above average volume would be an encouraging sign of institutional accumulation, but its choppy consolidation included a pullback of -18% in the past 6 weeks that is not recognized as a sound base pattern. It has also not distanced itself from an earlier "double bottom" base following its last appearance in this FSU section on 3/03/11 with an annotated graph under the headline, "Recent Churning Action Indicates Distributional Pressure."
The number of top-rated funds owning its shares rose from 474 in Dec '09 to 592 as of Dec '10, a reassuring sign concerning the investment system's I criteria. Strong quarterly earnings and annual earnings history satisfies the C and A criteria. Even after a 3:1 split earlier this year, it still has a small supply of only 38.5 million shares outstanding (S criteria), which makes it prone to be a volatile stock in the event of institutional accumulation or distribution. The small supply is favorable, provided proper discipline is used.
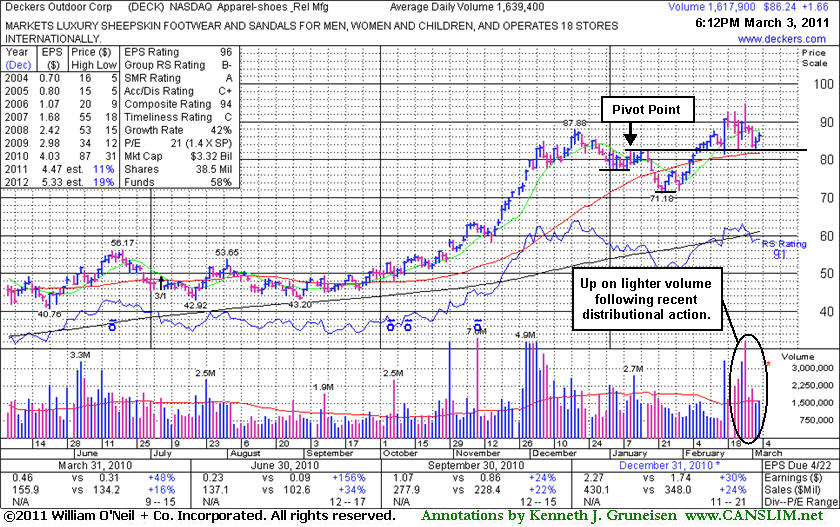
Recent Churning Action Indicates Distributional Pressure - Thursday, March 03, 2011
Deckers Outdoor Corp (DECK +$1.66 or +1.96% to $86.24) has posted 2 consecutive gains on light or near average volume after recent losses on above average volume. Churning above average volume action without meaningful price progress has been noted as indicative of distributional pressure following its 2/17/11 technical breakout. Support to watch is at its pivot point and 50-day moving average (DMA) line (now $81.68). Any subsequent gains with above average volume for a new high close (N criteria) would be a very reassuring sign reconfirming proof of institutional accumulation. Following its last appearance in this FSU section on 1/26/11 with an annotated graph under the headline "Short-Term Average Violation Triggered Sell Signal Last Week" it subsequently rebounded back above its 50-day moving average (DMA) line during a streak of 10 consecutive gains with light volume.
It reported earnings +30% on +24% sales revenues for the quarter ended December 31, 2010 versus the year earlier. Technically, a powerful positive reversal and strong finish on 2/17/11 had clinched a late buy signal based on the previously noted "double bottom" base pattern. The consolidation (on 2/15 and 2/16) was too short to be considered a proper "handle" on a cup-with-handle pattern. A handle needs to be at least 1-week long and should drift downward on light volume. The number of top-rated funds owning its shares rose from 474 in Dec '09 to 572 as of Dec '10, a reassuring sign concerning the investment system's I criteria. Strong quarterly earnings and annual earnings history satisfies the C and A criteria. Even after a 3:1 split earlier this year, it still has a small supply of only 38.5 million shares outstanding (S criteria), which makes it prone to be a volatile stock in the event of institutional accumulation or distribution. The small supply is favorable, provided proper discipline is used.
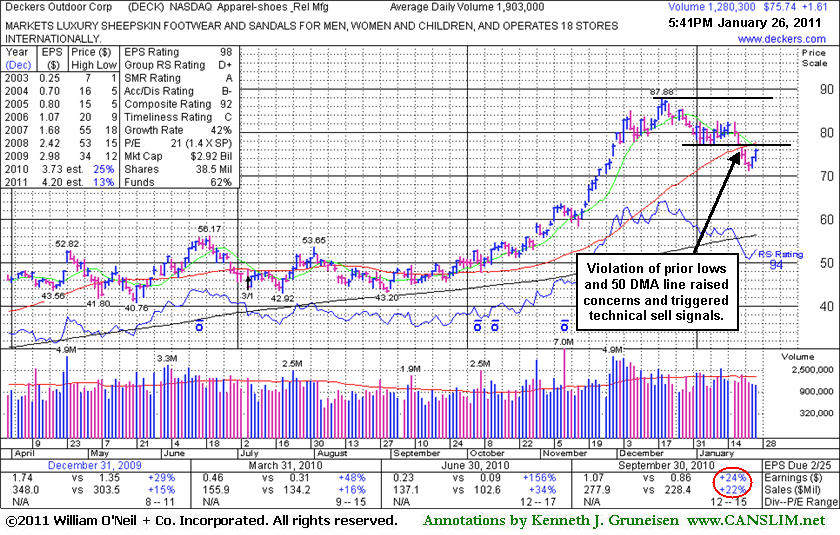
Short-Term Average Violation Triggered Sell Signal Last Week - Wednesday, January 26, 2011
Deckers Outdoor Corp (DECK +$1.61 or +2.17% to $75.74) posted a second consecutive gain on light volume today after a streak of 5 consecutive losses. It violated its 50-day moving average (DMA) line last week amid broad-based weakness in the market (M criteria), raising concerns and triggering a technical sell signal. That important short-term average may now act as resistance. Time is needed for it to possibly form a sound new base, meanwhile it may be prone to a longer an deeper consolidation. For its outlook to improve, gains back above its 50 DMA line with above average volume would be a very reassuring sign.DECK managed to hit new all-time highs after its last appearance in this FSU section on 12/16/10 under the headline, "Recent Consolidation May Be A New Advanced "3-Weeks Tight", however it subsequently made very little headway then slumped back under its pivot point. Last week's losses led more technical damage. Keep in mind that it traded as much as +67.5% from when it was first featured in yellow in the 6/11/10 mid-day report, having really heated up in the later part of 2010.
The number of top-rated funds owning its shares rose from 474 in Dec '09 to 554 as of Dec '10, a reassuring sign concerning the investment system's I criteria. Earnings were above the +25% minimum guideline in the 5 latest comparisons versus the year ago periods, satisfying the C criteria. This apparel firm has a great annual earnings history (A criteria). Even after a 3:1 split earlier this year, it still has a small supply of only 38.5 million shares outstanding (S criteria), which makes it prone to be a volatile stock in the event of institutional accumulation or distribution. The small supply is favorable, provided proper discipline is used.
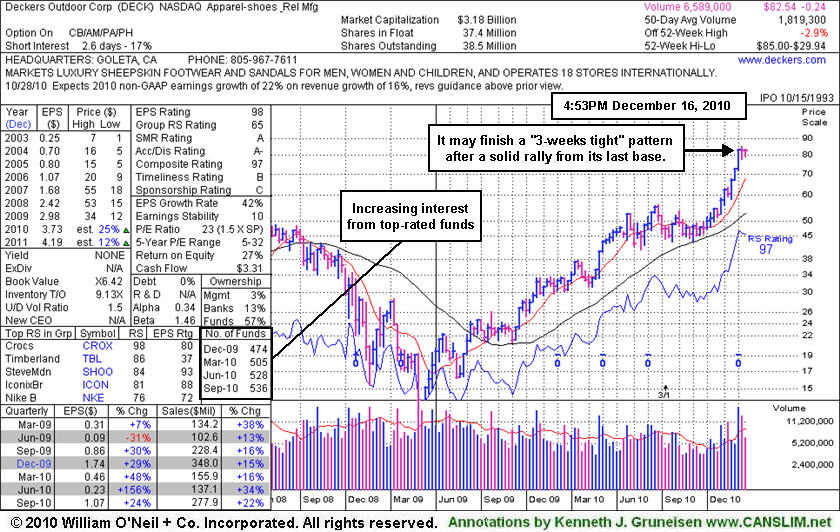
Recent Consolidation May Be A New Advanced "3-Weeks Tight" Type Pattern - Thursday, December 16, 2010
Deckers Outdoor Corp (DECK +$0.80 or +0.98% to $82.58) has been stubbornly holding its ground for the past 2 weeks near its all-time high. Volume totals have been cooling while it may be forming a "3-weeks tight" type pattern. Its 50-day moving average (DMA) line defines the nearest chart support level. The number of top-rated funds owning its shares rose from 474 in Dec '09 to 536 as of Sep '10, a reassuring sign concerning the investment system's I criteria.
At its last appearance in this FSU section on 10/2710 under the headline "Bullish Action Ahead Of Earnings News Pending" it was perched within close striking distance of its 52-week high. It had been featured in yellow in the mid-day report (read here) while pulling back while noted - "Technically, it broke out from a saucer-with-handle pattern with above average volume on the prior session. The pivot point cited is based upon its 10/15/10 high plus ten cents. No overhead supply remains to hinder its progress. Confirming gains into new all-time high ground with above average volume would be a very reassuring sign."
Earnings were above the +25% minimum guideline in the 5 latest comparisons versus the year ago periods, satisfying the C criteria. This apparel firm has a great annual earnings history (A criteria). Even after a 3:1 split earlier this year, it still has a small supply of only 38.5 million shares outstanding (S criteria), which makes it prone to be a volatile stock in the event of institutional accumulation or distribution. The small supply is favorable, provided proper discipline is used. Disciplined investors avoid chasing extended stocks more than +5% above prior chart highs, and always limit losses by selling if a stock falls -7% from their purchase price to prevent a more damaging loss.
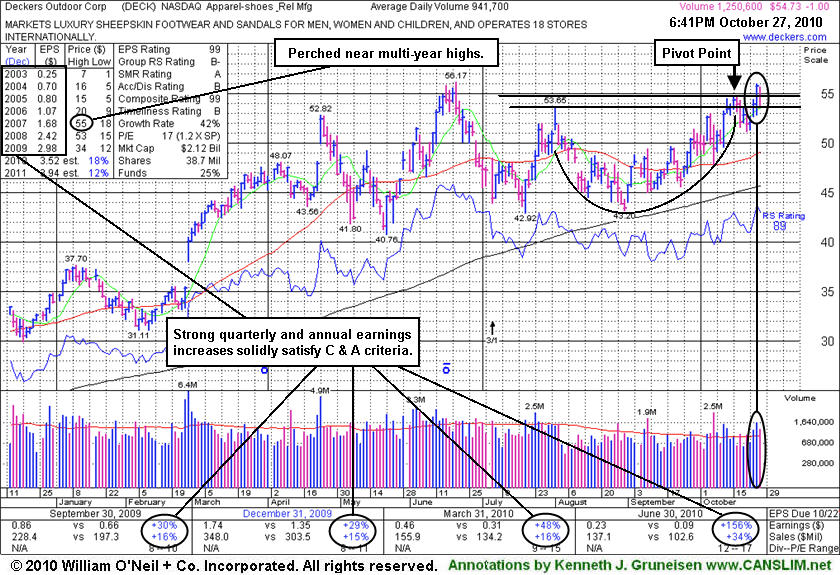
Bullish Action Ahead Of Earnings News Pending - Wednesday, October 27, 2010
Deckers Outdoor Corp (DECK -$1.00 or -1.79% to $54.73) is perched within close striking distance of its 52-week high, and it was featured in yellow in today's mid-day report (read here) while pulling back. Technically, it broke out from a saucer-with-handle pattern with above average volume on the prior session. The pivot point cited is based upon its 10/15/10 high plus ten cents. No overhead supply remains to hinder its progress. Confirming gains into new all-time high ground with above average volume would be a very reassuring sign.
Careful trading discipline is important, as volume and volatility often increase in stocks near earnings news, and it is reporting earnings on Thursday, October 28, 2010. Quarterly sales revenues showed a bigger +34% increase in quarter ended June 30, 2010, an encouraging acceleration. Earnings were above the +25% minimum guideline in the 4 latest comparisons versus the year ago periods, satisfying the C criteria. This apparel firm has a great annual earnings history (A criteria). Even after a 3:1 split earlier this year, it still has a small supply of only 38.7 million shares outstanding (S criteria), which makes it prone to be a volatile stock in the event of institutional accumulation or distribution. The small supply is favorable, provided proper discipline is used. Disciplined investors avoid chasing extended stocks more than +5% above prior chart highs, and always limit losses by selling if a stock falls -7% from their purchase price to prevent a more damaging loss.
DECK made its last appearance in this FSU section on 7/01/10 under the headline "After Clearing Overhead Supply Latest Breakout Failed" and was dropped from the Featured Stocks list on 7/20/10. It found support above its longer-term 200-day moving average (DMA) line in the interim. Do not be confused when reviewing prior reports after the stock split 3:1 effective as of 7/06/10. It appeared in yellow in the 6/11/10 mid-day report (read here) and finished that session strong as it rallied to a new 52-week high with volume nearly 2 times average. Having cleared a choppy 7-week consolidation, it went on to challenge its 2007 all-time high and briefly traded even higher. Although it was unhindered by resistance due to overhead supply then, it soon negated the breakout and began to weaken. Along with it, the major indices fell into another correction. It has proven resilient and could be poised for a more successful rally now.
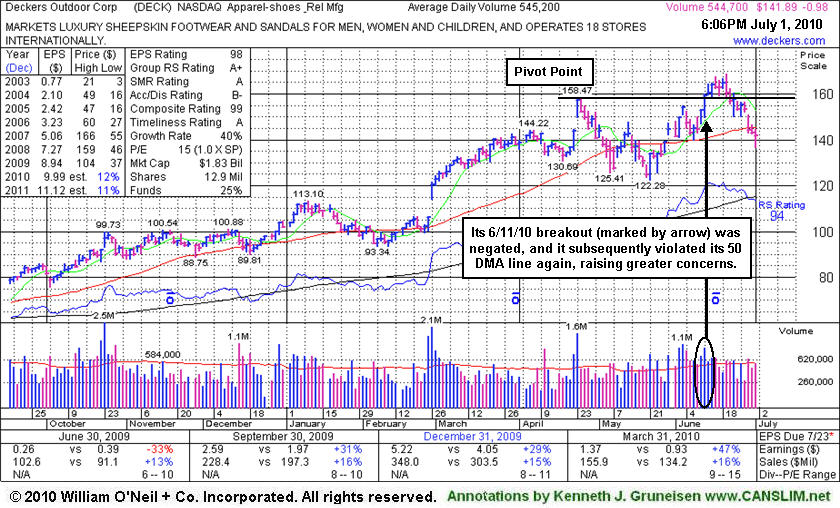
After Clearing Overhead Supply Latest Breakout Failed - Thursday, July 01, 2010
Deckers Outdoor Corp (DECK -$0.98 or -0.69% to $141.89) finished lower today on average volume for its 4th consecutive loss, slumping further below its 50-day moving average (DMA) line. Weak market (M criteria) action may be expected to drag 3 out of 4 stocks lower, meanwhile, caution is advised until another new confirmed rally begins.
DECK appeared in yellow in the 6/11/10 mid-day report (read here) and finished that session strong as it rallied to a new 52-week high with volume nearly 2 times average. Having cleared a choppy 7-week consolidation, it went on to challenge its 2007 all-time high ($166) and briefly traded even higher. Although it was unhindered by resistance due to overhead supply, it soon negated the breakout and began to weaken. Along with it, the major indices fell into another correction. For disciplined investors a major concern now is that, until another new confirmed rally with a solid follow-through day occurs, the negative M criteria argues against new buying efforts. Meanwhile, 3 out of 4 stocks typically follow the direction of the major averages, and their path of least Resistance appears to be heading lower for the time being.
Quarterly sales revenues increases have been in the +16% range while earnings increases were above the +25% minimum guideline in the 3 latest comparisons. This apparel firm has a great annual earnings history (A criteria). Earnings estimates are in the 11-12% range for FY '10 and '11, and its rather lackluster sales revenues growth rate also leaves some concerns, fundamentally.
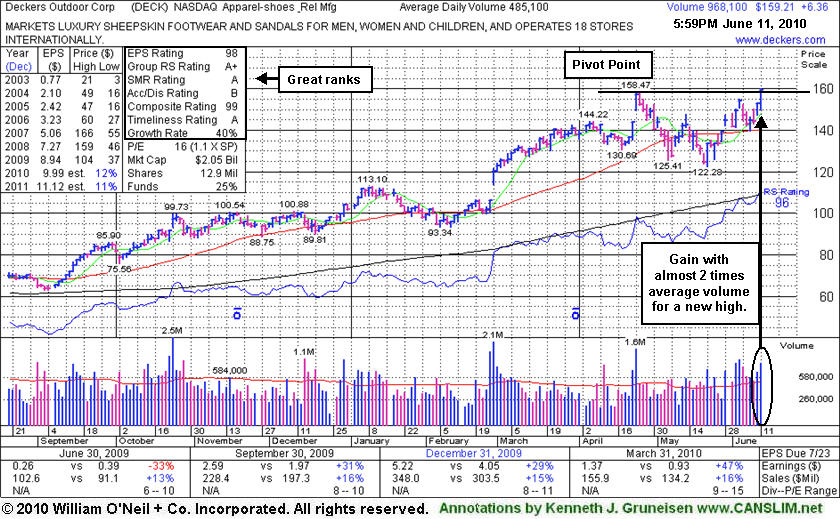
Strong Close Backed By Big Volume - Friday, June 11, 2010
Deckers Outdoor Corp (DECK +6.36 or +4.16% to $159.21) was noted earlier today as it appeared in yellow in the mid-day report (read here). It finished strong and rallied to a new 52-week high with volume nearly 2 times average. Having cleared a choppy 7-week consolidation, it may be on course to challenge its 2007 all-time high ($166) and perhaps go even higher, unhindered by resistance due to overhead supply. Quarterly sales revenues increases have been in the +16% range while earnings increases were above the +25% minimum guideline in the 3 latest comparisons. The previously noted 2/26/10 "breakaway gap" was followed by meaningful gains. This apparel firm has a great annual earnings history (A criteria). Earnings estimates are in the 11-12% range for FY '10 and '11, and its rather lackluster sales revenues growth rate also leaves some concerns, fundamentally. For disciplined investors, a major concern remains that the major averages have not yet produced a confirmed rally with a solid follow-through day. That leaves the M criteria an overriding concern that argues against new buying efforts, since 3 out of 4 stocks typically follow the direction of the major averages.