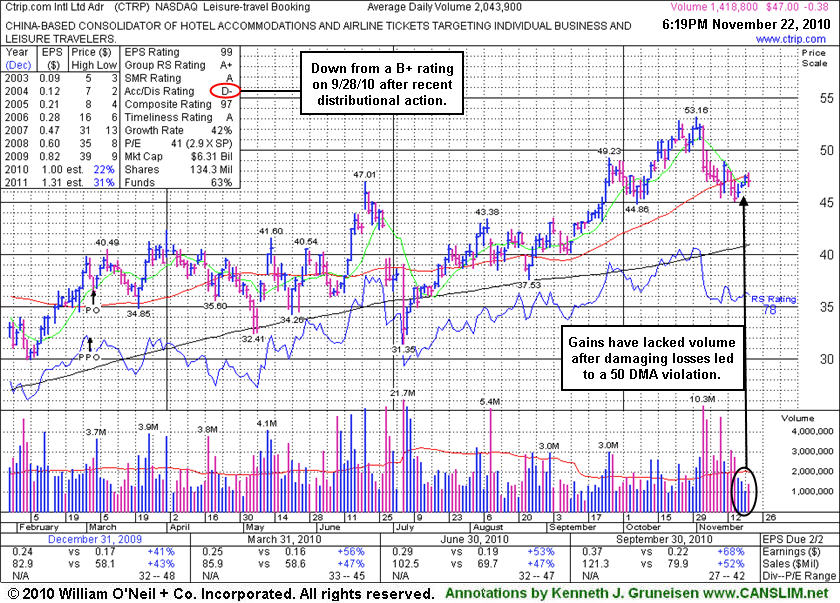
Ctrip.Com Intl Ltd Adr (CTRP -$0.38 or -0.80% to $47.00) remains below its 50-day moving average (DMA) line which may now act as a resistance level. Gains have lacked volume conviction after losses with above average volume raised concerns as it closed below its June highs, negating all progress after its recent breakout. Subsequent losses below its recent low ($45.05 on 11/16/10) would raise even greater concerns. Its Accumulation/Distribution rank (see red circle) has slumped to D- from a B+ when it was last analyzed in the 9/28/10 FSU section with an annotated graph under the headline "Pulling Back After 7 Straight Gains And Technical Breakout." The volume total was +74% above average on 9/27/10 with its gain above the pivot point as it triggered a technical buy signal soon after it was featured in yellow in the 9/24/10 mid-day report (read here).
Now it faces some resistance due to overhead supply up through the $53 area. Quarterly and annual earnings history has been strong (good C and A criteria). Leadership (L criteria) in the stock's Industry Group (Leisure - Travel Booking) is a reassuring sign.
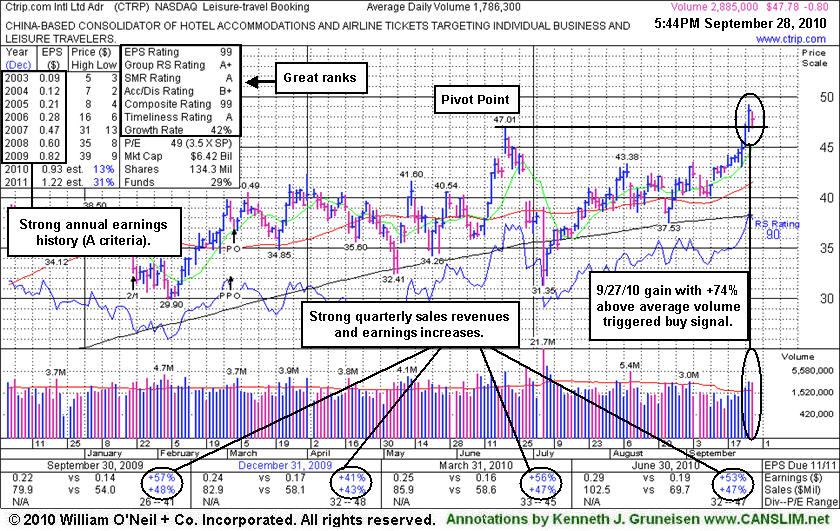
Ctrip.Com Intl Ltd Adr (CTRP -$0.80 or -1.64% to $47.78) is perched within close striking distance of its 52-week high, pulling back today after a streak of 7 consecutive gains with ever-increasing volume. The volume total was +74% above average on 9/27/10 with its gain above the pivot point as it triggered a technical buy signal soon after it was featured in yellow in the 9/24/10 mid-day report (read here). No overhead supply remains to act as resistance, while the price/volume action has been choppy in this high-ranked leaders since it was dropped from the Featured Stocks list on 5/06/10. Quarterly and annual earnings history has been strong (good C and A criteria). Leadership (L criteria) in the stock's Industry Group (Leisure - Travel Booking) is a reassuring sign.
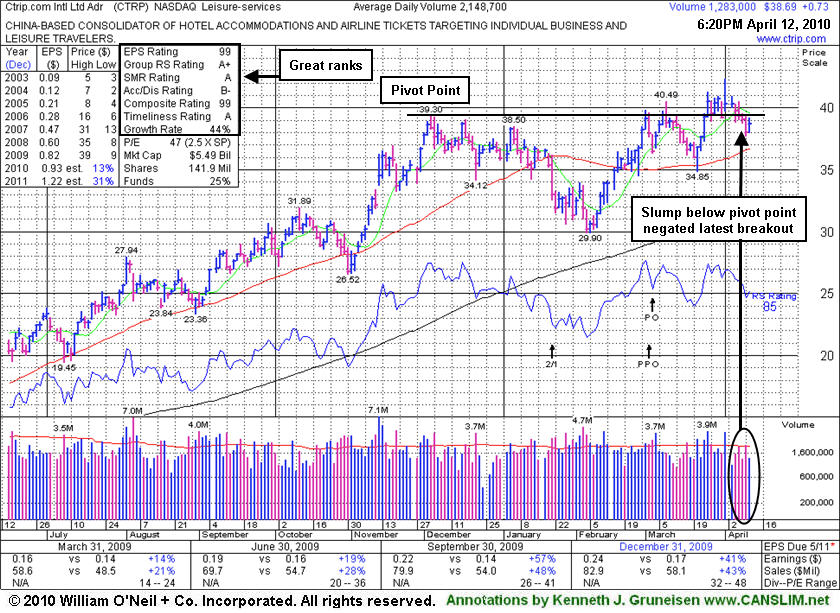
Ctrip.com International, Ltd. (CTRP) posted a gain today on lighter volume, halting a streak of 4 consecutive losses. It stalled and has shown distributional action since 3/25/10 when a detailed Stock Bulletin with annotated graph and expert analysis was published (read here) and it triggered a proper technical buy signal. Its reversal from its high on 4/01/10 was noted as encountered distributional pressure and quickly reversed a large part of its early gain to ultimately close in the lower part of its intra-day range. The subsequent pullback led to a violation of the $39.40 pivot point cited, which had the effect of technically negating its latest breakout, raising concerns. It had rallied on average volume to a new 52-week high when featured in the March 2010 issue of CANSLIM.net News (read here). Meanwhile, the broader market action (M criteria) turned definitively more bullish with a follow-through-day (FTD) and an increase in the number of stocks making it to the Breakouts Page.
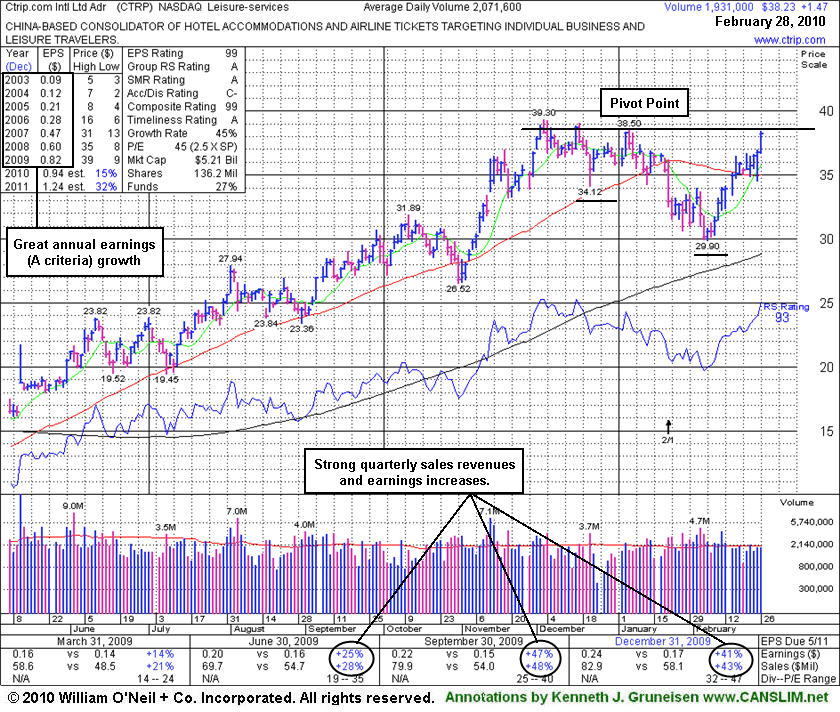
There is not any great overhead supply now to act as resistance for CTRP. Ideally, one would like to see significant volume show up behind a gain for a new high close to re-confirm a proper technical buy signal. The company and its subsidiaries provide travel services for hotel accommodations, airline tickets, and packaged tours in China. It also sells independent leisure travelers bundled package-tour products, which include transportation and accommodations, as well as guided tours covering various domestic and international destinations. The company was founded in 1999 and is headquartered in Shanghai, China. The stock resides in the Leisure-Services group which is presently ranked in the much-preferred top quartile of groups, easily satisfying the L criteria. The number of top-rated funds with an ownership interest has grown from 52 funds in Mar '09 to 130 funds as of Dec '09, a sign of increasing institutional interest (the I criteria). It has maintained a strong and steady annual earnings (A criteria) history. Fundamentally, its sales revenues and earnings increases have been strong in the most recent quarterly comparisons, above the +25% guideline (C criteria). Return On Equity is reported at 32%, well above the 17% minimum.
|
Ctrip.com Intl Ltd ADR |
| |
|
Ticker Symbol: CTRP (NASDAQ) |
Industry Group: Leisure-Services |
Shares Outstanding: 141,900,000 |
|
Price: $40.74 2:39PM ET 3/25/10 |
Day's Volume: 3,110,900 3/25/2010 2:39PM 3/25/10 |
Shares in Float: 136,200,000 |
|
52 Week High: $40.49 3/09/2010 |
50-Day Average Volume: 2,184,600 |
Up/Down Volume Ratio: 1.4 |
|
Pivot Point: $39.40 12/03/09 high plus .10 |
Pivot Point +5% = Max Buy Price: $41.37 |
Web Address: http://www.ctrip.com |
C A N S L I M | StockTalk | News | Chart | SEC | Zacks Reports |
View all notes | Alert me of new notes | CANSLIM.net Company Profile
CANSLIM.net Profile: Ctrip.com International, Ltd. (CTRP), together with its subsidiaries, provides travel services for hotel accommodations, airline tickets, and packaged tours in China. It also sells independent leisure travelers bundled package-tour products, which include transportation and accommodations, as well as guided tours covering various domestic and international destinations. The company was founded in 1999 and is headquartered in Shanghai, the People's Republic of China. The stock resides in the Leisure-Services group which is presently ranked 19 on the 197 Industry Groups list which is in the much-preferred top quartile of groups, easily satisfying the L criteria. The number of top-rated funds with an ownership interest has grown from 52 funds in Mar '09 to 127 funds as of Dec '09, a sign of increasing institutional interest (the I criteria). It has maintained a strong and steady annual earnings (A criteria) history. Fundamentally, its sales revenues and earnings increases have been strong in the 3 most recent quarterly comparisons and solidly above the +25% guideline (C criteria). Return On Equity is reported at 32%, well above the 17% minimum.
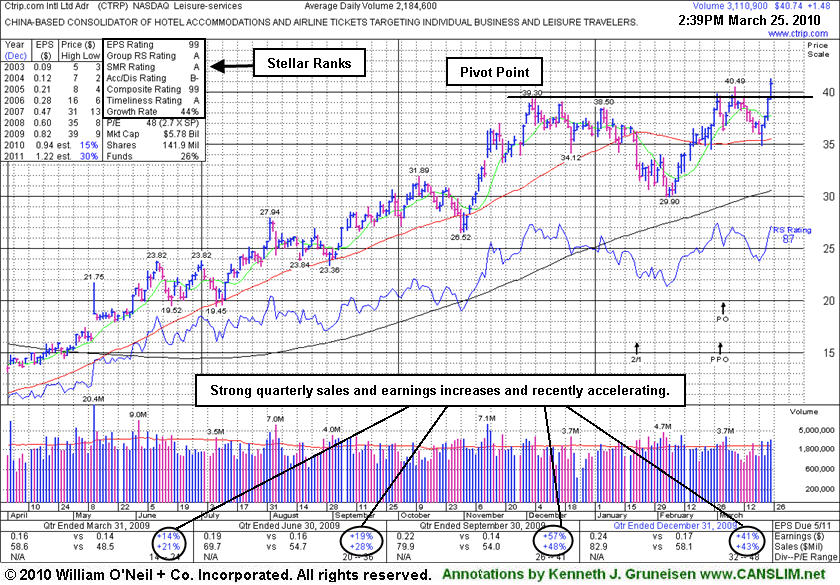
What to Look For and What to Look Out For: Look for the stock to offer investors a chance to accumulate shares within 5% of its prior chart highs. Keep in mind that much of a stock's success depends on the broader market's ability to sustain a meaningful rally without encountering more damaging distributional pressure. It is very important for the stock's pullback to be contained, whereas a violation of its $38.50 pivot point would have the effect of technically negating its latest breakout, raising concerns. Conversely, if the stock finds support near/above its pivot point then begins advancing again, preferably on higher volume, then odds would favor that higher prices will follow.
Technical Analysis: It had rallied on average volume to a new 52-week high when featured in the March 2010 issue of CANSLIM.net News (read here), however it failed to immediately follow through with confirming gains above its pivot point with sufficient volume to trigger a technical buy signal. Meanwhile, the broader market action (M criteria) turned definitively more bullish with a follow-through-day (FTD) and an increase in the number of stocks making it to Breakouts Page. CTRP went on to consolidate above its 50-day moving average (DMA) line. Its latest appearance in the Featured Stock Update section on 3/18/10 under the headline " Recent Offering And Split Increased Supply of Shares" an annotated graph included the reminder "it is important to remain disciplined. It could be accumulated under the investment system guidelines only if a proper technical buy signal occurs. The stock did not trigger a technical buy signal and only encountered resistance since the "double bottom" type base was identified." There is no overhead supply now to act as resistance. Ideally, one would like to see significant volume show up and a strong close to confirm a proper technical buy signal based upon a solid gain above its new pivot point illustrated above.
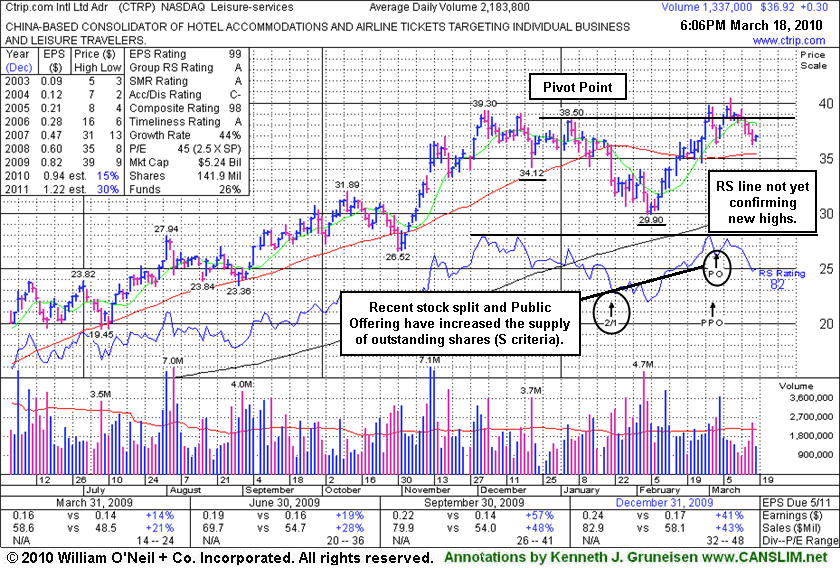
Ctrip.com Int'l Ltd. (CTRP +0.30 or +0.82% to $36.92) halted its slide today with a small gain on light volume following 5 consecutive losses. It has been slumping below its pivot point toward its 50-day moving average (DMA) line. A gain above its pivot point or its most recent chart highs is still needed to confirm a fresh technical buy signal with +50% above average volume or more. Any subsequent slump below its 50-day moving average (DMA) line would raise concerns and trigger technical sell signals.
It completed an offering of additional shares on 3/03/10, shortly after it was featured under the headline "Leisure Services Firm Building Double Bottom Base" in the March 2010 issue of CANSLIM.net News. That offering, and a recent 2:1 stock split, had the effect of increasing the supply of shares outstanding (S criteria) for this high-ranked China-based firm in the strong-performing Leisure - Services industry. It has maintained a strong and steady annual earnings (A criteria) history. Fundamentally, its sales revenues and earnings increases have been strong in the 3 most recent quarterly comparisons and solidly above the +25% guideline (C criteria). Another very encouraging sign with respect to the investment system guidelines is that the number of top-rated funds owning its shares increased from 51 in Mar '09 to 126 in Dec '09, which helps satisfy the I criteria. Return On Equity is reported at 32%, well above the 17% minimum.
While the stock is currently trading within close striking range of its pivot point and all-time highs it is important to remain disciplined. It could be accumulated under the investment system guidelines only if a proper technical buy signal occurs. The stock did not trigger a technical buy signal and only encountered resistance since the "double bottom" type base was identified and it returned to the Featured Stocks list. Now it faces some resistance up through the $39-40 area, yet it does not have a lot of overhead supply to hinder its progress. Patient and disciplined investors will avoid the temptation to get in "early" and be on the watch for a fresh indication that more serious institutional accumulation is taking place which could lead to a sustainable advance into new high ground.
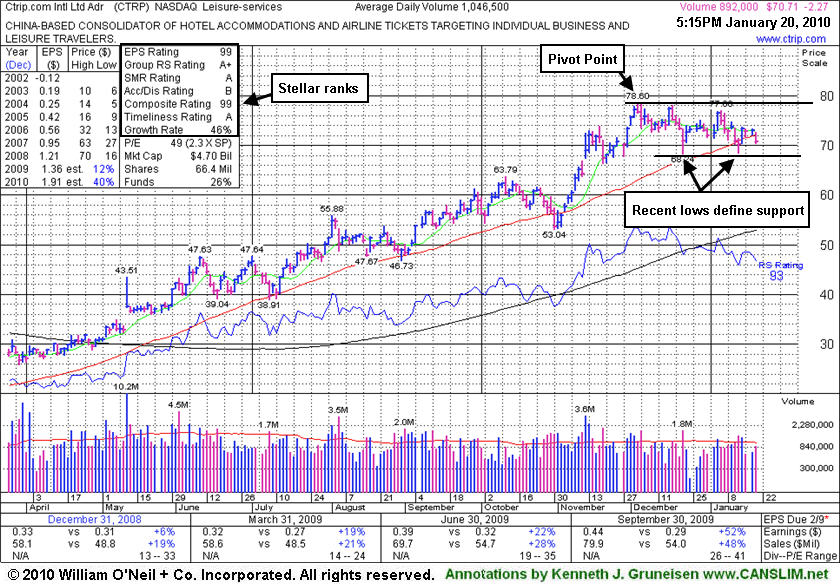
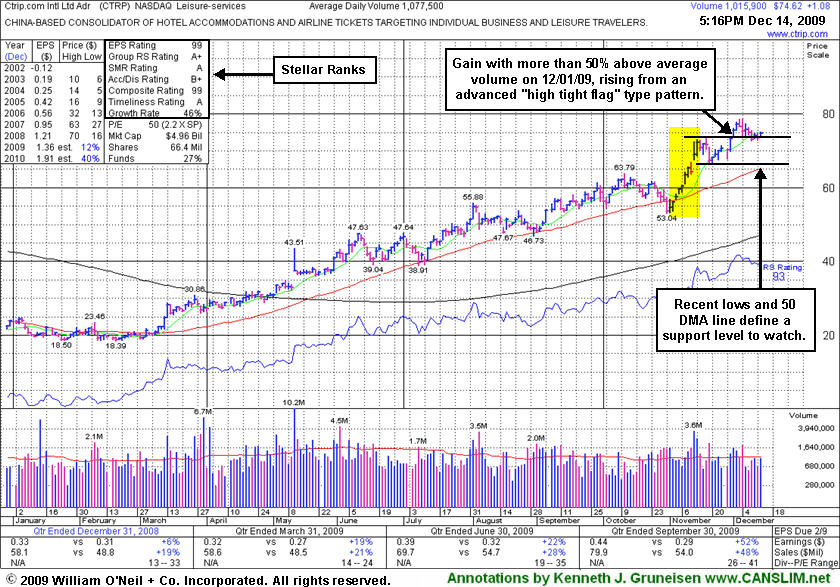
Ctrip.com International (CTRP -$2.27 or -3.11% to $70.71) slumped today and its loss on lighter than average volume led to another close under its 50-day moving average (DMA) line. Its color code was changed to yellow based on recent resilience near that important short-term average, however deterioration under its recent chart lows in the $68 area would raise more serious concerns and trigger technical sell signals. It encountered distributional pressure after it was featured n 12/01/09 in yellow in the mid-day report (read here), yet it admirably held its ground near its 50 DMA line . Fundamentally, its sales revenues and earnings increases have shown acceleration in the 3 most recent quarterly comparisons and rose solidly above the +25% guideline in the latest period ended September 30, 2009.
A follow-up study on 12/29/08 included an annotated graph under the headline "Disciplined Investors Avoided This Trip To The House Of Pain." That was well after if was dropped from the Featured Stocks list on 6/10/09 based on weak technical action when it closed at $49.84. Technically, it has rebounded very impressively from subsequent lows in the $16 area. It has maintained a strong and steady annual; earnings (A criteria) history. Fundamentals have shown greater sales revenues and earnings increases in the most current quarterly comparisons (C criteria), which is a very encouraging sign. The number of top-rated funds owning its shares increased from 52 in Mar '09 to 119 in Dec '09, which helps satisfy the I criteria.
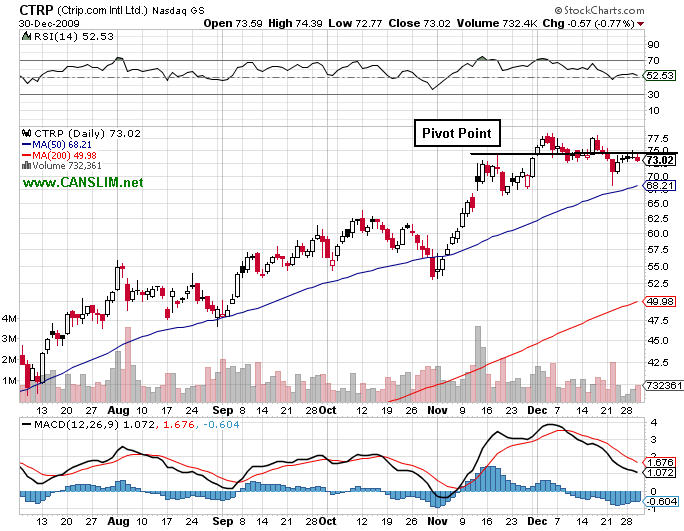
Ctrip.com International (CTRP -$0.57 or -0.77% to $73.02) posted a small loss today on lighter than average volume. Last week's slump under its pivot point raised concerns while falling on higher volume toward its 50-day moving average (DMA) line - its next important chart support level. Near its pivot point now, it encountered some distributional pressure when recently rallying above its "max buy" price of $77.60. Featured on 12/01/09 in yellow in the mid-day report (read here). It triggered a technical buy signal as it rose with more than +50% above average volume from a brief consolidation resembling a "high-tight-flag" pattern which it formed after repairing a late-October breach of its 50 DMA line and sprinting considerably higher. Fundamentally, its sales revenues and earnings increases have shown acceleration in the 3 most recent quarterly comparisons and rose solidly above the +25% guideline in the latest period ended September 30, 2009.
A follow-up study on 12/29/08 included an annotated graph under the headline "Disciplined Investors Avoided This Trip To The House Of Pain." That was well after if was dropped from the Featured Stocks list on 6/10/09 based on weak technical action when it closed at $49.84. Technically, it has rebounded very impressively from subsequent lows in the $16 area. It has maintained a strong and steady annual; earnings (A criteria) history. Fundamentals have shown greater sales revenues and earnings increases in the most current quarterly comparisons (C criteria), which is a very encouraging sign. The number of top-rated funds owning its shares increased from 52 in Mar '09 to 114 in Dec '09, which helps satisfy the I criteria.
A FRESH ANNOTATED DAILYGRAPH WILL BE ADDED FOR THIS STOCK SOON. CHART SERVICE IS CURRENTLY IN USE FOR TONIGHT'S Q4 WEBCAST "HOW TO NAVIGATE DURING VOLATILE TIMES" DO NOT MISS YOUR OPPORTUNITY TO ATTEND OR VIEW THE PRESENTATION ON-DEMAND AT A CONVENIENT TIME.
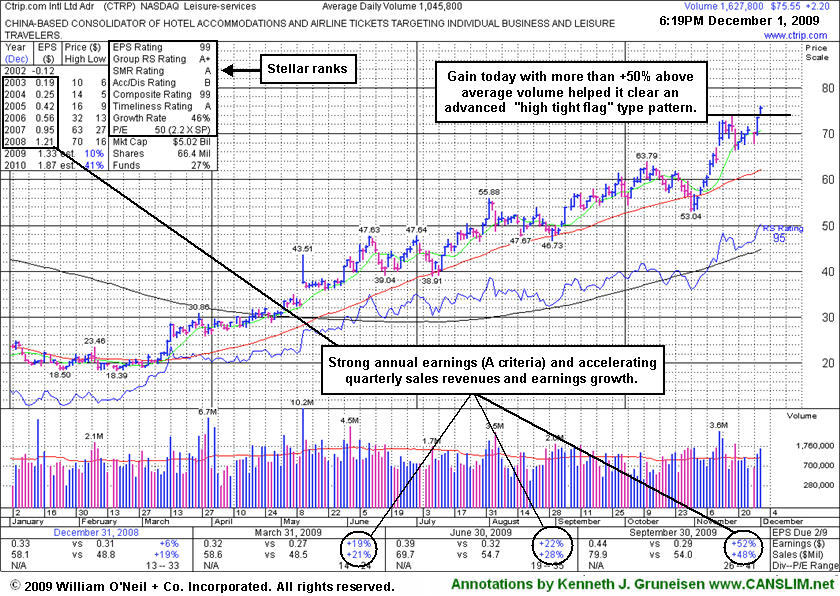
Ctrip.com International (CTRP +$1.08 or +1.47% to $74.62) posted a gain today on average volume. Near its pivot point now, it encountered some distributional pressure when recently rallying above its "max buy" price of $77.60. Featured on 12/01/09 in yellow in the mid-day report (read here). It triggered a technical buy signal as it rose with more than +50% above average volume from a brief consolidation resembling a "high-tight-flag" pattern which it formed after repairing a late-October breach of its 50 DMA line and sprinting considerably higher. Fundamentally, its sales revenues and earnings increases have shown acceleration in the 3 most recent quarterly comparisons and rose solidly above the +25% guideline in the latest period ended September 30, 2009.
A follow-up study on 12/29/08 included an annotated graph under the headline "Disciplined Investors Avoided This Trip To The House Of Pain." That was well after if was dropped from the Featured Stocks list on 6/10/09 based on weak technical action when it closed at $49.84. Technically, it has rebounded very impressively from subsequent lows in the $16 area. It has maintained a strong and steady annual; earnings (A criteria) history. Fundamentals have shown greater sales revenues and earnings increases in the most current quarterly comparisons (C criteria), which is a very encouraging sign. The number of top-rated funds owning its shares increased from 52 in Mar '09 to 114 in Dec '09, which helps satisfy the I criteria.
Ctrip.com International (CTRP +$2.20 or +3.00% to $21.51) gapped up today and was highlighted in yellow in the mid-day report (read here) as it hit a new all-time high. It triggered a technical buy signal as it rose with more than +50% above average volume from a brief consolidation resembling a "high-tight-flag" pattern, an advanced chart pattern which it formed after repairing a late-October breach of its 50-day moving average (DMA) line and sprinting higher. Fundamentally, its sales revenues and earnings increases have shown acceleration in the 3 most recent quarterly comparisons and rose solidly above the +25% guideline in the latest period ended September 30, 2009.
The stock's last appearance in this section was actually a follow-up study on 12/29/08 that included an annotated graph under the headline "Disciplined Investors Avoided This Trip To The House Of Pain." That was well after if was dropped from the Featured Stocks list on 6/10/09 based on weak technical action when it closed at $49.84. Technically, it has rebounded very impressively from subsequent lows in the $16 area. It has maintained a strong and steady annual; earnings (A criteria) history. Fundamentals have shown greater sales revenues and earnings increases in the most current quarterly comparisons (C criteria), which is a very encouraging sign. The number of top-rated funds owning its shares increased from 52 in Mar '09 to 112 in Dec '09, which helps satisfy the I criteria.
In recent weeks we have taken the opportunity to use this section to revisit some of the previously featured stocks that were dropped some time ago based on technical weakness, and later developed fundamental concerns. Studying what happened afterwards should hopefully allow investors to get a better understanding of the importance of having a sell discipline. Limiting losses while they are small is critically important to your success, and this investment system's rule is to always sell a losing stock after it falls more than 7-8% from your buy price. These well-known, high-profile companies serve now as perfect examples that will hopefully allow investors in the future to recognize the warning signs and technical sell signals so they will know when it is time to lock in profits or minimize losses per the investment system's sell rules.
Ctrip.com International (CTRP +$0.52 or +2.48% to $21.51) now faces a tremendous amount of resistance due to overhead supply, making it unlikely to be a market leader in the near term. Investors who ignored earlier technical sell signals now have more serious concerns. Why? Because its fundamentals are weakening! Sequentially, its quarterly comparisons against the year ago period show a pattern of ongoing deceleration in its sales revenues and earnings growth. Now, the latest quarter ended September 30, 2008 comparison showed only a +12% earnings increase, under the investment system's +25% minimum guideline for the first time in years.
Following its last appearance in CANSLIM.net's 5/07/08 After Market Update under the headline "Chinese Online Travel Stock Retests Prior Highs" (read here), concerns soon started to mount. First it fell into its prior base, then it violated its 50 & 200-day moving average (DMA) lines while encountering persistent distributional pressure. Very weak technical action was noted repeatedly, and it was dropped from the Featured Stocks list on 6/10/08. It has since traded as much as -67.07% lower, making it worthy of one of Mr. Cramer's "house of pain" references.
CTRP was first featured on Monday, October 29, 2007 in the CANSLIM.net Mid Day Breakouts Report (read here).
View all notes | Alert me of new notes | CANSLIM.net Company Profile
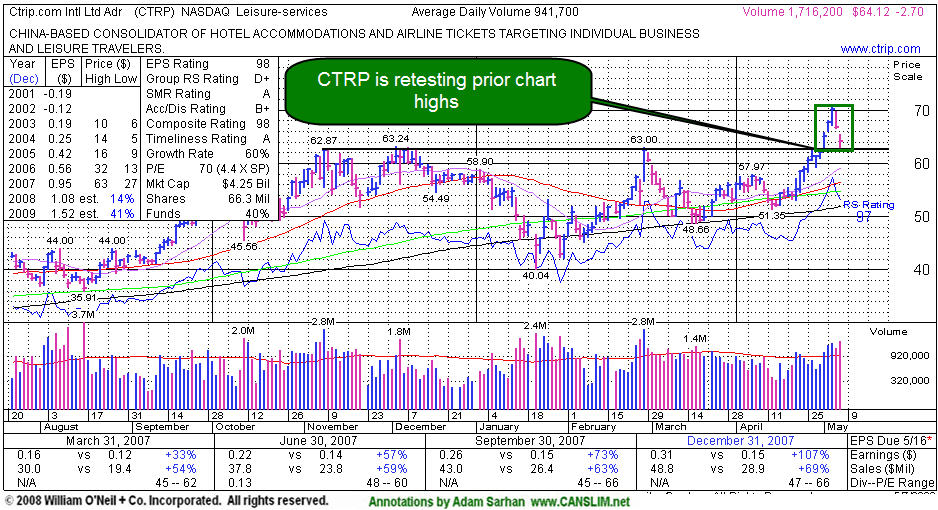
Ctrip.com Intl Ltd. (CTRP DOWN ($2.70) or -4.40% to $64.12) gapped down as it continued pulling back towards its prior chart highs and pivot point. CTRP sports very strong ranks; its Earnings Per Share (EPS) is a 98 and it Relative Strength (RS) rating is a 97. The number of top-rated funds owning an interest rose from 48 in Jun '07 to 95 in Mar '08, which shows increasing institutional demand (the I criteria). Concerns would be raised by any weakness leading to a close under its old chart highs near $62-63 area which would have the effect of technically negating its latest breakout.
This stock was recently featured in the May 2008 issue of CANSLIM.net News (read here) with a $63.10 pivot point and a $66.26 maximum price. Within a few days, the stock quickly jumped +12% above its pivot point. Then it pulled back and is currently trading below its maximum buy price which means that CTRP is currently offering investors another chance to accumulate this stock within the proper guidelines. Always limit losses per the 7-8% sell rule, and never hold a stock if it falls more than that from your purchase price.
C A N S L I M | StockTalk | News | Chart | SEC | Zacks Reports | ![]()
![]()
![]()
View all notes | Alert me of new notes | CANSLIM.net Company Profile
|
Ctrip.com Int'l Ltd |
||
|
Ticker Symbol: CTRP (NASDAQ) |
Industry Group: Leisure- services |
Shares Outstanding: 66,300,000 |
|
Price: $62.06 4/30/2008 4:00PM ET |
Day's Volume: 665,300 4/30/2008 4:00PM |
Shares in Float: 50,400,000 |
|
52 Week High: $63.24 12/04/2007 |
50-Day Average Volume: 875,900 |
Up/Down Volume Ratio: 1.1 |
|
Pivot Point: $63.10 2/28/2008 high plus .10 |
Pivot Point +5% = Max Buy Price: $66.26 |
Web Address: http://www.ctrip.com/ |
CANSLIM.net Profile: Ctrip.com International, Ltd. and its subsidiaries provide travel related services including hotel reservation, air-ticketing, packaged-tour services, as well as Internet advertising and other related services. It sells air tickets for Chinese airlines, including Air China, China Eastern Airlines, China Southern Airlines, and Shanghai Airlines, as well as international airlines operating flights originating from cities in China, such as United Airlines, Northwest Airlines, Air Canada, DragonAir, and Lufthansa. The company also offers independent leisure travelers bundled packaged-tour products, which include air-ticketing and hotel reservations; sells travel guidebooks, which provide information for independent travelers; VIP membership cards that allow cardholders to receive discounts from restaurants, clubs, and bars. The company markets its products and services through on-site promotions, cross-marketing, online marketing, and advertising. The company was founded in 1999 and is based in Shanghai, the People's Republic of China. CTRP resides in the the Medical-products group which is presently ranked 144th on the 197 Industry Groups list. However, there are several other high-ranked stocks that reside in this group which help overcome this shortfall. There were 48 top-rated funds with an ownership interest in Jun '07, yet that number jumped to 94 as of March '08, offering a very strong sign of increasing institutional interest (I criteria). Also, the stock has 50 million shares in the float, and having a small supply of shares is a characteristic that most of the greatest stock market winners exhibited before they enjoyed explosive moves up. Its quarterly and annual earnings growth history is strong, easily satisfying both the "C" and "A" criteria.
What to Look For and What to Look Out For: Look for the stock to confirm a new technical buy signal by breaking out and closing above its $63.10 pivot point with gains on heavy volume in the coming days and weeks. Remember that buyable breakouts require three important components: the stock must clear its pivot point with considerable gains, those gains must be backed by at least +50% above average volume, and the overall market environment be in a confirmed rally. The market environment is healthy, but two missing components are price and volume. Deterioration under its recent chart highs near $58 would raise concerns, and a breach of its 50-day moving average (DMA) line or upward trendline (both near $55 now) would be technical sell signals. As always, it is of the utmost importance to sell a stock if it drops 7-8% below your purchase price. The small supply of outstanding shares could lead to dramatic price volatility, especially if the institutional crowd rushes in or out. This high-ranked leader should remain on an active watch list and could be considered as a new buy candidate in the event it closes above its pivot point on the necessary volume needed to trigger a technical buy signal.
Technical Analysis: CTRP is currently forming the right side of a 6-month base. The stock found support near its 200-day moving average (DMA) line during the market's correction in January and afterward. It is now trading very near its pivot point on healthy volume patterns, with little resistance remaining due to overhead supply. There has been virtually no sign of institutional selling (distribution) which is a healthy sign.
Often, when a leading stock is setting up to breakout of a solid base it is highlighted in CANSLIM.net's Mid-Day Breakouts Report. The most relevant factors are noted in the report which allows prudent CANSLIM oriented investors to place the issue in their watch list. After doing any necessary backup research, the investor is prepared to act if and when the stock triggers a technical buy signal (breaks above its pivot point on more than +50% average turnover). In the event the stock fails to trigger a technical buy signal and its price declines then it will simply be removed from the watch list.
Ctrip.com International Ltd. -$1.72 or -2.92% to $60.62) ended lower on above average volume today, yet this high-ranked leader remains perched just below its pivot point. Ctrip.com has shown solid earnings growth and accelerating sales revenues growth in recent quarterly comparisons, and it also has a great annual earnings growth history that helps to satisfy the C and A criteria. CTRP sports very healthy ranks, and it faces no formidable resistance due to overhead supply. Its Earnings Per Share (EPS) rank stands at a firm 98 and its Relative Strength (RS) rating is a solid 97. The number of top-rated funds owning an interest in its shares rose from 61 in Mar '07 to 88 in Dec '07, helping to satisfy the I criteria.
This stock was first featured on Monday, October 29, 2007 in the CANSLIM.net Mid Day Breakouts Report (read here) with a $54.81 pivot point and a $57.55 maximum buy price. Initially the stock rallied +15% before suffering a harsh pullback during the January market corrrection. Based on weak technical action it was dropped from the Featured Stocks list on 1/15/2008, and it subsequently traded more than -10% lower and briefly violated its 200 DMA before finding support and recovering. In recent weeks it rallied back up from its 200-day moving average (DMA) line and climbed back above its 50 DMA line. It is now challenging prior chart highs in the $63 area while working on the right side of a 13-week cup shaped base pattern. The stock may form a handle and eventually break out again, so new pivot point and max buy prices were noted. On Thursday, February 28, 2008 this stock was featured in the CANSLIM.net Mid Day Breakouts report (read here) with a new $63.44 pivot point and a $66.51 maximum buy price. It has yet to actually close above its pivot point with a gain on at least +50% above average volume. So, confirming gains are still needed to trigger a convincing technical buy signal. At this point, the stock should remain on an active watchlist until a new technical buy signal is triggered. Proper discipline requires investors to sell if any stock falls 7-8% from their buy price, as that is the only way to eliminate the chance of even larger losses occurring.
C A N S L I M | StockTalk | News | Chart | SEC | Zacks Reports | ![]()
![]()
![]()
View all notes | Alert me of new notes | CANSLIM.net Company Profile
Volume is a vital component of technical analysis. Prudent investors that incorporate volume into their stock analysis have often benefited several fold. Ideally, healthy stocks will more often tend to rise on higher volume and pullback on lighter volume. Volume is a great proxy for institutional sponsorship. Conversely, high volume declines can be an ominous, as this usually signals distribution and further price deterioration are more likely to follow.
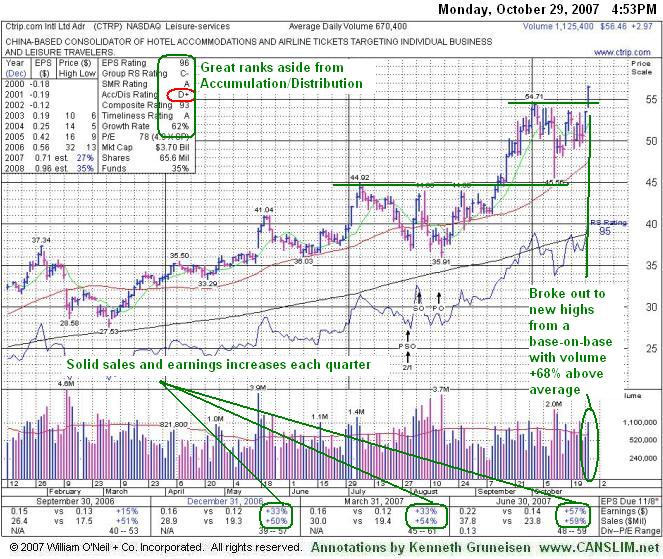
Ctrip.com International Ltd. (CTRP +$2.97 or +5.55% to $56.46) gapped higher today, rallying to a fresh all-time high with gains backed by enough volume to trigger a proper technical buy signal. CTRP's healthy action helped it appear in yellow in today's (October 29, 2007) CANSLIM.net Mid Day Breakouts Report (read here) with a $54.81 pivot point and a $57.55 maximum buy price and the following note: "Y - Solid sales revenues and earnings growth history (good C and A). Rising from a base-on-base type chart pattern with volume running at an above average pace as it hits new all-time highs. Recently completed additional share offerings. Number of top-rated funds owning an interest has been shrinking from 81 in Sept '06 to 53 in Sept '07. Due to report earnings on Nov 7, 2007."
Ctrip.com sports a very healthy Earnings Per Share (EPS) rating of 96 and a Relative Strength (RS) rating of 95. It resides in the Leisure- services group which is currently ranked 134th of out the 197 industry groups listed in the paper, outside the much coveted top quartile group needed to satisfy the L criteria. However, other strong stocks like Lifetime Fitness (LTM), VCG Holdings (PTT) and Vail Resorts (MTN) are near their 52-week highs and helping demonstrate group leadership to overcome this shortfall and satisfy the L criteria. Prior chart resistance in the $53-$54 area (its Sept-Oct highs) will likely act as support in the future. The stock is currently trading below its $57.55 maximum buy price, which still makes this high-ranked leader buyable under the guidelines. Disciplined investors know to avoid buying stocks extended above the maximum buy point, because doing so is considered "chasing" and typically hinders performance. As long as the most recent breakout is not negated with a damaging loss and close back under its prior high closes, odds favor even further gains.
C A N S L I M | StockTalk | News | Chart | SEC | Zacks Reports | ![]()
![]()
![]()
View all notes | Alert me of new notes | CANSLIM.net Company Profile