While it may repair the damage promptly and act better in the future, the fundamental and technical flaws for this high-ranked Computer Software - Enterprise firm are adding up to be more serious concerns. It will be dropped from the Featured Stocks list tonight. The increase in institutional (I criteria) ownership has been encouraging in the past, and the number of top-rated funds owning its shares rose from 283 in Sep '09 to 339 in Jun '10. CRM traded up as much as +162.67% since featured in a Stock Bulletin on 8/16/09 under the headline "Forces Have Been Favorable For Software Services Firm."
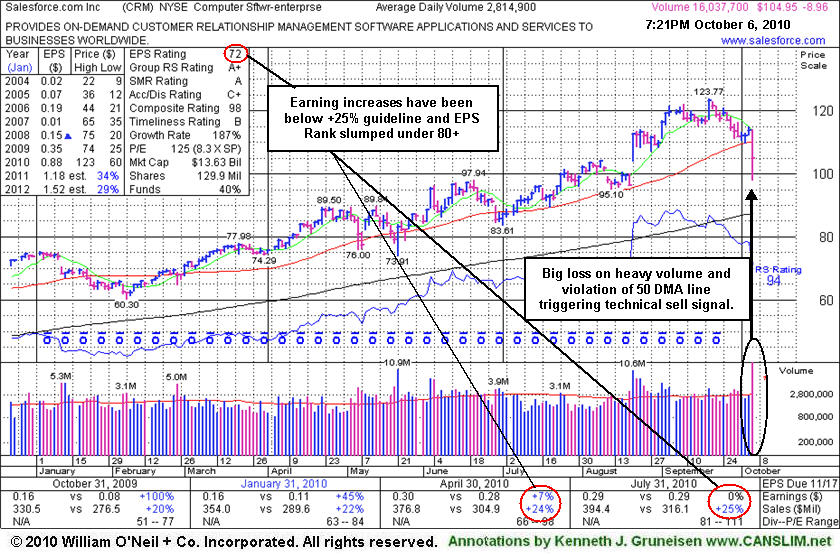
Salesforce.com, Inc. (CRM -$0.61 or -0.63% to $96.63) endured distributional pressure last week and slumped under prior highs near $97 while nearly testing support at its 50-day moving average (DMA) line. A patent infringement suit brought by Microsoft Corp. has been settled since its last appearance in this FSU section on 7/15/10 when we observed - "Those with open positions might choose to give it the benefit of the doubt until a more worrisome technical sell signal might raise greater concerns." Healthy stocks typically find support near their short-term 50-day average as institutional investors add to existing holdings, so any subsequent 50 DMA violation would raise greater concerns and might prompt more investors to lock in hard fought gains.
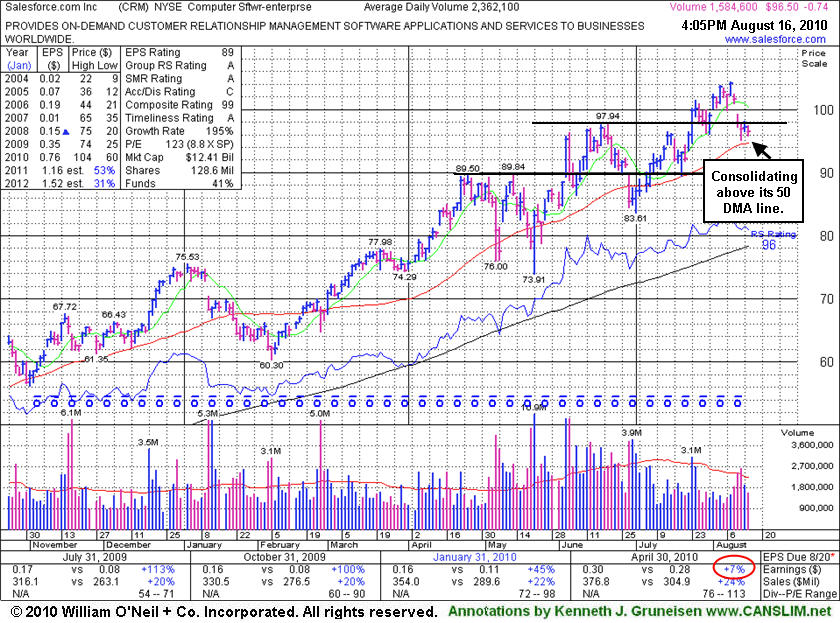
Concerns were raised by its weaker earnings, now making it a fundamentally questionable candidate for additional buying efforts. For the quarter ended April 30, 2010 it showed only a +7% earnings per share increase, a difficult comparison marking its first increase below the +25% minimum guideline in years. New (or add-on) buying efforts might not be appropriate because of that fundamental flaw for this high-ranked Computer Software - Enterprise firm. The increase in institutional (I criteria) ownership has been encouraging in the past, and the number of top-rated funds owning its shares rose from 283 in Sep '09 to 336 in Jun '10. CRM traded up +121.65% since featured in a Stock Bulletin on 8/16/09 under the headline "Forces Have Been Favorable For Software Services Firm."
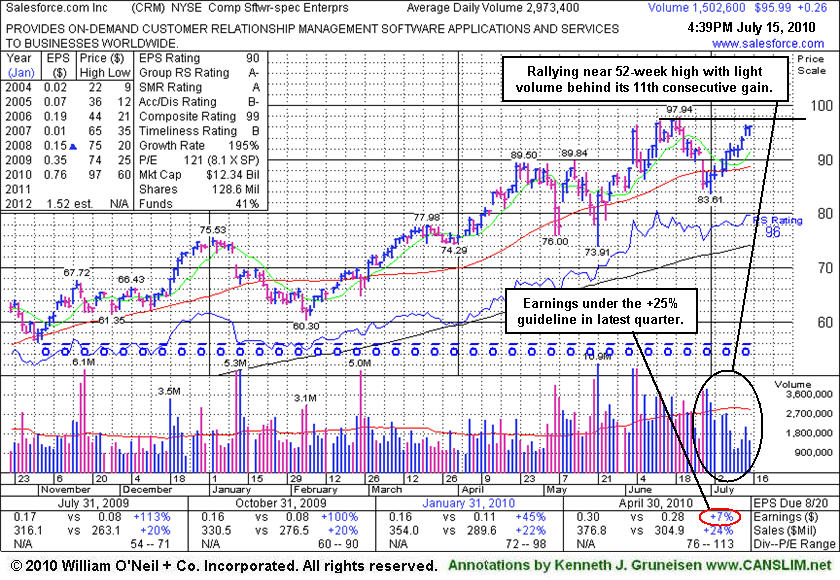
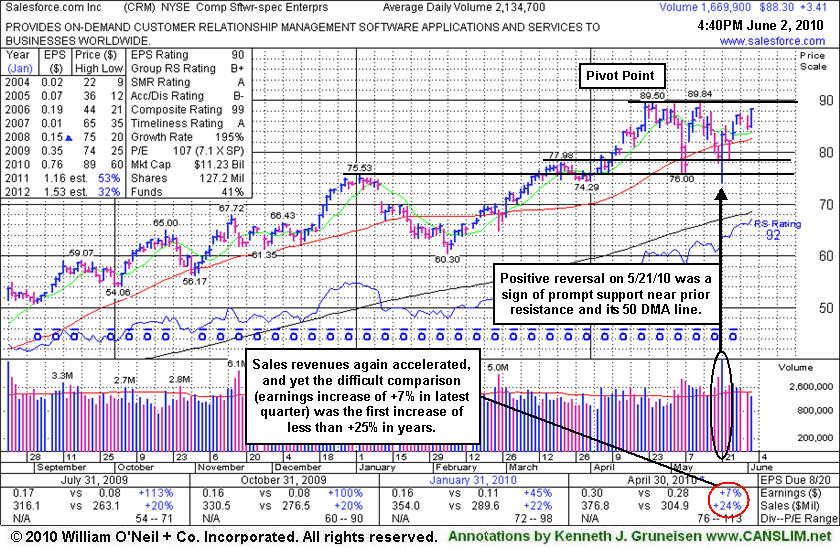
Salesforce.com, Inc. (CRM +$0.26 or +0.27% to $95.99) is approaching its 52-week high with volume totals light while posting an 11th consecutive gain. Although it has been working on building a new base, concerns have been raised by its weaker earnings, making it a questionable candidate for additional buying efforts. It found support after briefly undercutting its 50-day moving average (DMA) line. CRM traded up +108% since featured in a Stock Bulletin on 8/16/09 under the headline "Forces Have Been Favorable For Software Services Firm."
For the quarter ended April 30, 2010 it showed only a +7% earnings per share increase, a difficult comparison marking its first increase below the +25% minimum guideline in years, raising some concern especially while sales revenues again showed mild acceleration. New (or add-on) buying efforts might not be appropriate because of that fundamental flaw for this high-ranked Computer Software - Enterprise firm. Meanwhile those with open positions might choose to give it the benefit of the doubt until a more worrisome technical sell signal might raise greater concerns. The increase in institutional (I criteria) ownership has been encouraging in the past, and the number of top-rated funds owning its shares rose from 283 in Sep '09 to 328 in Jun '10.
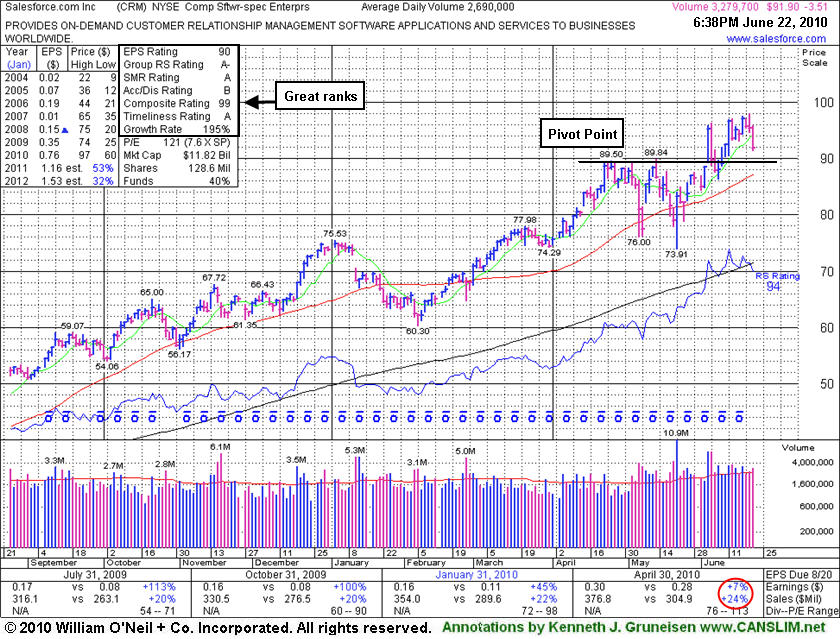
Salesforce.com, Inc. (CRM -$3.51 or -3.68% to $91.90) marked its 3rd consecutive loss and volume was higher and +23% above average while it fell toward its old pivot point. Prior highs in the $89 area are an important support level to watch above its 50-day moving average (DMA) line. CRM traded up +108% since featured in a Stock Bulletin on 8/16/09 under the headline "Forces Have Been Favorable For Software Services Firm." A fresh Stock Bulletin was published today on another new high-ranked leader that appears to be a more timely buy candidate for consideration. Active members who may have missed it click here.
For the quarter ended April 30, 2010 it showed only a +7% earnings per share increase, a difficult comparison marking its first increase below the +25% minimum guideline in years, raising some concern especially while sales revenues again showed mild acceleration. New (or add-on) buying efforts might not be appropriate because of that fundamental flaw for this high-ranked Computer Software - Enterprise firm. Meanwhile those with open positions might choose to give it the benefit of the doubt until a more worrisome technical sell signal might raise greater concerns. The increase in institutional (I criteria) ownership has been encouraging in the past, however the number of top-rated funds owning its shares fell from 324 in Dec '09 to 316 in Mar '10.
Salesforce.com, Inc. (CRM +$3.55 or +4.18% to $88.44) posted a gain today as it quietly closed just -1.6% from its all-time high. Its color code was changed to yellow with new pivot point cited based on its 4/26/10 high plus ten cents. Recent gains including its positive reversal on 5/21/10 are signs of institutional support recently showing up near its 50-day moving average (DMA) line and prior highs. For the quarter ended April 30, 2010 it showed only a +7% earnings per share increase, a difficult comparison marking its first increase below the +25% minimum guideline in years, raising some concern even while sales revenues again showed mild acceleration.
It has been consolidating since a negative reversal after briefly reaching a new all-time high on 5/13/10. The increase in institutional (I criteria) ownership has been encouraging in the past, however the number of top-rated funds owning its shares fell from 325 in Dec '09 to 310 in Mar '10. Market conditions (M criteria) remain questionable after today's follow-through-day (FTD) of meaningful gains from the major averages unfortunately lacked the necessary expansion in volume while there were also very few new leaders hitting new 52-week highs helping to confirm a healthier market environment for stock investors. Some more encouraging signs that institutional buying demand is picking up would be a welcome reassurance to see in the days ahead.
New (or add-on) buying efforts might be considered appropriate if the market gets a solid FTD and this high-ranked Computer Software - Enterprise firm eventually triggers a new technical buy signal with a gain and close above its latest pivot backed by heavy volume more than +50% above average. CRM traded up +87.69% since featured in a Stock Bulletin on 8/16/09 under the headline "Forces Have Been Favorable For Software Services Firm."
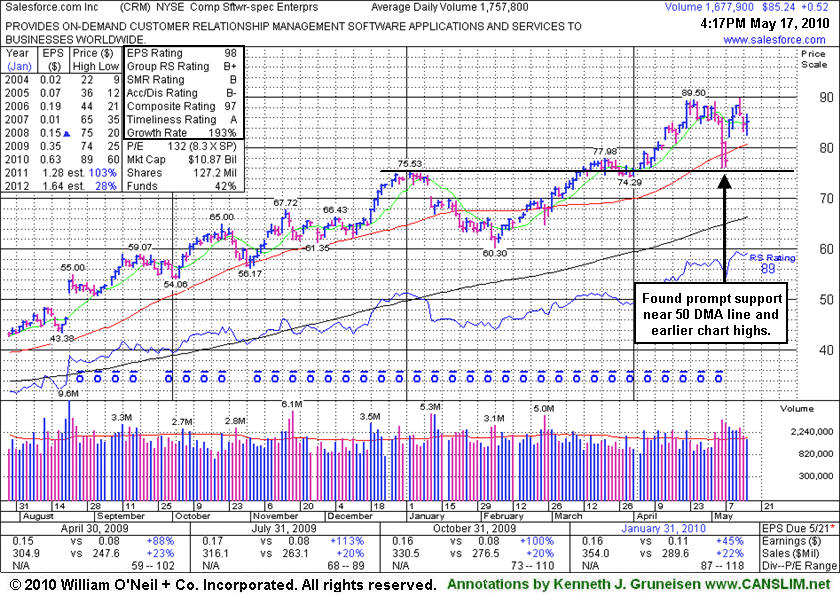
Salesforce.com, Inc. (CRM +$0.52 or +0.61% to $85.24) is holding its ground above its 50-day moving average (DMA) line following a negative reversal after reaching a new all-time high on 5/13/10. Its gap up on 5/10/10 promptly repaired a brief violation of its 50 DMA line, a sign of great institutional support, however more time is needed to see if it may form a more reliable base-on-base pattern. The current market (M criteria) conditions have been calling for investors to lock in gains and raise cash. Caution is advised until a new rally with follow-through-day from one of the major indices confirms a healthier market environment, as the current market correction could last longer and cause more technical damage.
New (or add-on) buying efforts might be considered appropriate under the investment system guidelines when at some future point this high-ranked Computer Software - Enterprise firm eventually forms a new sound base. It has traded up +80.56% since featured in a Stock Bulletin on 8/16/09 under the headline "Forces Have Been Favorable For Software Services Firm." The increase in institutional (I criteria) ownership has been encouraging in the past, however the number of top-rated funds owning its shares fell from 325 in Dec '09 to 309 in Mar '10.
Salesforce.com, Inc. (CRM +$0.60 or +0.71% to $85.08) has rallied +17.7% higher since its appearance in the FSU section on 3/05/10 with an annotated weekly graph under the headline "Perched Near Historic Highs Awaiting New Buy Signal. Today's gain on below average volume helped it hit a new all-time high, extended from prior chart highs and well above its "max buy" level. Disciplined investors require definitive proof of heavy volume institutional buying demand before taking action on sound buy candidates, and they do not chase stocks that are too extended from a sound base.
It is fair to say that CRM technically "wedged" to new highs from a cup-with-high-handle type pattern. Volume totals were below the investment system guidelines as it rallied above its latest pivot point. A proper technical buy signal requires a minimum of +50% above average volume. The market's biggest winners usually had volume spike up many times the stock's average trading total as a breakout to new highs signaled the beginning of a substantial rally much higher in price.
New (or add-on) buying efforts might be considered appropriate under the investment system guidelines when at some future point this high-ranked Computer Software - Enterprise firm eventually forms a new sound base. It has traded up +80.56% since featured in a Stock Bulletin on 8/16/09 under the headline "Forces Have Been Favorable For Software Services Firm." Light volume pullbacks near prior chart highs or its 10-week average could provide patient investors a chance to accumulate shares at an advantageous level near chart support. The increase in institutional (I criteria) ownership has been encouraging in the past, however the number of top-rated funds owning its shares fell from 325 in Dec '09 to 305 in Mar '10.
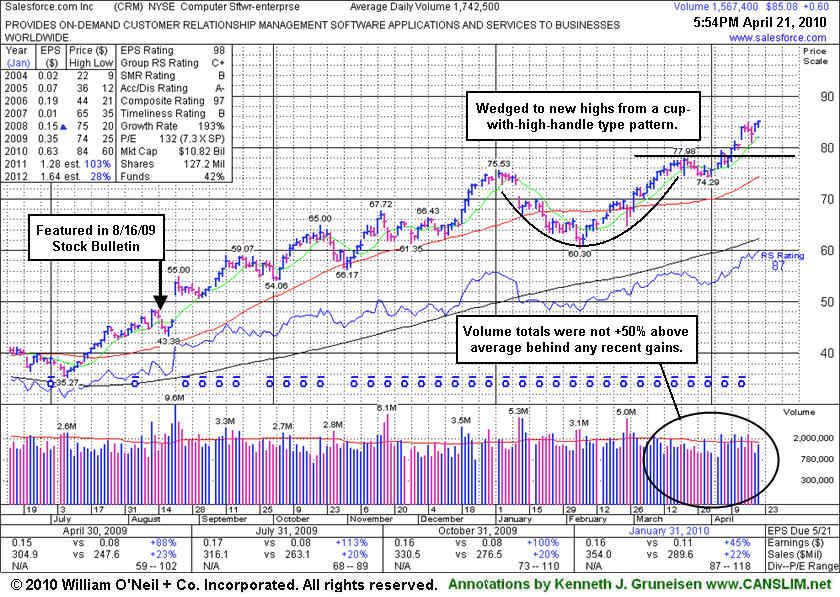
Salesforce.com, Inc. (CRM -$0.19 or -0.25% to $75.97) fell today for a third consecutive small loss on below average volume. It is consolidating above prior chart highs in the $75 area after recently wedging to new highs. It rose from its latest cup shaped base without the required volume to trigger a proper new technical buy signal, and it could form a cup-with-high-handle type pattern now. Meanwhile, any subsequent deterioration leading to a close under its prior significant high close ($74.82) from 1/04/10 would raise concerns by completely negating its recent gains into new high ground and falling squarely back into its prior base. Typically a stock drifts 10-12% lower on light volume as a proper handle is formed. In this case, that could mean another pullback near its 50-day moving average line. Disciplined investors do not buy stocks "early" as they are forming a "handle" or "setting up", they wait for fresh definitive proof of heavy volume institutional buying demand before taking action on a sound buy candidates.
An annotated weekly graph was included with its 3/05/10 appearance in this Featured Stock Update section under the headline "Perched Near Historic Highs Awaiting New Buy Signal." Patience and discipline are still required, and only with a powerful breakout to new highs on heavy volume would new (or add-on) buying efforts be considered appropriate under the investment system guidelines.
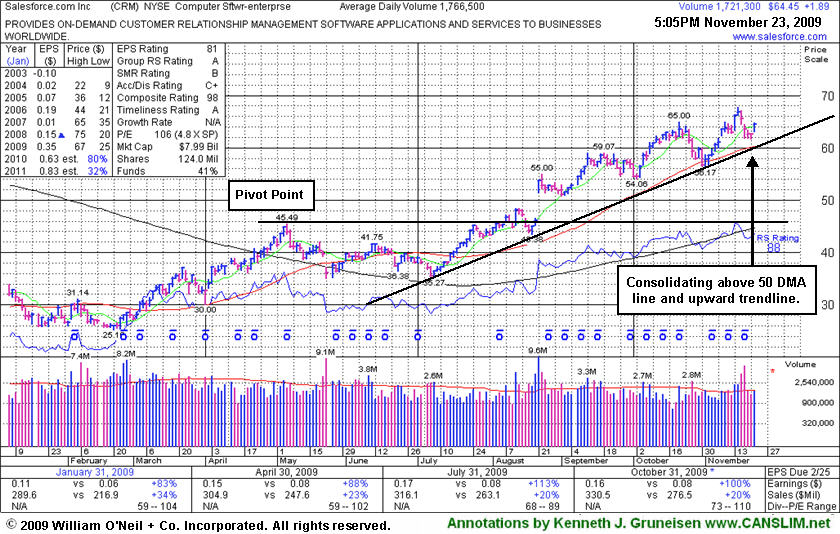
The high-ranked Computer Software - Enterprise firm has seen an increase in institutional (I criteria) ownership, with the number of top-rated funds owning its shares rising from 277 in March '09 to 328 in Dec '09. It has traded up as much as +65.49% since featured in a Stock Bulletin on 8/16/09 under the headline "Forces Have Been Favorable For Software Services Firm."
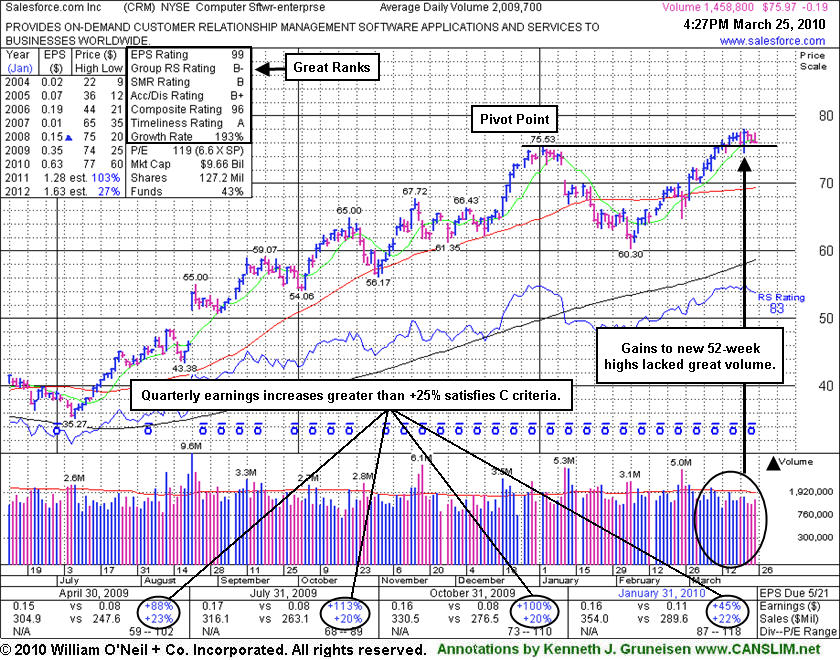
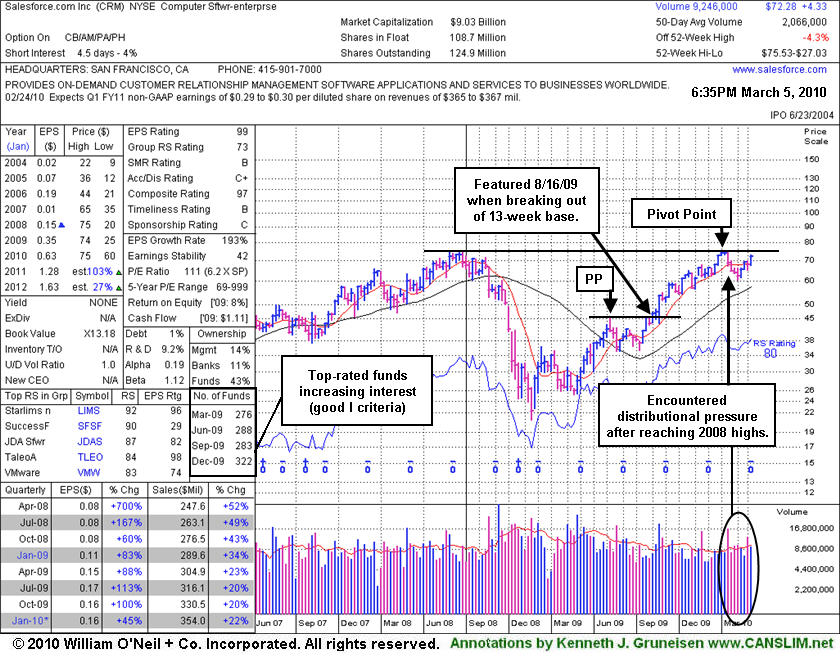
Salesforce.com, Inc. (CRM +$1.39 or +1.96% to $72.28) is continuing its recent rebound above its 50-day moving average (DMA) line and it is perched -4% from its all-time high. It encountered distributional pressure in recent weeks after reaching its 2008 highs. Its color code is changed to yellow with new pivot point cited based on its January 4, 2010 high. Its weekly chart below resembles a giant cup with handle pattern. Ideally it would form the right side of a shorter-term cup-with handle pattern in the weeks ahead before triggering a new buy signal. Patience and discipline are required, and only with a powerful breakout to new highs on heavy volume would new (or add-on) buying efforts be considered appropriate under the investment system guidelines. Meanwhile, the recent chart low ($64.77 on 2/25/10) is now an important support level to watch.
The high-ranked Computer Software - Enterprise firm has seen an increase in institutional (I criteria) ownership, with the number of top-rated funds owning its shares rising from 276 in March '09 to 322 in Dec '09. It has traded up as much as +60.3% since featured in a Stock Bulletin on 8/16/09 under the headline "Forces Have Been Favorable For Software Services Firm."
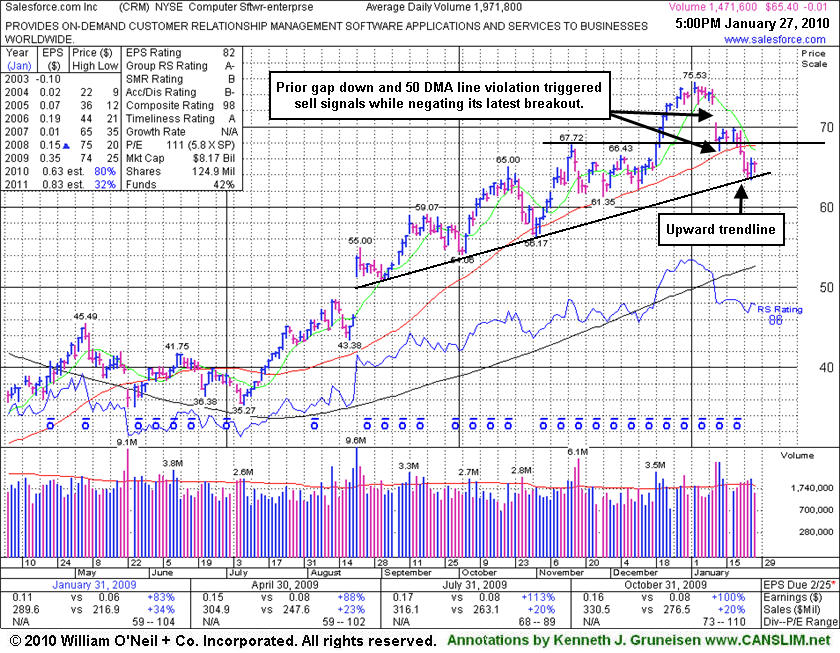
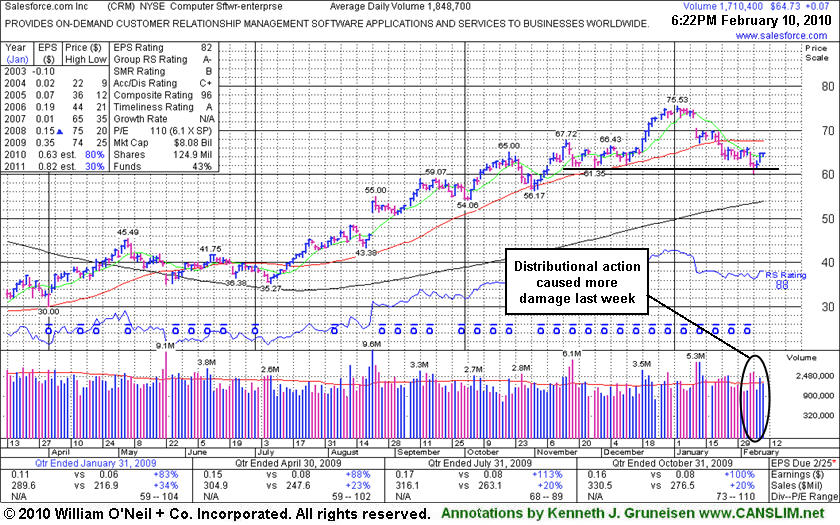
Salesforce.com, Inc. (CRM +$0.07 or +0.11% to $64.73) held its ground today. The high-ranked Computer Software - Enterprise firm encountered more pressure indicative of institutional (I criteria) distribution since its last appearance in this FSU section under the headline "Recent Damage Leaves High-Ranked Leader Testing Upward Trendline on 1/27/10. Then it was observed - "An upward trendline connecting its September-January lows now defines an important support level, where any further deterioration to new lows would raise even greater concerns." The upward trendline referred to at the time has subsequently been breached. Technically, the recent chart low ($60.30 on 2/05/10) is an important support level to watch, meanwhile a rebound back above its 50-day moving average (DMA) line is needed for its outlook improve.
Numerous notes in mid-January (see the "view all notes" links if you wish to review) called attention to CRM's deterioration. The weakness has likely prompted disciplined investors to sell any shares bought at the later stage, if not positions accumulated earlier. Market conditions (M criteria) still argue for playing good defense for at least the near-term period until a follow-through day emerges. More time is needed for a sound base to develop and, as stated above, a rebound back above its 50-day moving average (DMA) line is needed for its outlook improve.
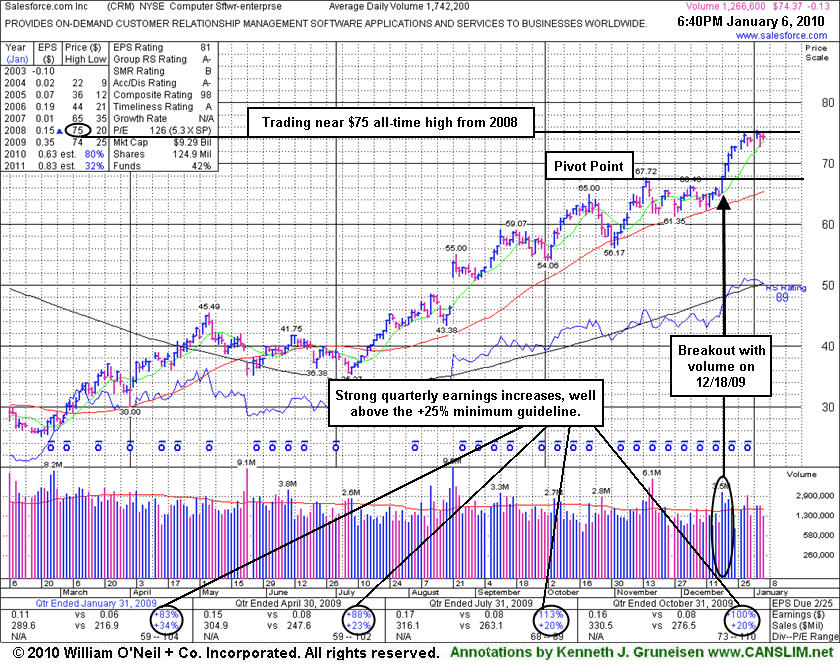
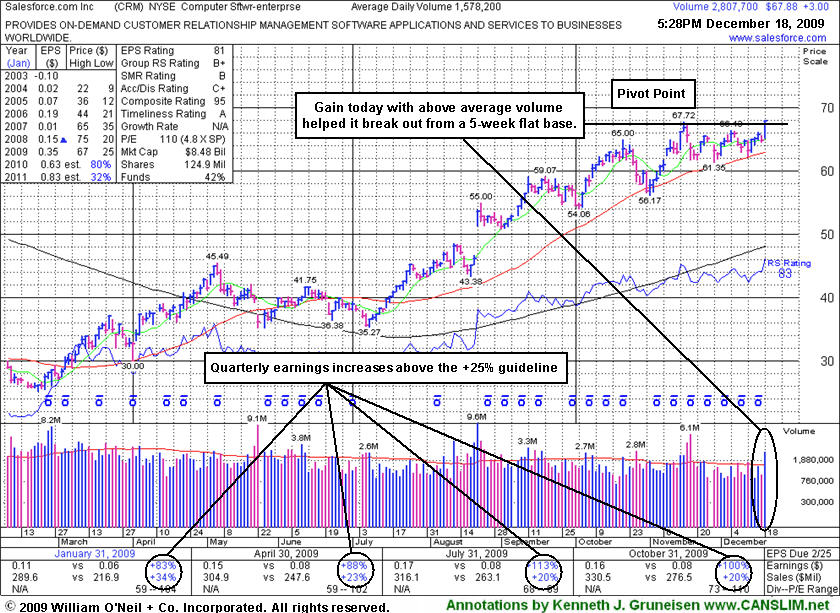
Salesforce.com, Inc. (CRM -$0.13 or -0.17% to $74.37) has been stubbornly holding its ground, perched very near its $75 all-time high from 2008. Prior chart highs in the $67 area are an important support level to watch now. A powerful rally into new all-time high territory with heavy volume would be a noteworthy sign of institutional buying demand. However, it is now extended from its latest sound 5-week flat base above important support at its 50-day moving average (DMA) line. Its 12/18/09 gain with more than +50% above average volume triggered a technical buy signal. For its 12/18/09 mid-day report appearance its color code was changed to yellow and a new pivot point based upon its 11/16/09 high plus 10 cents was noted. A convincing breakout above its prior chart high that day with at least +50% above average volume was all that it took to trigger the latest technical buy signal.
With the reassurance of additional heavy institutional buying (the I criteria) demand, add-on buying might be worth considering if it surges again. But be careful not to average your cost up too much by only buying smaller amounts at higher levels. On pullbacks, shares owned at a lower cost basis may be held, but always limit losses by selling the shares bought later if the stock falls -7% from your higher buy price.
Salesforce.com, Inc. (CRM +$3.00 or +4.62% to $67.88) gapped up today for a small gain, then went on to rally with heavy volume for a new 52-week high. It had been recently consolidating above important support at its 50-day moving average (DMA) line. Over the past 5 weeks it formed a sound new flat base. Its color code was changed to yellow and a new pivot point based upon its 11/16/09 high plus 10 cents was noted earlier today. A 5-week consolidation is the minimum length for a proper flat base. A convincing breakout above its prior chart high with at least +50% above average volume was all that it took to trigger a new technical buy signal.
Patience has allowed disciplined investors another ideal entry point with the reassurance of heavy institutional buying (the I criteria) demand. That technical buy signal is no guarantee it will go on to produce huge gains, but such signs of big buying demand are considered as the critical "proof" for investors using this fact-based investment system. Meanwhile, any violation of its 50 DMA line and recent chart lows in the $61 area would raise concerns and trigger technical sell signals. Not long ago it found prompt support at its 50-day moving average (DMA) line then rallied to a new 52-week high and encountered some heavy distribution. Each subsequent test of that short term average line is considered to be more failure prone, while staying above the 50 DMA line is a healthy sign of institutional support.
Salesforce.com, Inc. (CRM -$1.73 or -2.63% to $64.14) gapped down today for a small loss on average volume, still hovering just -5% from its 52 week high. It has been recently consolidating above important support at its 50-day moving average (DMA) line and an upward trendline. It still has not formed a sound new base, yet it has held its ground since recent distributional pressure raised concerns. It has not spent a lot of time basing since its big gap up in August. Patience may allow it to form a sound new base and offer disciplined investors another idea entry point. Meanwhile, its 50 DMA line and upward trendline connecting prior chart lows are initial chart support levels to watch. Violations could trigger technical sell signals and raise more serious concerns. Not long ago it found prompt support at its 50-day moving average (DMA) line then rallied to a new 52-week high.
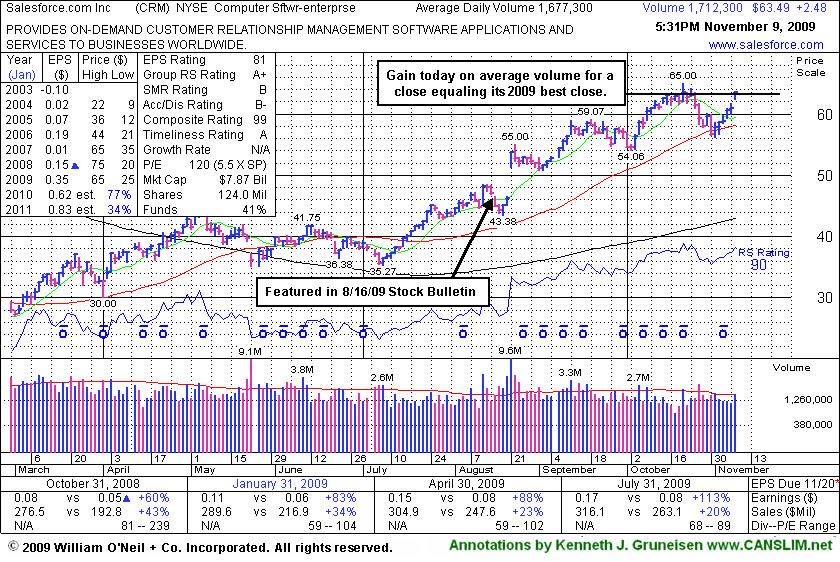
Salesforce.com, Inc. (CRM +$1.94 or +3.10% to $64.50) gapped up today for a solid gain on average volume after 4 consecutive losing sessions. Not long ago it found prompt support at its 50-day moving average (DMA) line then rallied to a new 52-week high. It pulled back after reporting another strong quarter of sales and earnings increases for the period ended October 31, 2009. It has not spend a lot of time basing since its big gap up in August. Patience may allow it to form a sound new base and offer disciplined investors another idea entry point. Meanwhile, its 50 DMA line and upward trendline connecting prior chart lows are initial chart support levels to watch.
Salesforce.com, Inc. (CRM +$2.48 or +4.06% to $63.49) posted a gain today and equaled its best 2009 high close as it posted a 6th consecutive gain on near average volume. Gains last week on quiet volume helped it find support and rally up from its 50-day moving average (DMA) line. Volume was not extremely heavy behind any of the recent losses, however deterioration had nonetheless led to technical sell signals as it briefly violated its 50 DMA line, prior chart highs in the $59 area, and an upward trendline. Now, any violation of its recent chart lows in the $56 area would raise more serious concerns and trigger more worrisome technical sell signals. The number of top-rated funds owning its shares rose from 269 in Sept '08 to 297 in Jun '09, which is reassuring news concerning the I criteria.
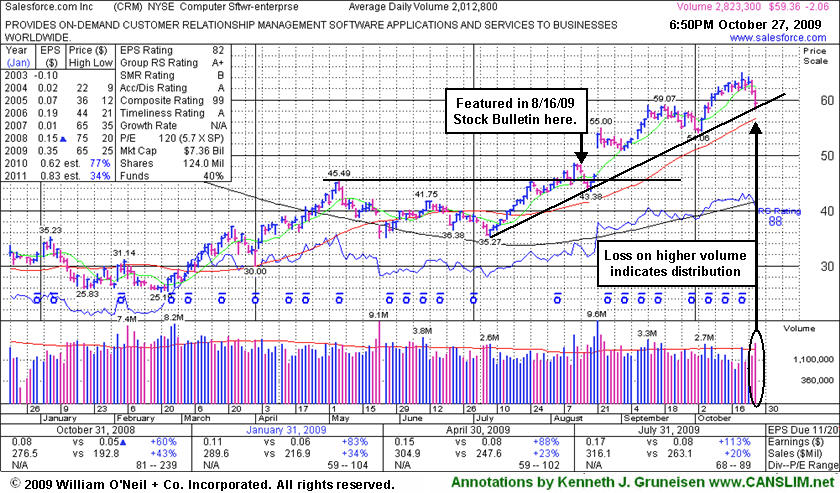
In its last FSU section appearance on 10/27/09 under the headline, "Profit Taking Pressures Mount As Distribution Troubles Market" it was said that - "The weak action in the stock coupled with the broader market deterioration (M criteria) suggests that it might be appropriate for investors to lock in profits under the investment system guidelines, especially if more worrisome losses lead to violations at the above mentioned levels." The resilience shown by the stock, coupled with the market's latest follow-through- day (today), bodes well for investors who may still be holding any existing positions even after the recent pullback raised concerns. It has not formed a sound new base, but patience may allow for additional disciplined entry points to show up eventually.
Salesforce.com, Inc. (CRM -$2.06 or -3.47% to $59.36) suffered a loss today with above average volume, raising some concerns. Prior chart highs in the $59 area coincide with an upward trendline connecting its July, August and October chart lows, helping define an important technical support level currently being tested. Its 50-day moving average (DMA) line is the next important support level to watch. The weak action in the stock coupled with the broader market deterioration (M criteria) suggests that it might be appropriate for investors to lock in profits under the investment system guidelines, especially if more worrisome losses lead to violations at the above mentioned levels.
CRM stubbornly held its ground and stayed well above its important short-term average since its "breakaway gap" for a considerable gain on 8/21/09 with more than 5 times average volume. The number of top-rated funds owning its shares rose from 269 in Sept '08 to 294 in Jun '09, which is reassuring news concerning the I criteria. Additional weakness may lead to more definitive technical sell signals, while it otherwise needs more time to possibly form a new sound base. Market action will largely dictate the outcome, since 3 out of 4 stocks typically follow the direction of the broader market averages.
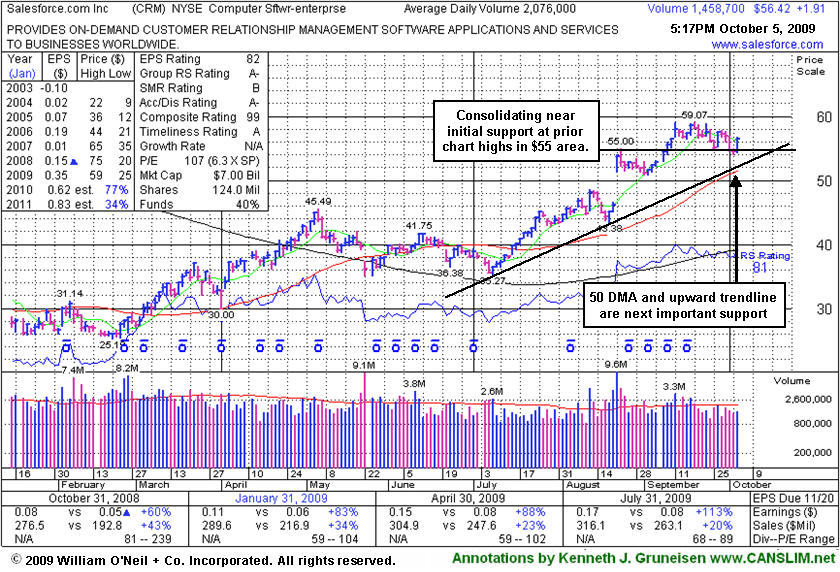
Salesforce.com, Inc. (CRM +$1.91 or +3.93% to $56.42) posted a gain today on light volume after 4 consecutive losses on light volume, quietly consolidating above prior highs in the $55 area, an initial support level. More substantial technical support to watch is at its upward trendline and its 50 DMA line now coinciding in the $51 area. It was recently noted as it rose from a "3-weeks tight" type pattern and it stubbornly held its ground since its earlier "breakaway gap" for a considerable gain on 8/21/09 with more than 5 times average volume. The number of top-rated funds owning its shares rose from 272 in Sept '08 to 295 in Jun '09, which is reassuring news concerning the I criteria. It needs more time to form a new sound base before any new or add-on buying efforts might be appropriate under the investment system guidelines.
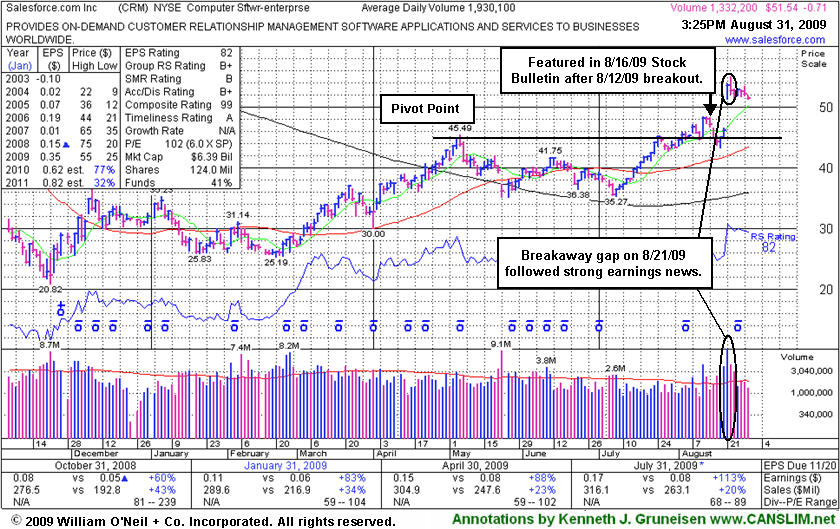
Salesforce.com, Inc.'s (CRM -$0.79 or -1.03% to $56.68) loss today on higher volume was a sign of distribution. Prior highs near $55 are an initial support level to watch on pullbacks, while it is now extended from a sound base. It recently rose from a "3-weeks tight" type pattern, and it stubbornly held its ground since its "breakaway gap" for a considerable gain on 8/21/09 with more than 5 times average volume. The stock's exceptional action was discussed further in the "Ken's Mailbag" Q&A with a member in the 8/21/09 After Market Update (read here).
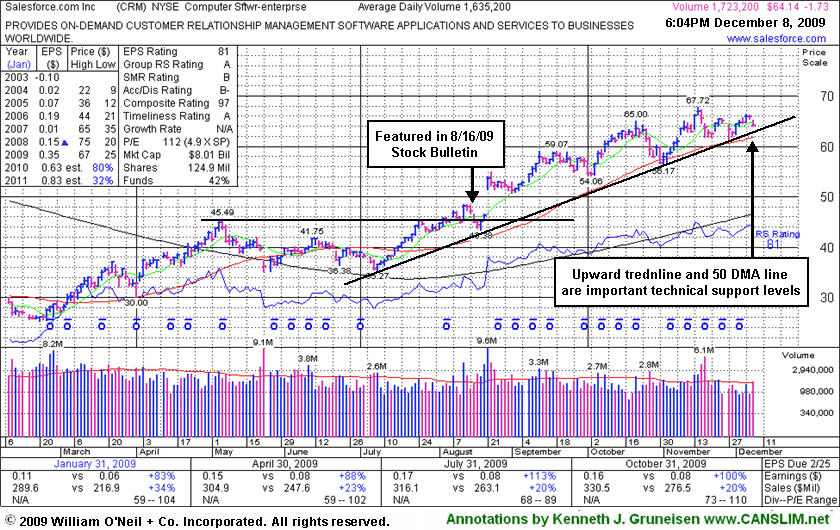
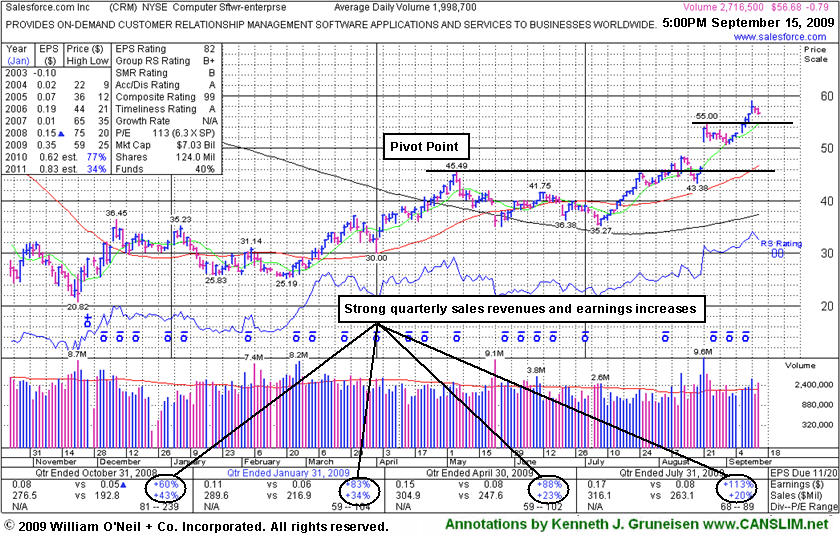
A Stock Bulletin was published with detailed analysis and an annotated graph on 8/16/09 (read here). Stock Bulletins are not part of a routine daily or monthly report that we publish for CANSLIM.net's paying members, they are occasionally prepared as the market action dictates. The most action-worthy new ideas show up more often highlighted in yellow in the CANSLIM.net Mid-Day BreakOuts Report, or in the monthly issue of CANSLIM.net News. Market conditions in many recent months have been such that far fewer ideas than we would like have been worthy of the full blown coverage typically provided on stocks in the monthly newsletter, let alone special bulletins. The last bulletin published prior to CRM was more than a year ago - 6/04/2008 Almost Family (AFAM).
Salesforce.com, Inc. (CRM -$0.38 or -0.73% to $51.84) has been stubbornly holding its ground while consolidating in a very tight range since its "breakaway gap" for a considerable gain on 8/21/09 with more than 5 times average volume. The stock's exceptional action was discussed further in the "Ken's Mailbag" Q&A with a member in the 8/21/09 After Market Update (read here). A Stock Bulletin was published with detailed analysis and an annotated graph on 8/16/09 (read here). Stock Bulletins are not part of a routine daily or monthly report that we publish for CANSLIM.net's paying members, they are occasionally prepared as the market action dictates. The most action-worthy new ideas show up more often highlighted in yellow in the CANSLIM.net Mid-Day BreakOuts Report, or in the monthly issue of CANSLIM.net News. Market conditions in many recent months have been such that far fewer ideas than we would like have been worthy of the full blown coverage typically provided on stocks in the monthly newsletter, let alone special bulletins. The last bulletin published prior to CRM was more than a year ago - 6/04/2008 Almost Family (AFAM).
CRM's breakaway gap was part of the important batch of new leadership helping the market snap out of a brief correction in mid-August and get back into a "confirmed rally", which is good news concerning the investment system's M criteria. As we have noted in the past, a "breakaway gap" is one valid exception to the rule which limits investors from buying stocks at more than 5% above their prior chart high or pivot point. We have in the past seen the newspaper and experts teaching the Certification suggest that in a very bullish market environment it is permissible to buy stocks as much as 10% above their prior highs when a stock stages a powerful breakaway gap. As it continues to consolidate, CRM may offer investors more ideal chances to accumulate shares on lighter volume pullbacks, or a base-on-base type pattern might form in future weeks.
| SalesForce.com Inc. |
CLICK HERE to see the Profile Page for this stock with current details and historic information | |
|
Ticker Symbol: CRM (NYSE) |
Industry Group: Computer- Software Enterprise |
Shares Outstanding: 123,500,000 |
|
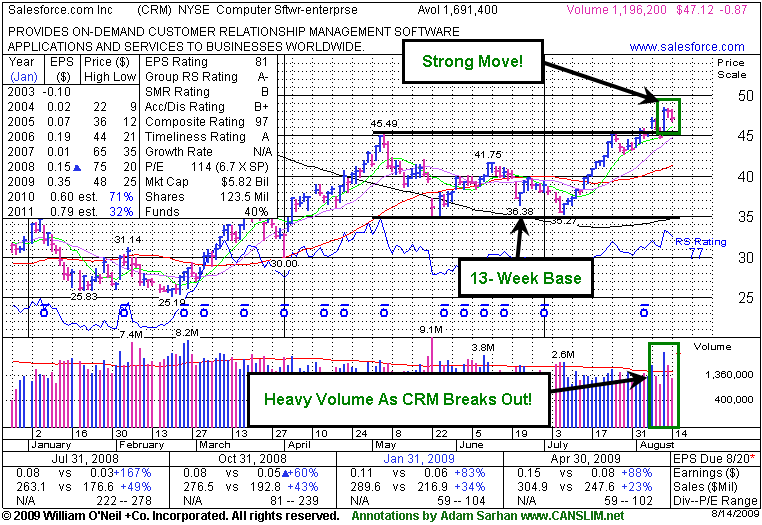
Price: $47.12 8/14/2009 |
Day's Volume: 1,196,200 8/14/2009 |
Shares in Float: 107,400,000 |
|
52 Week High: $68.32 8/14/2009 |
50-Day Average Volume: 1,691,400 |
Up/Down Volume Ratio: 1.3 |
|
Pivot Point: $45.59 5/6/2009 (high plus $0.10) |
Pivot Point +5% = Max Buy Price: $47.87 |
Web Address: http://www.salesforce.com/ |
CANSLIM.net Profile: Salesforce.com, inc. provides customer relationship management (CRM) service to businesses of various sizes and industries worldwide. The company provides AppExchange, an online directory for SaaS applications, where customers can browse, test-drive, and install applications. It was founded in 1999 and is based in San Francisco, California. The stock resides in the Computer- Software Enterprise group which is presently ranked 41st on the 197 Industry Groups list which is inside the much-preferred top quartile of groups, satisfying the L criteria. The number of top-rated funds with an ownership interest has grown from 272 funds in September '08 to 294 funds as of June '09 which is an encouraging sign of increasing institutional interest (the I criteria). Strong quarterly earnings growth satisfies the C criteria. There is some concern over sequential deceleration in its sales revenues growth rate, yet quarterly earnings increases have been above the +25% minimum guideline.
What to Look For and What to Look Out For: The stock is currently trading below its maximum buy price which means that it is currently considered buyable under the proper guidelines. CRM is scheduled to report earnings on Thursday, August 20th. Near earnings news, investors may expect that volume and price action can be very volatile. It is important to remain disciplined. Chasing it after it trades above its maximum buy price of $47.87 is not a prudent move. Instead, this stock should be accumulated before it trades above its max buy price. Keep in mind that it is common for stocks to retrace and test near-term support near prior chart highs. The bulls remain in control as long as this stock continues trading above its $45.59 pivot point.
Technical Analysis: The stock recently broke out of a 13-week base on heavy volume which is a strong sign of institutional sponsorship. The stock spent a little over 3 months building its latest base before it triggered its latest technical buy signal on August 12th gain on heavy volume. Since then the stock has drifted lower, and the consolidation process presents an opportunity for investors to accumulate shares under the maximum buy price.
A very important technical tool that savvy investors have learned to incorporate in their technical analysis is the 50-day moving average (DMA) line. The 50 DMA line plays a pivotal role relative to a stock's price. If the price of a stock is above its 50 DMA then odds are that its 50 DMA will act as formidable support. Conversely, if the price is below its 50 DMA then the moving average acts as resistance. Healthy stocks sometimes trade under their 50 DMA lines briefly, but usually a strong candidate will promptly bounce and repair a 50 DMA violation. When a stock has violated its 50 DMA line and then lingers beneath it, the stock's outlook gets worse and worse as it spends a greater period of time trading under that important short-term average line. Once the 50 DMA line starts sloping downward it should also be acknowledged that the stock has been struggling for a while, and it might be time to reduce exposure and look for places to put that money to work in stronger buy candidates.
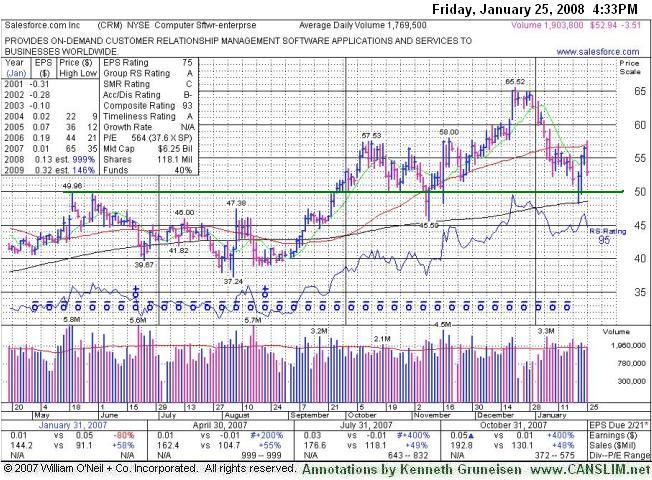
Salesforce.com (CRM -$3.51 or -7.10% to $52.94) negatively reversed after encountering resistance near its 50 DMA line ($56.96 now) today. This stock was first featured in the October 2007 edition of CANSLIM.net News (read here) with a $50.06 pivot point and a $52.56 maximum buy price as it was triggering a technical buy signal. The stock initially rallied +14% before pulling back and negating (on an intra-day basis 11/08/07 and 11/09/07) its breakout. On November 9, 2007 the stock positively reversed after finding support at its 200 DMA line. Soon thereafter, the technical damage was repaired and the stock appeared on Friday November 16, 2007 in the CANSLIM.net Mid Day Breakouts Report (read here) at $54.82 as it was surging with volume nearly 3 times average after reporting strong earnings and a ''largest ever'' deal with Citigroup. Arguably, a new pivot point could have been cited based upon its October highs, and the action therefore triggered a new technical buy signal.
During the stock's latest rally, it was featured again on Wednesday, December 19, 2007 in the CANSLIM.net Mid Day Breakouts Report (read here) with a new $57.63 pivot point and a new $60.51 maximum buy price. The next day it posted a considerable gain on heavy volume, but the stock topped out (+30% above its original pivot point) and has been steadily declining since. As the major averages ran into trouble, CRM has suffered a similar fate to that of many other issues of late. Since the first week of January, concerns have been repeatedly noted about its technical deterioration. In recent sessions, CANSLIM.net's experts noted that the stock's 50 DMA line could act as a resistance level going forward. The bears remain in control until this stock recovers convincingly above that critical threshold, which may happen, but will largely be dictated based upon the broader market's undercurrent. Meanwhile, any deterioration under the recent chart lows or its 200 DMA line would be cosidered especially ominous action triggering additional technical sell signals.
C A N S L I M | StockTalk | News | Chart | SEC | Zacks Reports | ![]()
![]()
![]()
View all notes | Alert me of new notes | CANSLIM.net Company Profile
|
Salesforce.com Inc. |
||
|
Ticker Symbol: CRM |
Industry Group: Computer Software-Entprse |
Shares Outstanding: 116,800,000 |
|
Price: $51.32 9/28/2007 |
Day's Volume: 1,870,600 9/28/2007 |
Shares in Float: 94,600,000 |
|
52 Week High: $51.75 9/28/2007 |
50-Day Average Volume: 1,857,500 |
Up/Down Volume Ratio: 1.3 |
|
Pivot Point: $50.06 5/21/2007 high plus .10 |
Pivot Point +5% = Max Buy Price: $52.56 |
Web Address: http://www.salesforce.com |
C A N S L I M | StockTalk | News | Chart | SEC | Zacks Reports

CANSLIM.net Company Profile: Salesforce.com, Inc. provides on-demand customer relationship management (CRM) services to businesses and industries worldwide. Its Apex platform allows customers and partners to customize and integrate Salesforce CRM applications or build new applications. The company also offers AppExchange, an online marketplace for on-demand applications. It provides an array of CRM and business application services, which enable customers and subscribers to systematically record, store, and act upon business data; and to help businesses manage customer accounts, track sales leads, evaluate marketing campaigns, and provide postsales services. The company's CRM services primarily focus on sales force automation, partner relationship management, marketing automation, and customer service and support automation. The company was founded in 1999 and is headquartered in San Francisco, California.. The company sports a very healthy Earnings Per Share (EPS) rating of 87 and a strong Relative Strength (RS) rating of 89. Concerns are raised because it does not have a particularly impressive annual earnings growth history, or "A" criteria, yet future earnings estimates are high. CRM resides in the Computer Software-Entprse group which is currently ranked 23rd of out the 197 Industry Groups covered in the paper, helping satisfy the "L" criteria. Insiders own about 19% of its shares, which provides decent motivation to protect and build shareholder value. From Sept '06 to Jun '07 the number of top-rated funds rose from 143 to 178, helping satisfy the "I" criteria.
What to Look For and What to Look Out For: Look for CRM to make further progress above its prior high closes and follow through with confirming gains on enough volume to trigger a sound technical buy signal. A close back under its $50.06 pivot point would prompt concern. Always limit losses per the 7-8% sell rule, and never hold a stock if it falls more than that much from your purchase price.
Technical Analysis: The stock traded above its pivot point but volume, a critical component of institutional sponsorship, has yet to meet the necessary guideline needed to trigger a proper technical buy signal. It would be very encouraging to see volume swell considerably with confirming gains that help this high-ranked leader trade above its $52.56 maximum buy price and continue higher. Its weekly chart clearly illustrates how this issue cleared all remaining overhead supply when it surged into new high territory and broke out of a long 7-month base at the end of September.