Consolidating Above 50-Day Moving Average - Wednesday, December 12, 2018
Charts courtesy of www.stockcharts.com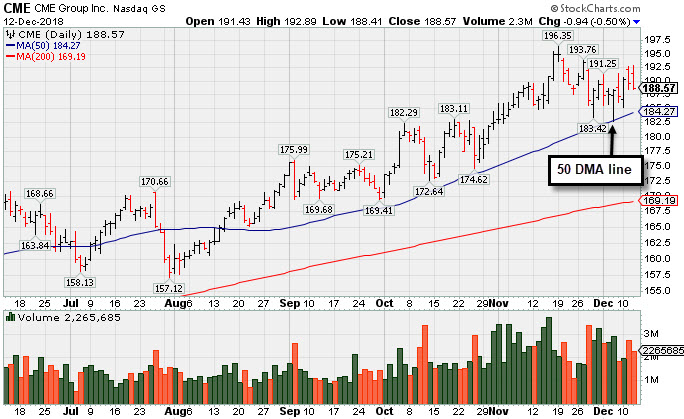
Extended From Base After More Gain With Above Average Volume - Thursday, November 15, 2018
Charts courtesy of www.stockcharts.com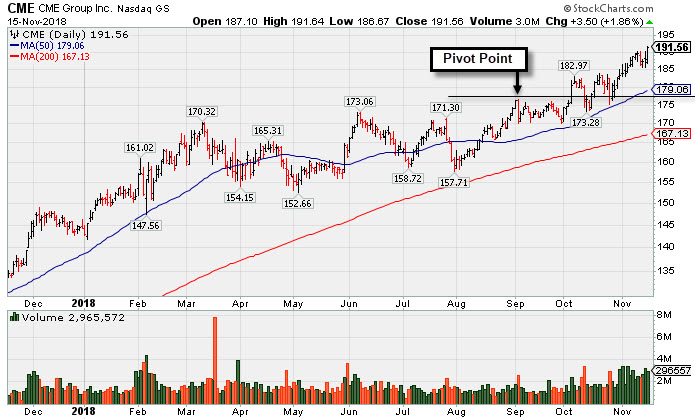
Perched Near High After Latest Earnings Report Below +25% Minimum - Friday, October 26, 2018
Charts courtesy of www.stockcharts.com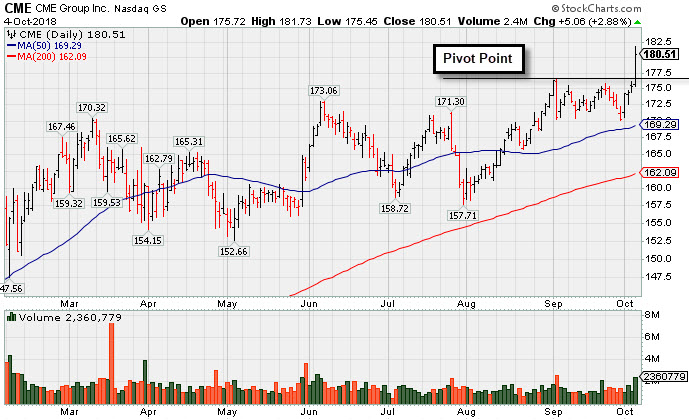
CME Group Blasted to New Record High - Thursday, October 4, 2018
Charts courtesy of www.stockcharts.com
Light Volume Pullback Perfectly Normal After Monstrous Rally - Thursday, January 25, 2007
Volume is a vital component of technical analysis. Prudent investors that incorporate volume into their stock analysis have often benefited several fold. Ideally, healthy stocks will more often tend to rise on higher volume and pullback on lighter volume. Volume is a great proxy for institutional sponsorship. Conversely, high volume declines can be an ominous, as this usually signals distribution and further price deterioration are more likely to follow.
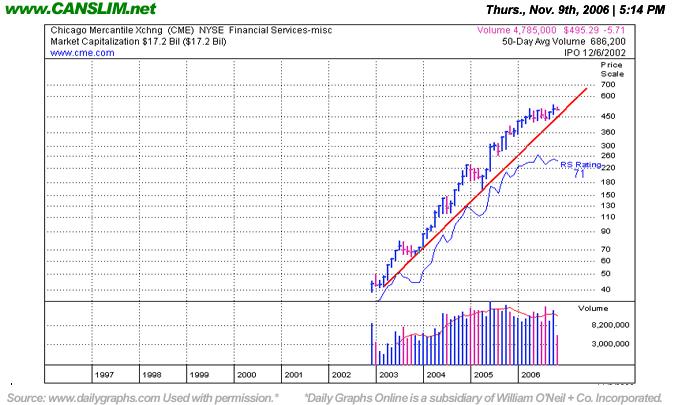
Chicago Mercantile Exchange Holdings Inc. (CME -$12.54 or -2.12% to $579.00) fell today on below average volume, however the stock is still in positive territory for the week (weekly chart shown below). CME was first featured on Thursday, June 2, 2005 in the CANSLIM.net Mid Day Breakouts Report (read here) at $227.08 as it was approaching its $230.35 pivot point. In the interim, this stock has surged as much as +163% and has traced out a rather well defined upward trendline. A more detailed analysis was last provided in this "Featured Stock Update" section on Thursday, November 9, 2006 (read here) as it was quietly consolidating above its 50-day moving average (DMA) line. A few days later, the bulls emerged and sent this stock gushing higher. During the past few months, CME has steadily rallied and formed a well defined upward sloping channel. Today's below average volume decline came one day after this issue ran into resistance at the upper boundary of its well defined 5-month upward trend. It is normal to see a stock move lower on below average volume as it steadily advances. The stock continues to sport strong fundamentals and technicals. Initial chart support exists in the $557 range, near its November 2006 highs, as old chart resistance levels commonly act as new chart support levels during a stock's ongoing advance.
C A N S L I M | StockTalk | News | Chart | ![]() DGO | SEC | Zacks Reports
DGO | SEC | Zacks Reports

View all notes | Alert me of new notes | CANSLIM.net Company Profile
Light Volume Loss Today; Watch Chart Support - Thursday, November 09, 2006
An upward trendline, by definition, develops as a stock steadily appreciates over an extended period of time. During that period the stock vacillates between the lower and upper boundaries of trendlines which can be drawn connecting a series of recent highs or lows. In order to ensure the overall health of the stock, the lower boundary should not be violated. Technically, if the lower boundary is violated this signals that the trend is deteriorating and bears are gaining control, making the odds start to favor the possibility of further downside testing.
Chicago Mercantile Exchange Holdings Inc. (CME -$9.43 or -1.87% to $495.29) was first featured on Thursday, June 02, 2005 in the CANSLIM.net Mid Day Breakouts Report (read here) at $227.08 as it was approaching its $230.35 pivot point. In the interim, this stock has surged a whopping +124% and has traced out a rather well defined upward trendline (shown below). After such an explosive rise it is normal to see a stock spend a few months consolidating.
Recently CME appeared in the October 02, 2006 edition of the CANSLIM.net After Market Report (read here) discussing a few pertinent factors. The following is a brief excerpt from that report, "CME is currently tracing out a lengthy base, and the recent chart lows near $425 could be considered very important chart support where any violations would be definitive technical sell signals. It is now trading above its 50 DMA line and its 200 DMA line, however it is testing near the lower boundary of its longer-term upward trendline. As long as it continues trading above the lower boundary of its upward trendline, the path of least resistance still may lead it higher. Concerns would rise if that upward trendline is violated, as its bullish trend could be in serious jeopardy." Two weeks later on October 17, 2006 CME announced it was buying the Chicago Board of Trade (CBOT -2.01%). The mega-deal created some volatility. However, until a technical sell signal is triggered we shall continue to give this stock the benefit of the doubt. Any deterioration under its recent low close of $490.18 on October 20th, or a breach of its 50 DMA line, would be considered technical sell signals. Any downside testing near those levels is expected to be met with prompt support in the form of buying demand from existing institutional owners. Their failure to show support would be a worrisome sign.
C A N S L I M | StockTalk | News | Chart | ![]() DGO | SEC | Zacks Reports
DGO | SEC | Zacks Reports
View all notes | Alert me of new notes | CANSLIM.net Company Profile
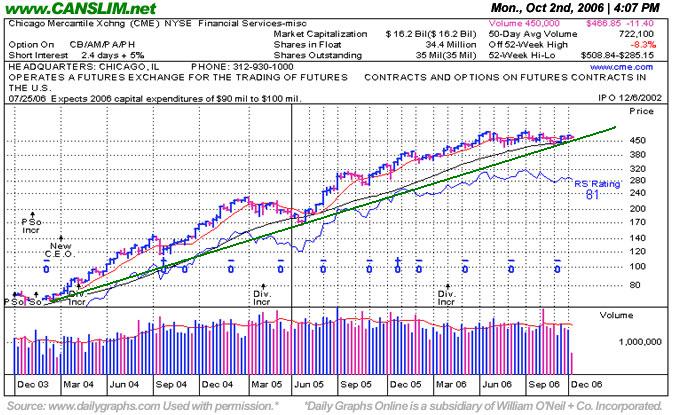
Lengthy Period of Base Building Continues - Monday, October 02, 2006
An upward trendline, by definition, develops as a stock steadily appreciates over an extended period of time. During that period the stock vacillates between the lower and upper boundaries of trendlines which can be drawn connecting a series of recent highs or lows. In order to ensure the overall health of the stock, the lower boundary should not be violated. Technically, if the lower boundary is violated this signals that the trend is deteriorating and bears are gaining control, making the odds start to favor the possibility of further downside testing.
Chicago Mercantile Exchange Holdings Inc. (CME -$11.40 or -2.38% to $466.85) ended lower on below average volume on Monday. This stock was featured on Thursday, June 02, 2005 in the CANSLIM.net Mid Day Breakouts Report (read here) at $227.08 as it was approaching its $230.35 pivot point. In the interim, this stock has surged a whopping +124% and has traced out a rather well defined upward trendline. After such an explosive rise it is normal to see a stock spend a few months consolidating. CME is currently tracing out a lengthy base, and the recent chart lows near $425 could be considered very important chart support where any violations would be definitive technical sell signals. It is now trading above its 50 DMA line and its 200 DMA line, however it is testing near the lower boundary of its longer-term upward trendline. As long as it continues trading above the lower boundary of its upward trendline, the path of least resistance still may lead it higher. Concerns would rise if that upward trendline is violated, as its bullish trend could be in serious jeopardy.
C A N S L I M | StockTalk | News | Chart | SEC | Zacks Reports
View all notes | Alert me of new notes | CANSLIM.net Company Profile
FSU CHART CME - Tuesday, August 29, 2006
C A N S L I M | StockTalk | News | Chart | SEC | Zacks Reports
View all notes | Alert me of new notes | CANSLIM.net Company Profile
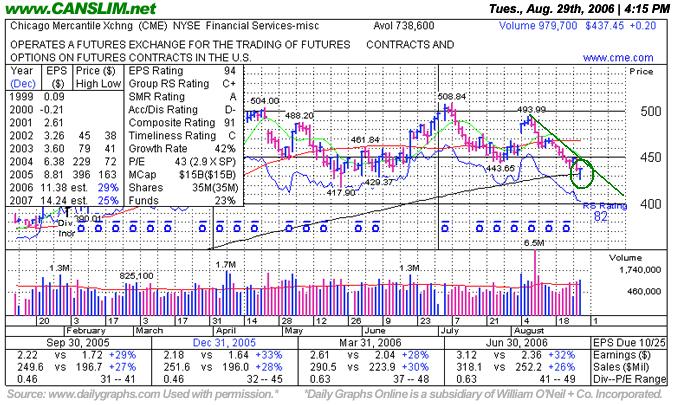
CME Finds Support At Its 200 DMA - Tuesday, August 29, 2006
Reversal days are a great way to stay ahead of potential changes to a recent trend. A negative reversal occurs when a stock opens up the session heading higher, then reverses and ultimately closes the day lower. Positive reversals are the exact opposite. Positive reversals are often considered more severe if the stock's initial losses drive it to a new low, but it then reverses and closes the day higher on heavier than average volume and ends near the session's utmost highs. Reversals can occur on a daily, weekly or a monthly chart. In general, when a longer time frame is involved, greater implications may be given as to the severity or significance of the reversal. Volume is directly correlated with the severity of the action as well.
In addition, a very important technical tool that savvy investors have learned to incorporate in their technical analysis is the 200-day moving average (DMA) line. The 200 DMA line plays a pivotal role relative to a stock's price. If the price of a stock is above its 200 DMA then odds are that its 200 DMA will act as longer term support. Conversely, if the price is below its 200 DMA then the moving average acts as resistance. Obviously, if a technical breakdown or violation takes place on heavy volume it is a more serious concern. Sometimes quiet violations are repaired quickly, without a lot of additional losses. However, the key moving averages are always an important line to watch.
Chicago Mercantile Exchange Holdings Inc. (CME +$0.20 or +0.05% to $437.45) positively reversed for gain on on above average volume after briefly violating its 200 DMA on Tuesday. This stock recently appeared in the August 2nd, 2006 CANSLIM.net After-Market Report which covered many details of its recent action (read here). Since then, this stock briefly rallied above its 50 DMA but quickly reversed and has spent the past four weeks relentlessly pulling back towards its longer term 200 DMA. Finally, after the steep correction, three bullish events occurred which helped stem the recent selling pressure. First CME positively reversed, which typically means the bears are exhausted. The second bullish factor is that volume swelled behind Tuesday's positive reversal. The third and equally important event was that this reversal occurred exactly off its longer term 200 DMA line. As long as this level is not breached then odds favor this stock will have a reasonable chance of eventually repairing the recent damage.
C A N S L I M | StockTalk | News | Chart | SEC | Zacks Reports
View all notes | Alert me of new notes | CANSLIM.net Company Profile
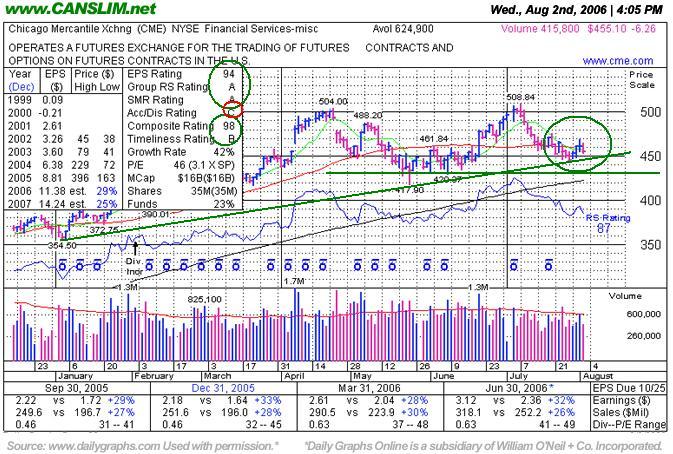
Trendline Now Key Chart Support - Wednesday, August 02, 2006
Longstanding readers of this section in the CANSLIM.net After Market Report are well versed on the importance of upward trendlines. It is also important to note how stocks behave after an upward trendline is violated. By definition, an upward trendline develops when a stock has steadily appreciated for an extended period of time. During that period the stock vacillates between the lower and upper boundary of the trendline. However, once the bears show up and the lower trendline is violated then odds start favoring the possibility of further downside testing.
Chicago Mercantile Exchange Holdings Inc. (CME -$6.26 or -1.36% to $455.10) ended below its 50 day moving average on lighter volume on Wednesday. This stock recently appeared in the July 5th, 2006 CANSLIM.net After-Market Report which covered many details of its +307.83% monstrous rise since first featured (read here). As market conditions have recently been uncooperative, our daily notes have become more cautionary, and CANSLIM.net's July 21st notes called attention to CME's flawed cup-with-handle pattern (read here). A rather well defined uptrend for the past 9 months now comes into play as important chart support slightly below CME's current trading level. This outstanding leader is still a great example of how a strong CANSLIM stock should behave. It is currently tracing out a late stage base and consolidating its recent run while the major averages have gotten trashed. As long as CME trades above this trendline odds still could favor further gains. However, a technical breakdown at this juncture would be a worrisome sign that the bears are taking control, and undiscipline investors may find themselves in serious jeopardy.
C A N S L I M | StockTalk | News | Chart | SEC | Zacks Reports
View all notes | Alert me of new notes | CANSLIM.net Company Profile
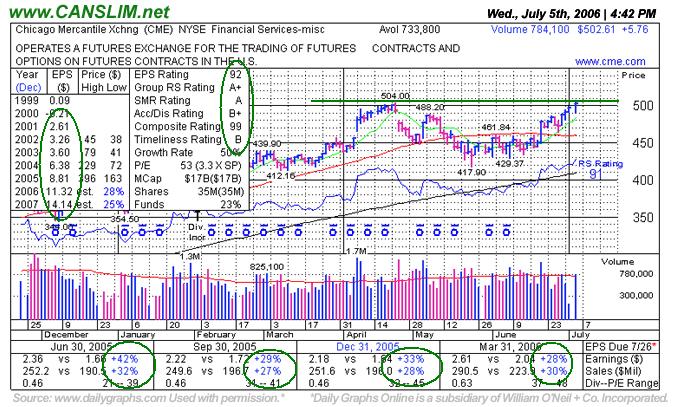
Leading Stock Again Reached New All-Time Highs - Wednesday, July 05, 2006
Often, when a leading stock is setting up to breakout of a solid base it is highlighted in CANSLIM.net's Mid-Day Breakouts Report. The most relevant factors are noted in the report which allows prudent CANSLIM oriented investors to place the issue in their watch list. After doing any necessary backup research, the investor is prepared to act if and when the stock triggers a technical buy signal (breaks above its pivot point on more than +50% average turnover). In the event the stock fails to trigger a technical buy signal and its price declines then it will simply be removed from the watch list.
Chicago Mercantile Exchange Holdings Inc. (CME $5.76 or 1.13% to $502.61) closed higher on just about average volume on Wednesday. This stock was recently written up, during its latest cyclical pullback within its longer term secular bull move, in the June 14, 2006 CANSLIM.net Mid-Day Breakouts Report (read here). The report highlighted a few important points about its recent pullback, "However, the stock held up well and on January 24th, 2006 it again blasted to another new high on very heavy volume, which was noted in that day's CANSLIM.net After Market Update. The all-time high of $504.00 was reached on April 24th, 2006, capping a +307.83% rise in a period of just under 2 years! More recently, the gap down and loss on heavy volume on April 25th, 2006 was noted in the CANSLIM.net After-market Update as a sell signal. The "island reversal" is a worrisome technical sell signal that was covered in detail in the Featured Stock Update section of the May 1st, 2006 CANSLIM.net After Market Update with an annotated DailyGraph(R) (read here)." Shortly thereafter this issue sliced through an intermediate term upward trendline as the major averages continued declining. Additionally CME broke below its 50 DMA, prompting investors to lock in profits, and it has been unable to trade above that level since. The longer it remains trading under its 50 DMA the worse its outlook becomes. Investors who are successful normally heed multiple sell signals and reduce their exposure when the market turns down. Only a rebound above the 50 DMA would improve its odds of challenging the all-time highs again. This has been an excellent winning example demonstrating the value of CANSLIM.net's timely reports and expert analysis."
Shortly after this report was published the bulls returned and promptly repaired the negative damage. Not only did CME trade back above its 50 DMA, but it also managed to hit new all-time high territory. On Wednesday, CME broke above its prior high of $504.00 but it failed to hold on to those impressive gains yet it still did manage its best-ever close. However, volume, another critical component, was lacking today. It may form a handle now, which could serve to set up and eventually provide a more reliable technical breakout. If one uses the April 24th high plus ten cents as the new pivot point ($504.10), you might figure a "max buy" price of $529.30 which is +5% above that pivot point. Usually you are going to be better off buying a stock near its pivot point rather than chasing it. It is important to note that CME has enjoyed an impressive run and is currently tracing out a late stage base. As long as price and volume remain bullish odds may favor further gains, however late stage bases are considered to be more failure prone. Proper selling discipline should always be applied whenever any stock falls more than 7-8% from your purchase price.
C A N S L I M | StockTalk | News | Chart | SEC | Zacks Reports
View all notes | Alert me of new notes | CANSLIM.net Company Profile
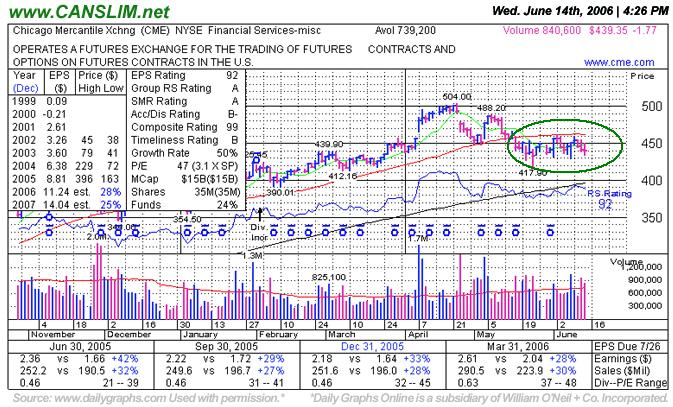
Upward Trendline Violated, Now 50 DMA Becomes Resistance - Wednesday, June 14, 2006
A very important technical tool that savvy investors have learned to incorporate in their technical analysis is the 50-day moving average (DMA) line. The 50 DMA line plays a pivotal role relative to a stock's price. If the price of a stock is above its 50 DMA then odds are that its 50 DMA will act as formidable support. Conversely, if the price is below its 50 DMA then the moving average acts as resistance. Further, longstanding readers of this section in the CANSLIM.net After Market Report are well versed on the importance of upward trendlines. It is also important to note how stocks behave after an upward trendline is violated. By definition, an upward trendline develops when a stock has steadily appreciated for an extended period of time. During that period the stock vacillates between the lower and upper boundary of the trendline. However, once the bears show up and the lower trendline is violated then odds start favoring the possibility of further downside testing.
Chicago Mercantile Exchange Holdings Inc. (CME -$0.47 or -0.11% to $440.65) ended lower today on above average volume as it continues trading below its 50 DMA. The company was featured on June 2nd, 2005 at $227.08 in that day's CANSLIM.net Mid-Day Breakouts Report (read here) right as this high-ranked leader was breaking out of a sound base on huge volume. That turned out to be the begining of another substantial leg up for this very strong performer. It immediately traded higher with volume conviction, allowing traders to realize short term profits. Another big volume breakout and a more explosive gap up to all-time highs on June 29th, 2005 quickly added to worry-free gains. This issue was among the market's high-ranked leaders throughout much of 2005, and it helped set an upward pace after the major indices flashed a follow-through day in October 2005. Long-time members may have noticed this stock's earlier Mid-Day BreakOuts Report appearances such as May 19th, 2004 when it was only $123.58. It also made appearances in Mid-Day BreakOuts Reports in June, July, and Sept-Dec '04.
As the stock consolidated in the November 2005 - January 2006 period, the CANSLIM.net After-Market Update on January 12th, 2006 called attention to some concerns during its late-stage base (read here). However, the stock held up well and on January 24th, 2006 it again blasted to another new high on very heavy volume, which was noted in that day's CANSLIM.net After Market Update. The all-time high of $504.00 was reached on April 24th, 2006, capping a +307.83% rise in a period of just under 2 years! More recently, the gap down and loss on heavy volume on April 25th, 2006 was noted in the CANSLIM.net After-market Update as a sell signal. The "island reversal" is a worrisome technical sell signal that was covered in detail in the Featured Stock Update section of the May 1st, 2006 CANSLIM.net After Market Update with an annotated DailyGraph(R) (read here)." Shortly thereafter this issue sliced through an intermediate term upward trendline as the major averages continued declining. Additionally CME broke below its 50 DMA, prompting investors to lock in profits, and it has been unable to trade above that level since. The longer it remains trading under its 50 DMA the worse its outlook becomes. Investors who are successful normally heed multiple sell signals and reduce their exposure when the market turns down. Only a rebound above the 50 DMA would improve its odds of challenging the all-time highs again. This has been an excellent winning example demonstrating the value of CANSLIM.net's timely reports and expert analysis.
C A N S L I M | StockTalk | News | Chart | SEC | Zacks Reports
View all notes | Alert me of new notes | CANSLIM.net Company Profile
Winning Example to Study +307% Gain in Under 2 Years - Friday, June 09, 2006
Chicago Mercantile Exchange Holdings (CME - NYSE) - The company was featured on June 2nd, 2005 at $227.08 in that day's CANSLIM.net Mid-Day Breakouts Report (read here) right as this high-ranked leader was breaking out of a sound base on huge volume. That turned out to be the begining of another substantial leg up for this very strong performer. It immediately traded higher with volume conviction, allowing traders to realize short term profits. Another big volume breakout and a more explosive gap up to all-time highs on June 29th, 2005 quickly added to worry-free gains. This issue was among the market's high-ranked leaders throughout much of 2005, and it helped set an upward pace after the major indices flashed a follow-through day in October 2005. Long-time members may have noticed this stock's earlier Mid-Day BreakOuts Report appearances such as May 19th, 2004 when it was only $123.58. It also made appearances in Mid-Day BreakOuts Reports in June, July, and Sept-Dec '04.
As the stock consolidated in the Novermber 2005 - January 2006 period, the CANSLIM.net After-Market Update on January 12th, 2006 called attention to some concerns during its late-stage base (read here). However, the stock held up well, and on January 24th, 2006 it again blasted to another new high on very heavy volume and was noted in the CANSLIM.net After Market Update. The all-time high of $504.00 was reached on April 24th, 2006, capping a +307.83% rise in a period of just under 2 years! More recently, the gap down and loss on heavy volume on April 25th, 2006 was noted in the CANSLIM.net After-market Update as a sell signal. The "island reversal" is a worrisome technical sell signal that was covered in detail in the Featured Stock Update section of the May 1st, 2006 CANSLIM.net After Market Update with an annotated DailyGraph(R) (read here). This has been an excellent winning example demonstrating the value of CANSLIM.net's timely reports and expert analysis.
C A N S L I M | StockTalk | News | Chart | ![]() DGO | SEC | Zacks Reports
DGO | SEC | Zacks Reports
Chart courtesy www.stockcharts.com 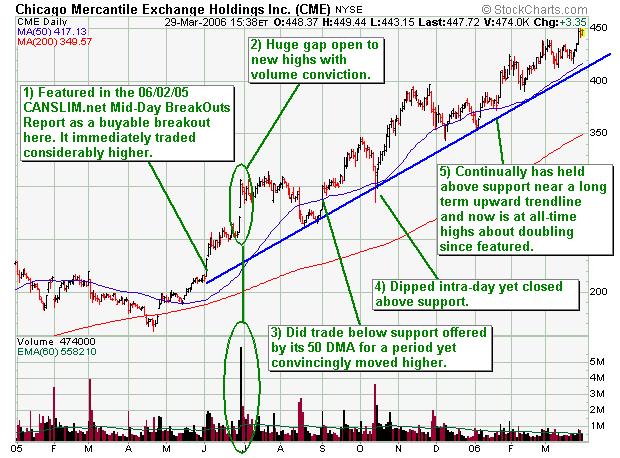
View all notes | Alert me of new notes | CANSLIM.net Company Profile
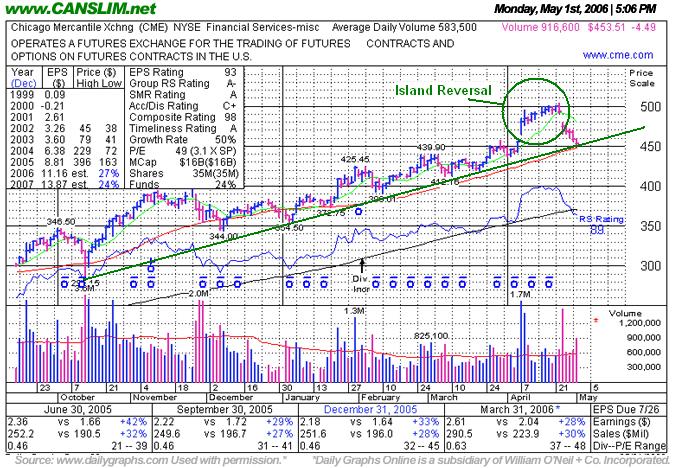
The Bearish Island Reversal and Importance of 50 DMA Support - Monday, May 01, 2006
Gaps are often recognized as very telling signals of institutional pressure on a stock's price, and the island reversal is a worrisome chart pattern which often carries negative ramifications. Another very important technical tool that savvy investors have learned to incorporate in their technical analysis is the 50-day moving average (DMA) line. The 50 DMA line plays a pivotal role relative to a stock's price. If the price of a stock is above its 50 DMA then odds are that its 50 DMA will act as formidable support. Conversely, if the price is below its 50 DMA then the moving average often acts as resistance.
Chicago Mercantile Exchange Holdings Inc. (CME -4.49 or -0.98% to $453.51) has formed an "island reversal" pattern with the 4/07/06 gap up and 4/25/06 gap down and it has over the past several sessions pulled back toward important near term support at its 50 DMA line. Gaps are often recognized as very telling signals of institutional pressure on a stock's price, and the island reversal is a worrisome chart pattern which often carries negative ramifications. This stock was first featured on Thursday, June 2nd, 2005 in the CANSLIM.net Mid Day Breakouts Report (read here) at $227.08 and has surged a stunning +99.7% since. CME has enjoyed a rather orderly rise during the past 11 months, and this leader found decent support near its 50 DMA during the entire run. Caution is advised, however, as long as this issue continues trading above its 50 DMA line it may be considered a fair assumption that higher prices are likely to follow.
C A N S L I M | StockTalk | News | Chart | ![]() DGO | SEC | Zacks Reports
DGO | SEC | Zacks Reports
View all notes | Alert me of new notes | CANSLIM.net Company Profile
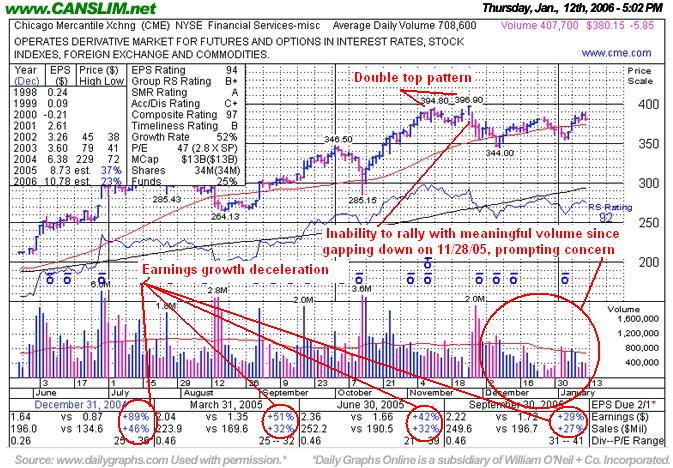
Closely Monitor Weakening Action in Late Stages - Thursday, January 12, 2006
An important point for prudent investors to remain cognizant of is that a strong stock normally builds several bases before it eventually tops out. Needless to say, earlier stage bases are less risky than their later stage counterparts. A general rule that is derived from studying leading stocks over the course of the past several decades is that if volume swells as the stock advances then odds favor that further price appreciation is likely. However, the converse is also true, and a lack of volume behind gains gives investors another reason to question a stock's ability to make a sustained advance in price.
Chicago Mercantile Exchange Holdings Inc. (CME -5.85 or -1.52% to $380.15) was recently featured on 6/2/2005 in the CANSLIM.net Mid-Day Breakouts Report as it was breaking out of a third stage base (read here). Over the past six months or more since this issue was featured it has swelled an impressive +67%. After that impressive rally this leading stock formed a small "double top" pattern, and then it gapped down on 11/28/05. Since then it has been consolidating in close proximity with its 50-day moving average (DMA) line in what may be considered its fourth stage base, and the stock is showing signs of fatigue. These signs include sequentially smaller earnings increases and a lack of volume behind its recent gains, which are noted in the accompanying chart.
The points mentioned above do not mean that this issue cannot break out again and continue racing higher, however any move at this point will be from a late stage base, and late-stage bases are inherently more prone to failure. This issue was among the market's high-ranked leaders throughout much of 2005, and it helped set an upward pace after the major indices flashed a follow-through day in October. It has not participated greatly in the market's rally since the start of the new year. Thus, caution is warranted, and any loss on above average volume would prompt greater concern, especially if it leads to another violation of the 50 DMA or other technical sell signals.
Note: The DailyGraphs Online service helps investors to study important earnings comparisons along with price/volume charts in a very effective manner! Click the image below for information and signup options if you believe this service could help you.
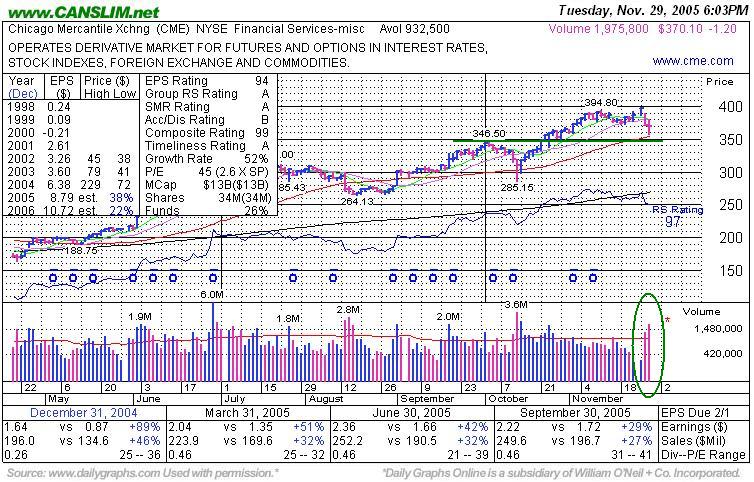
Even the Great Ones Consolidate After Big Gains - Tuesday, November 29, 2005
The first negative sign to watch out for as a technical sell signal would be losses on above average volume leading to a close below this stock's 50-day moving average (DMA) line, now at $353.93. A second worrisome sign to watch out for would be if this issue closes below its prior chart high of October 4th at $346.50 as deterioration beyond that level would negate the most recent breakout that had followed its mid-October test of support at the 50 DMA. At present, this stock's consolidation is looking like nothing more than a normal pullback.
Chicago Mercantile Exchange Holdings Inc. (CME -$1.20 or -0.32% to $370.10) ended slightly lower on above average volume, reversing from earlier lows as momentum had carried it lower after Monday's $25 point drop. CME has been one of the greatest market winners of the past several years. CME was recently featured at $227.08 in the June 2, 2005 CANSLIM.net Mid-Day Breakouts Report (read here) as it was emerging from a solid multi-month base.
Since its impressive breakout this stock shot up more than +74% to $396.90 before its most recent pullback.There are two important lessons one can learn from this leader. First, since its December 2002 IPO this leader has advanced in an orderly fashion (advancing on high volume and declining on low volume). Second, as is the case with all leaders, this issue rallied and then consolidated (built a base), and then rallied again. That said, CME recently broke out of a short base on October 21, 2005, two days after the October 19, 2005 follow through day of gains for the major averages, and the stock has vaulted nearly +20% in that time frame. Following such gains, any stock would be considered overdue for a pullback.
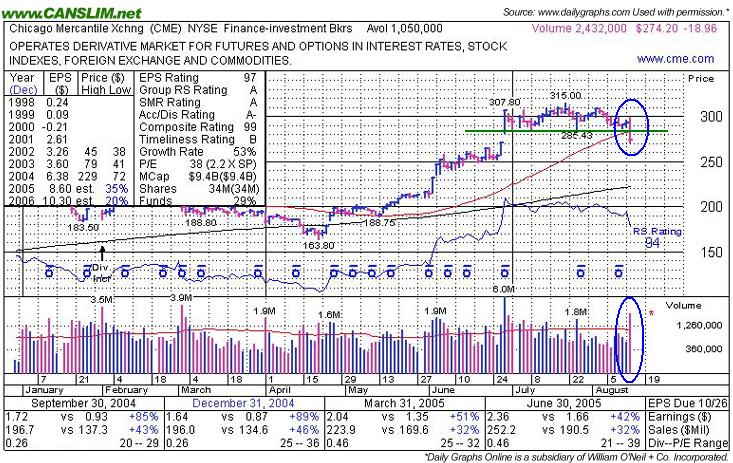
Consider Break Below 50 DMA a Signal to Take Some Profits - Monday, August 15, 2005
The Chicago Mercantile Exchange (CME -$18.96 or -6.47% to $274.20) violated support offered by its lows of its most recent base and its 50-day moving average line, closing near its session lows today with a considerable loss on volume that was more than twice its average daily trading total. After a very impressive rally this stock appeared to be building a new base for the past six weeks between $281-315. During that time, its 50 day moving average (50 DMA) was steadily catching up to its price. Typically, a healthy stock finds support at its 50 DMA, however, this was not the case with CME. Prices were up solidly in the morning, then it reversed and closed below its 50 DMA. That left material damage to this issue, definitely giving investors cause for concern. The negative reversal day coupled with its inability to find support at its 50 DMA would generally suggest negative ramifications looking forward. Only a prompt recovery in the next day or two with gains on heavy volume might help it to avoid a more serious correction toward its 200-day moving average.
Disiplined investors may view the action today as a technical sell signal and a reason to lock in the profits that may have been gained since this issue was featured on June 2, 2005 at $228.37 in CANSLIM.net's Mid-Day Report (read here) - as it was racing towards its pivot point.
C A N S L I M | StockTalk | News | Chart | SEC | Zacks Reports