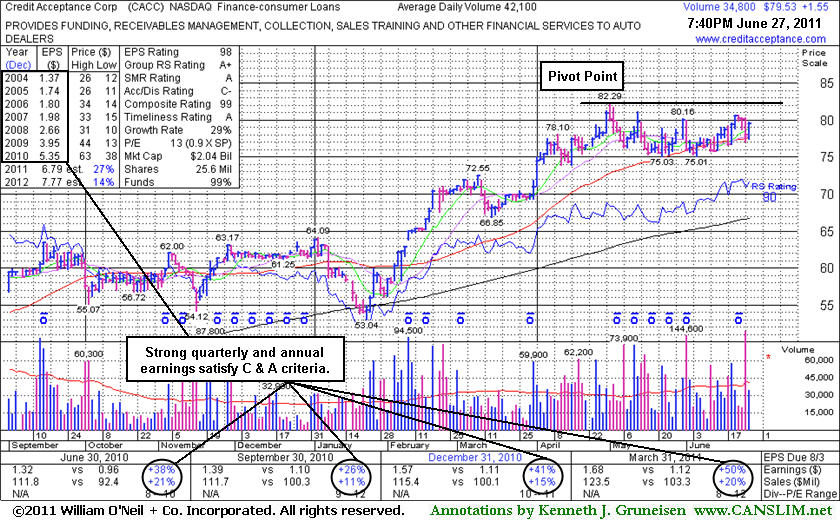
Credit Acceptance Corp (CACC +$1.55 or +1.99% to $79.53) is a high-ranked leader in the Finance - Consumer Loans industry consolidating just above its 50-day moving average (DMA) line. It faces little resistance due to overhead supply while now perched -3.4% off its 52-week high. Its color code was changed back to yellow after its recent resilience. Disciplined investors may watch for gains above its recent highs and wait for a follow-through day from at least one of the major averages to confirm a new rally (M criteria). Meanwhile, recent lows near $75 define important support to watch just below initial support at its 50 DMA line. It has endured distributional pressure since its last appearance in this FSU section on 06/06/11 with an annotated weekly graph under the headline, "Increasing Ownership By Top-Rated Funds is a Plus". It was featured in yellow in the 6/02/11 mid-day report with an annotated daily graph (read here) with a pivot point based on its 52-week high plus 10 cents.
It is thinly traded (42,100 shares average daily volume) and has a small supply (S criteria) of shares outstanding. Its strong earnings history satisfies the C and A criteria. The number of top-rated funds owning its shares rose from 181 in Jun '10 to 219 in Mar '11, a reassuring sign concerning the I criteria of the fact-based system. The M criteria currently argues against new buying efforts until a new confirmed rally with follow-through day (FTD). Meanwhile, a subsequent gain above its pivot point with heavy volume, coupled with a new FTD, could trigger a technical buy signal.
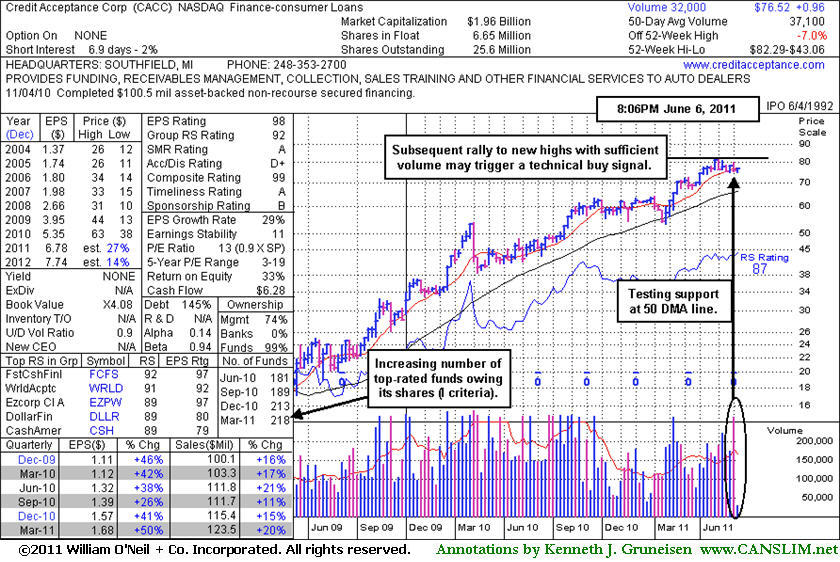
Credit Acceptance Corp (CACC +$0.96 or +1.27% to $76.52) is a high-ranked leader in the Finance - Consumer Loans industry that was recently featured in yellow in the 6/02/11 mid-day report with an annotated daily graph (read here). It has formed a sound new base pattern of sufficient length and its color code was changed to yellow with a pivot point based on its 52-week high plus 10 cents.
It is thinly traded (37,100 shares average daily volume) and has a small supply (S criteria) of shares outstanding. Its strong earnings history satisfies the C and A criteria. As seen on the weekly graph below, the number of top-rated funds owning its shares rose from 181 in Jun '10 to 218 in Mar '11, a reassuring sign concerning the I criteria of the fact-based system. It is consolidating near its 50-day moving average (DMA) line which defines important support along with recent lows near $75. The M criteria currently argues against new buying efforts until a new confirmed rally with follow-through day (FTD). Meanwhile, a subsequent gain above its pivot point with heavy volume, coupled with a new FTD, could trigger a technical buy signal.
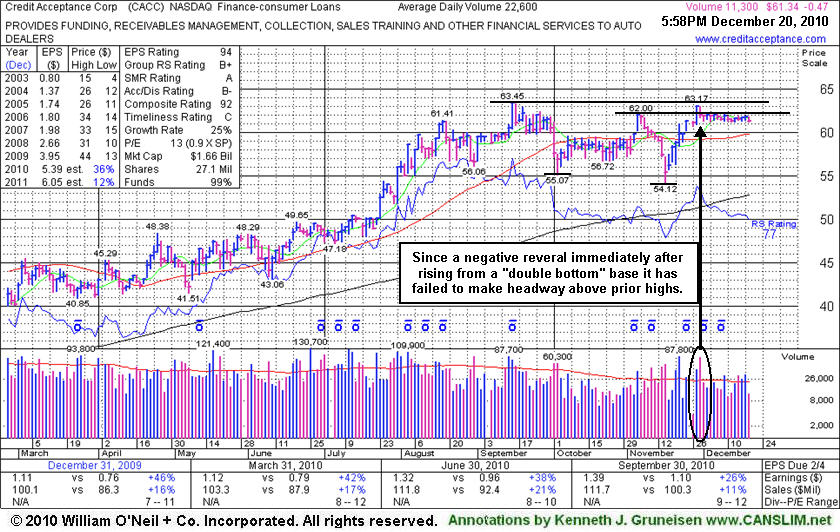
Credit Acceptance Corp (CACC +$0.29 or +0.50% to $58.81) has remained in a very tight trading range since a negative reversal immediately following its breakout. Additional volume-driven gains into new high territory would be a very reassuring sign. It is still hovering in a very tight range only -3.3% off its 52-week high. Its Relative Strength line and rating (77 now) have been slumping while stubbornly holding its ground since the 11/29/10 gain with +69% above average volume triggered a technical buy signal.
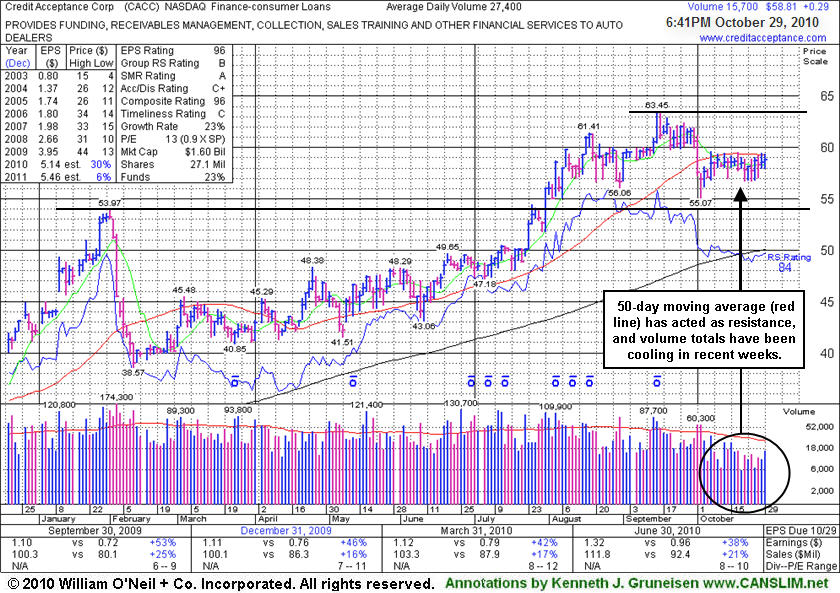
Volume totals have been mostly quiet in recent weeks while the high-ranked Finance - Consumer/Commercial Loans firm has been consolidating above its 50-day moving average (DMA) line. Its small supply (S criteria) of only 5.43 million shares in the public float could contribute to greater volatility in the event of any institutional buying or selling. Return On Equity now reported at +30% is well above the +17% guideline. The number of top-rated funds owning its shares rose from 162 in Dec '09 to 186 in Sep '10, a reassuring sign with respect to the I criteria. It maintained a great track record of annual and quarterly sales revenues and earnings increases, satisfying the C and A criteria of the fact-based investment system's fundamental guidelines. The latest quarter ended September 30, 2010 showed earnings +26% on +11% sales revenues, the weakest increases in at least 8 quarterly comparisons, however, raising some concerns.
Credit Acceptance Corp's (CACC +$0.29 or +0.50% to $58.81) volume totals have been drying up in recent weeks while the high-ranked Finance - Consumer/Commercial Loans firm has been consolidating below its 50-day moving average (DMA) line. That important short-term average has been a stubborn resistance level since it was violated 4 weeks ago with losses on higher volume. Convincing gains above its 50 DMA would be an encouraging sign that would help its outlook, technically. It is due to report earnings on Monday, November 1, 2010, after the market closes. Its small supply (S criteria) of only 5.15 million shares in the public float could contribute to greater volatility in the event of any institutional buying or selling. The number of top-rated funds owning its shares rose from 28 in Sept '09 to 39 in Sep '10, a reassuring sign with respect to the I criteria.
CACC was featured in the 7/29/10 mid-day report (read here) after quietly reaching new high territory. The pivot point cited was based on its 2/01/10 high plus ten cents. It maintained a great track record of annual and quarterly sales revenues and earnings increases satisfying the C and A criteria of the fact-based investment system's fundamental guidelines. That cannot be said for its peer in the same industry group, Americredit Corp (ACF), which recently bankrupted GM made a bid to acquire on July 22, 2010, immediately after President Obama signed into law the Dodd-Frank Wall Street Reform and Consumer Protection Act.
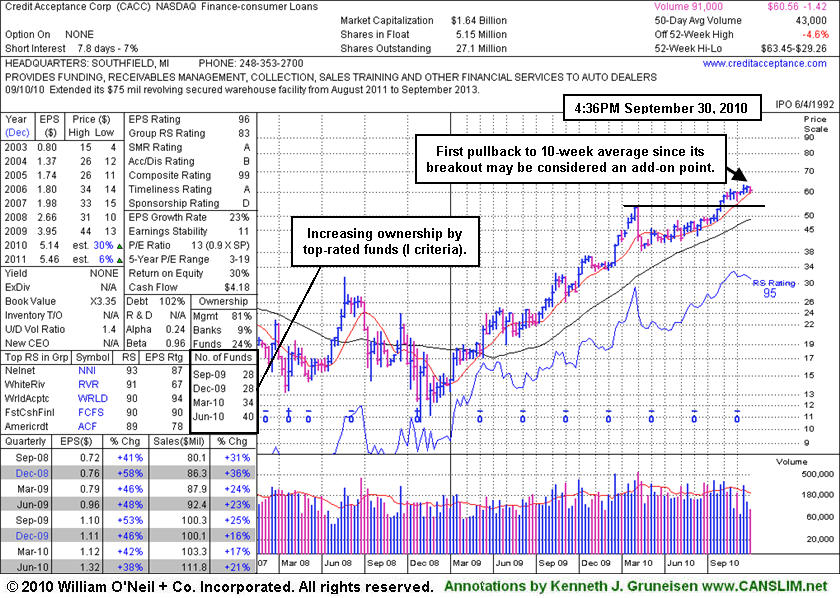
New or add-on buying efforts may be justifiable at times under the investment system's discipline. In today's FSU section we will take a look at one example that this approach may be applied to. If you miss an opportunity to buy when a stock first triggers a technical buy signal, be aware that additional ideal opportunities to accumulate shares will occasionally present themselves. Following a successful breakout, one ideal add-on point is when the stock pulls back and makes its very first test at its 10-week moving average. That varies slightly from the 50-day moving average, although a time span of 50 days and 10 weeks of market action seems fairly synonymous
Credit Acceptance Corp's (CACC -$0.99 or -1.61% to $60.56) volume totals have been drying up in recent weeks while the high-ranked Finance - Consumer/Commercial Loans firm has been consolidating in a healthy fashion. Its 50-day moving average (DMA) line has been catching up. It is an encouraging sign when a stock stubbornly holds its ground at highs and volume dries up, as this suggests that willing sellers are scarce. It has fared well since its last appearance in this FSU section on 8/02/10 under the headline Hovering At New Highs Ahead Of Earnings News. Its small supply (S criteria) of only 5.15 million shares in the public float could contribute to greater volatility in the event of any new institutional posturing. The number of top-rated funds owning its shares has already shown a favorable trend, rising from 28 in Sept '09 to 40 in Jun '10, a reassuring sign with respect to the I criteria.
New or add-on buying efforts may be justifiable under the investment system's discipline at its 10-week average, and while it rallies as long as it does not get extended more than +5% above its latest chart hight ($63.45 +5% or $66.62). We are not identifying a new pivot point because it has not created a sound new base, yet its color code is changed to yellow. Disciplined investors remember to always limit losses if a stock falls -7-8% from their buy point. In the case of a pullback, shares bought at higher levels may need to be sold based upon adherence to the sell rules, even while holding the shares owned at lower prices.
CACC was featured in the 7/29/10 mid-day report (read here) after quietly reaching new high territory. The pivot point cited was based on its 2/01/10 high plus ten cents. It maintained a great track record of annual and quarterly sales revenues and earnings increases satisfying the C and A criteria of the fact-based investment system's fundamental guidelines. That cannot be said for its peer in the same industry group, Americredit Corp (ACF), which recently bankrupted GM made a bid to acquire on July 22, 2010, immediately after President Obama signed into law the Dodd-Frank Wall Street Reform and Consumer Protection Act.
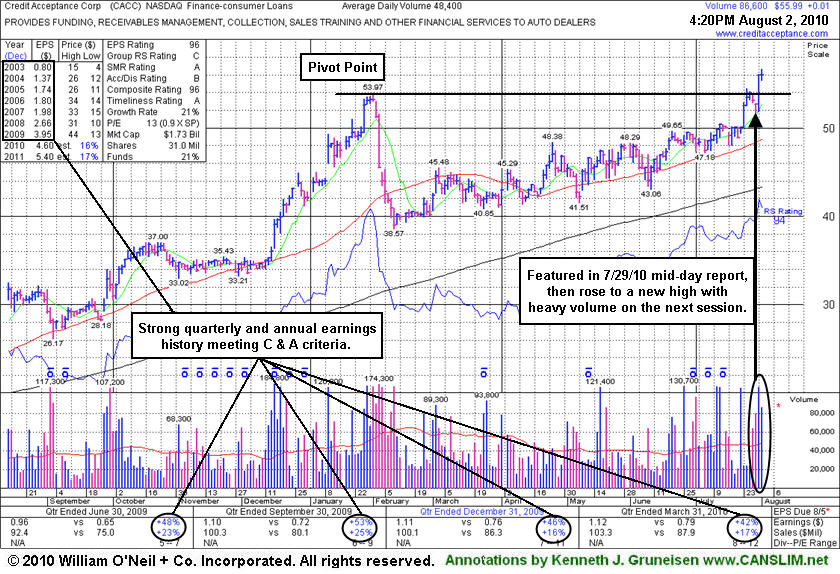
Credit Acceptance Corp (CACC -$0.12 or -0.21% to $55.86) held its ground today perched at all-time highs after its 7/30/10 gain with more than twice average volume helped it trade above its pivot point and trigger a technical buy signal. Keep in mind that volume and volatility often increase near earnings news and the high-ranked Finance - Consumer/Commercial Loans firm is due to report earnings on Tuesday, August 3rd after the close. New buying efforts may be justifiable under the investment system's strict technical buying discipline as long is not extended more than +5% above its prior chart high or pivot point. Its small supply (S criteria) of only 5.89 million shares in the public float could contribute to greater volatility in the event of any new institutional posturing. Disciplined investors remember to always limit losses if a stock falls -7-8% from their buy point.
It has steadily risen since subsequently finding support above the $38 area cited as a support level to watch, and CACC was featured in the 7/29/10 mid-day report (read here) after quietly reaching new high territory. The pivot point cited was based on its 2/01/10 high plus ten cents. It maintained a great track record of annual and quarterly sales revenues and earnings increases satisfying the C and A criteria of the fact-based investment system's fundamental guidelines. That cannot be said for its peer in the same industry group, Americredit Corp (ACF), which recently bankrupted GM made a bid to acquire the day immediately after President Obama signed into law the Dodd-Frank Wall Street Reform and Consumer Protection Act.
Credit Acceptance Corp produced gains of as much as +61.2% since it was first featured in yellow at $33.48 in the 9/29/09 mid-day report (read here). The FSU section appearance on 2/09/10 included an annotated graph under the headline "Damaging Losses Prompted Profit Taking" and it was later dropped from the Featured Stocks list.
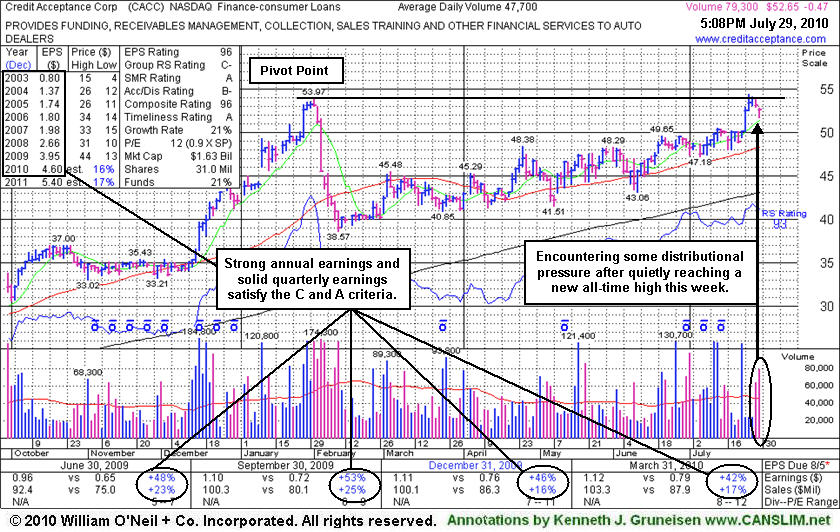
Credit Acceptance Corp (CACC -$0.47 or -0.88% to $52.65) has steadily risen since finding support above the $38 area cited as a support level to watch when it was last shown in this FSU section on 3/02/10 under the headline, "Gain Above 50 DMA Line Helps, But More Time And Constructive Action Needed." It is consolidating near all-time highs after quietly reaching new high territory this week. It was featured in the mid-day report today (read here) in yellow with a new pivot point cited is based on its 2/01/10 high plus ten cents. A powerful breakout should occur before new buying efforts would be justifiable under the investment system's strict technical buying discipline. Its small supply (S criteria) of only 5.89 million shares in the public float could contribute to greater volatility in the event of any new institutional posturing.
Its strong quarterly and annual earnings track record satisfies the C and A criteria of the investment system. It is a good match with the fact-based investment system's fundamental guidelines, as opposed to its peer in the Finance - Consumer Loans group, Americredit Corp (ACF), which recently bankrupted GM bid to acquire the day after President Obama signed into law the Dodd-Frank Wall Street Reform and Consumer Protection Act.
Based on weak action CACC was dropped from the Featured Stocks list on 3/16/10. An earlier FSU section appearance on 2/09/10 included an annotated graph under the headline "Damaging Losses Prompted Profit Taking". It produced gains of as much as +61.2% since it was first featured in yellow at $33.48 in the 9/29/09 mid-day report (read here).
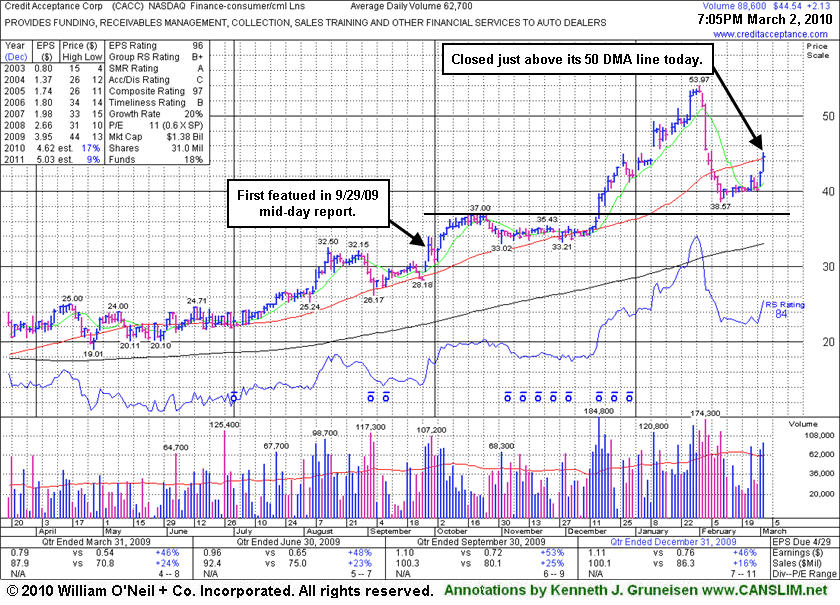
Credit Acceptance Corp (CACC +$2.13 or +5.02% to $44.54) rallied for a considerable gain today and closed just pennies above its 50-day moving average (DMA) line. The recent gains have helped its outlook improve, yet it still needs more time to build a new sound base before new buying efforts would be justifiable under the investment system's strict technical buying discipline. Its small supply (S criteria) of only 5.89 million shares in the public float could contribute to greater volatility in the event of any new institutional posturing. On Monday Jan 25th the company announced the pricing of $250 Million Senior Secured Notes, and it only rallied a little higher afterward before investors were prompted to consider locking in profits as worrisome distributional action transpired. The 50 DMA could act as a resistance level, whereas in the past it served as support. Continued progress above that short-term average is critical to its chances of eventually producing a new sound base and buy point. Its last FSU section appearance on 2/09/10 included an annotated graph under the headline "Damaging Losses Prompted Profit Taking".
The Finance - Consumer/Commercial Loans firm has maintained a great track record of annual and quarterly sales revenues and earnings increases that satisfy the C and A criteria of the investment system. It produced gains of as much as +61.2% since it was first featured in yellow at $33.48 in the 9/29/09 mid-day report (read here). After it was initially featured, it went on to later build a new sound base on top of its prior base. New pivot point and max buy levels were noted on 11/19/09, yet it stubbornly held its ground in a tight range for another month plus before finally blasting to new all-time highs with heavy volume on 12/16/09.
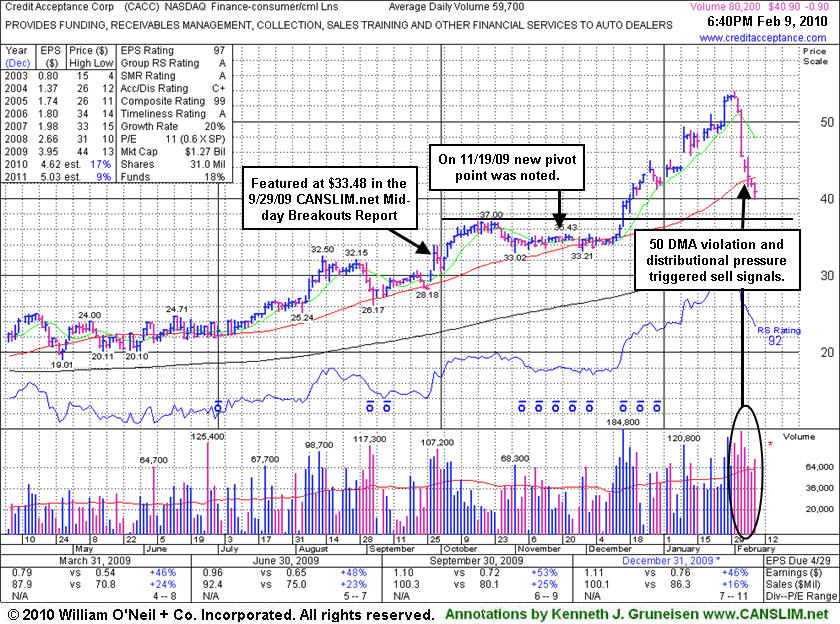
Credit Acceptance Corp (CACC -$0.90 or -2.15% to $40.90) has fallen sharply in the course of its current 7-session losing streak. Investors were prompted to consider locking in profits as worrisome action has transpired since its last FSU section appearance on 1/28/10 under the headline "Strong Leader Extended After Producing Big Gains." Damaging losses have quickly erased a large portion gains of as much as +61.2% since it was first featured in yellow at $33.48 in the 9/29/09 mid-day report (read here). After it was initially featured, it went on to later build a new sound base on top of its prior base. New pivot point and max buy levels were noted on 11/19/09, yet it stubbornly held its ground in a tight range for another month plus before finally blasting to new all-time highs with heavy volume on 12/16/09.
Distributional action recently has raised concerns and triggered technical sell signals as it violated its 50-day moving average (DMA) line. Previous chart highs at $37 define the next important support level to watch. Right now, however, the M criteria is an overriding concern which discourages new buying efforts until a proper follow-through day emerges. This stock also needs time to build a new sound base before new buying efforts would be justifiable under the investment system's strict technical buying discipline. On Monday Jan 25th the company announced the pricing of $250 Million Senior Secured Notes. The Finance - Consumer/Commercial Loans firm has maintained a great track record of annual and quarterly sales revenues and earnings increases that satisfy the C and A criteria of the investment system.
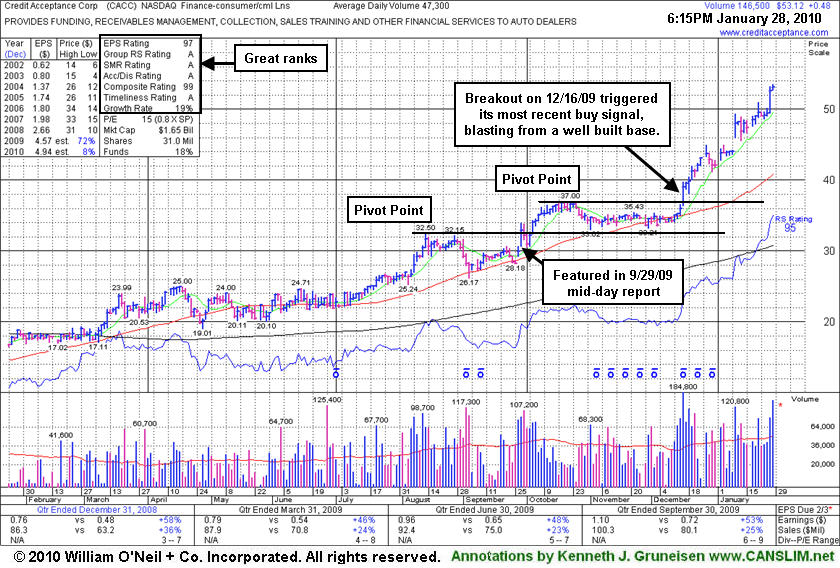
Credit Acceptance Corp (CACC +$0.48 or +0.91% to $53.12) has traded as much as +59.80% higher since it was featured in yellow in the 9/29/09 mid-day report (read here) when a breakout gain was backed by more than 2 times average volume. After it was initially featured, it went on to later build a new sound base on top of its prior base. New pivot point and max buy levels were noted on 11/19/09, yet it stubbornly held its ground in a tight range for another month plus before finally blasting to new all-time highs with heavy volume on 12/16/09. It has hardly dipped lower since, and the latest gains leave it very extended from its latest base. It is well above its 50-day moving average (DMA) line, an important support level to watch above its previous chart highs at $37, the next important support level to watch.
Disciplined investors avoid chasing extended stocks that have risen more than +5% above their prior chart high or pivot point. If they miss the ideal window of opportunity, patience may allow investors to accumulate shares on light volume pullbacks, or when another new base forms and a new buy signal is triggered. Investors can then "force feed" their winners by adding to already profitable positions whenever additional buys can be made within the proper parameters. According to the investment system rules, averaging down should never be done.
On Monday Jan 25th the company announced the pricing of $250 Million Senior Secured Notes. The Finance - Consumer/Commercial Loans firm has maintained a great track record of annual and quarterly sales revenues and earnings increases that satisfy the C and A criteria of the investment system. Right now, however, the M criteria is an overriding concern which discourages new buying efforts until a proper follow-through day emerges. Should market conditions further erode, investors may be further prompted to consider locking in profits to raise cash.
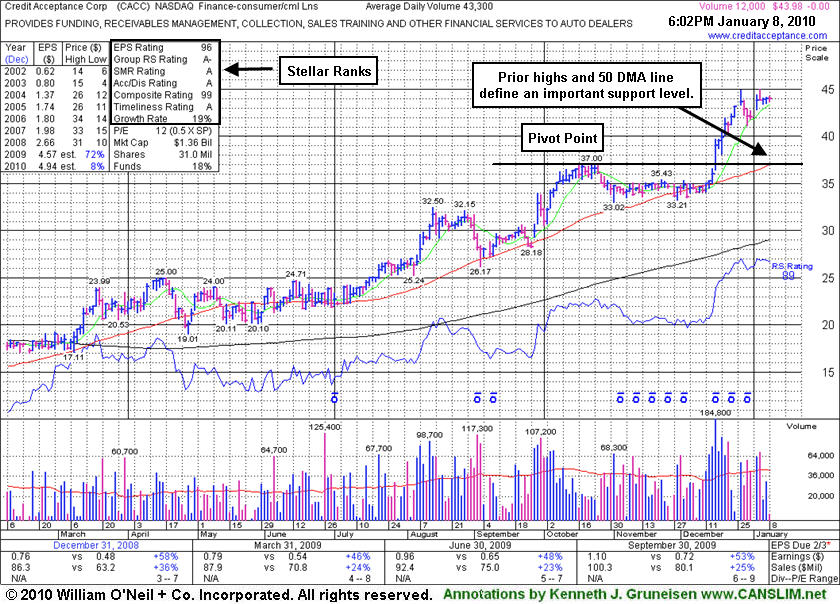
Credit Acceptance Corp (CACC -$0.00 or -0.00% to $43.98) is stubbornly holding its ground perched at all-time highs, extended from its prior base. Previous chart highs and its 50-day moving average line now coincide at $37, defining an important support level to watch. The Finance - Consumer/Commercial Loans firm has maintained a great track record of annual and quarterly sales revenues and earnings increases that satisfy the C and A criteria of the investment system.
Disciplined investors avoid chasing extended stocks that have risen more than +5% above their prior chart high or pivot point. If they miss the ideal window of opportunity, patience may allow investors to accumulate shares on light volume pullbacks, or when another new base forms and a new buy signal is triggered. Investors can then "force feed" their winners by adding to already profitable positions whenever additional buys can be made within the proper parameters. According to the investment system rules, averaging down should never be done. CACC was featured in yellow in the 9/29/09 mid-day report (read here) as a breakout gain was backed by more than 2 times average volume. Since first featured it has also risen above its 2006-2007 highs ($33-34) to new all-time highs, which is a very reassuring sign of strength.
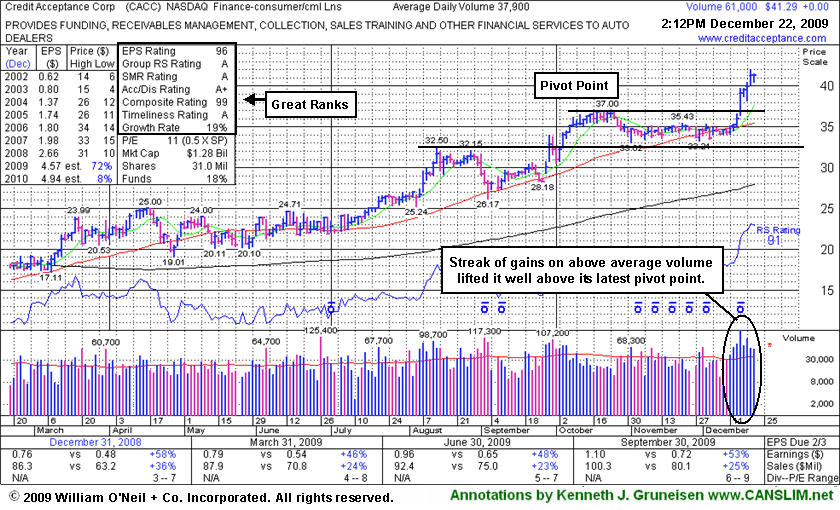
Credit Acceptance Corp (CACC -$0.05 or -0.15% to $41.24) saw its winning streak into new all-time high territory end today with a small loss after 7 consecutive gains. Prior chart highs in the $35-37 area are an important support level to watch now, but weakness would raise more serious concerns if volume expands behind damaging losses that lead to it slumping back into its prior base. The Finance - Consumer/Commercial Loans firm has maintained a great track record of annual and quarterly sales revenues and earnings increases that satisfy the C and A criteria of the investment system. It was previously noted while showing some resilience near its important short-term average line while enduring some recent distributional pressure.
Disciplined investors avoid chasing extended stocks that have risen more than +5% above their prior chart high or pivot point. If they miss the ideal window of opportunity, patience may allow investors to accumulate shares on light volume pullbacks, or when another new base forms and a new buy signal is triggered. Investors can then "force feed" their winners by adding to already profitable positions whenever additional buys can be made within the proper parameters. According to the investment system rules, averaging down should never be done. The high-ranked leader's 9/29/09 breakout gain was backed by more than 2 times average volume. Since first featured it has also risen above its 2006-2007 highs ($33-34) to new all-time highs, which is a very reassuring sign of strength. CACC was featured in yellow in the 9/29/09 mid-day report (read here).
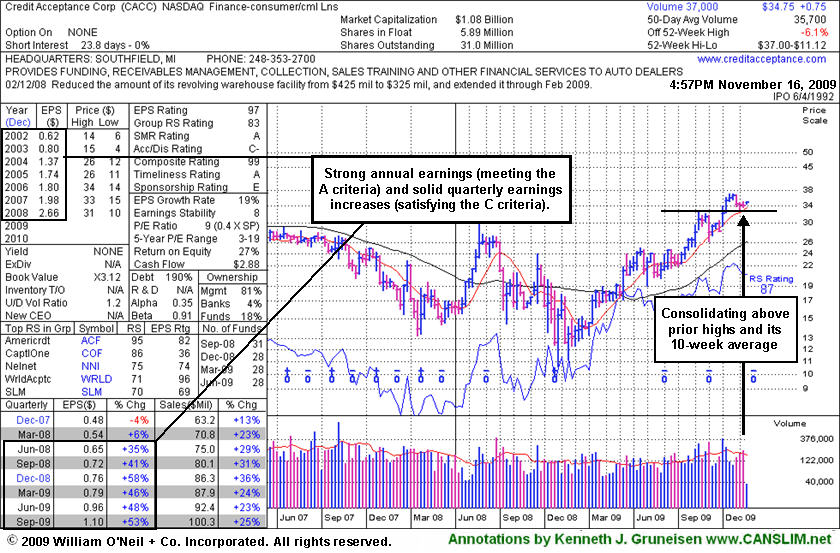
Credit Acceptance Corp (CACC -$0.30 or -0.87% to $34.26) is consolidating just below its 50-day moving average (DMA) line (now $34.77). It has been showing some resilience near that important short-term average line while enduring some distributional pressure. After an 8-week flat base it is continuing its consolidation above prior chart highs in the $32 area, building a base-on-base pattern. The Finance - Consumer/Commercial Loans firm has maintained a great track record of annual and quarterly sales revenues and earnings increases that satisfy the C and A criteria of the investment system. The high-ranked leader's 9/29/09 breakout gain was backed by more than 2 times average volume. Since featured it has also risen above its 2006-2007 highs ($33-34) to new all-time highs, which is a very reassuring sign of strength. CACC was featured in yellow in the 9/29/09 mid-day report (read here).
Investors might be concerned about the weakness and wait for signs of support while considering the current consolidation an opportunity to accumulate shares on the stock's first pullback to its 50 DMA line since its bullish breakout. However, it has met the definition of a new "flat base" which could eventually be followed by a fresh technical buy signal. In fact, a base-on-base pattern is considered to be a very solid set-up pattern. Patience may allow investors to see more proof of institutional buying demand (the I criteria), and make initial buys or add-on buying efforts in the event of a powerful breakout above its $37 high with volume. Meanwhile, further weakness would raise more serious concerns, especially if volume expands behind more damaging losses under its recent lows.
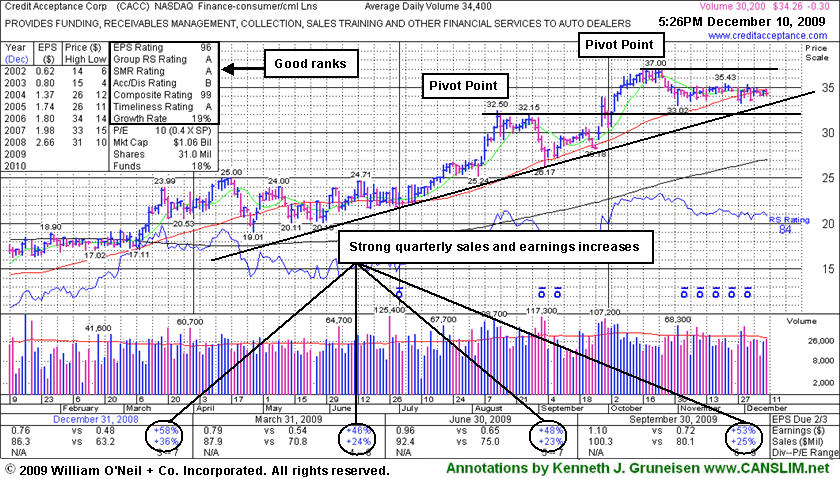
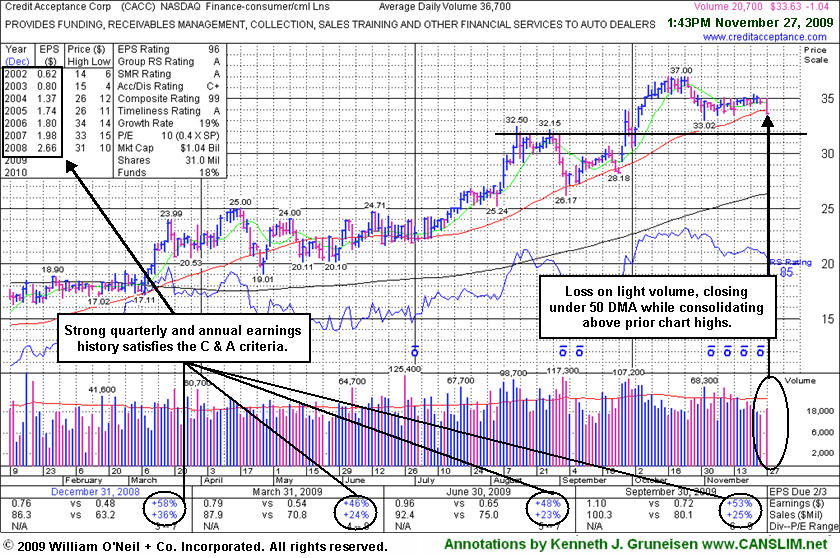
Credit Acceptance Corp (CACC -$1.04 or -3.00% to $33.63) gapped down today amid widespread market weakness and closed just under its 50-day moving average (DMA) line and also under recent low closes with a loss on light volume. Its color code was changed to yellow recently with new pivot point and max buy levels noted. After a 6-week flat base it is continuing its consolidation above prior chart highs in the $32 area, building a base-on-base pattern. The Finance - Consumer/Commercial Loans firm has maintained a great track record of annual and quarterly sales revenues and earnings increases that satisfy the C and A criteria of the investment system. The high-ranked leader's 9/29/09 breakout gain was backed by more than 2 times average volume. Since featured it has also risen above its 2006-2007 highs ($33-34) to new all-time highs, which is a very reassuring sign of strength. CACC was featured in yellow in the 9/29/09 mid-day report (read here).
Investors might be concerned about the weakness and wait for signs of support while considering the current consolidation an opportunity to accumulate shares on the stock's first pullback to its 50 DMA line since its bullish breakout. However, it has met the definition of a new "flat base" which could eventually be followed by a fresh technical buy signal. In fact, a base-on-base pattern is considered to be a very solid set-up pattern. Patience may allow investors to see more proof of institutional buying demand (the I criteria), and make initial buys or add-on buying efforts in the event of a powerful breakout above its $37 high with volume. Meanwhile, further weakness would raise more serious concerns, especially if volume expands behind more damaging losses.
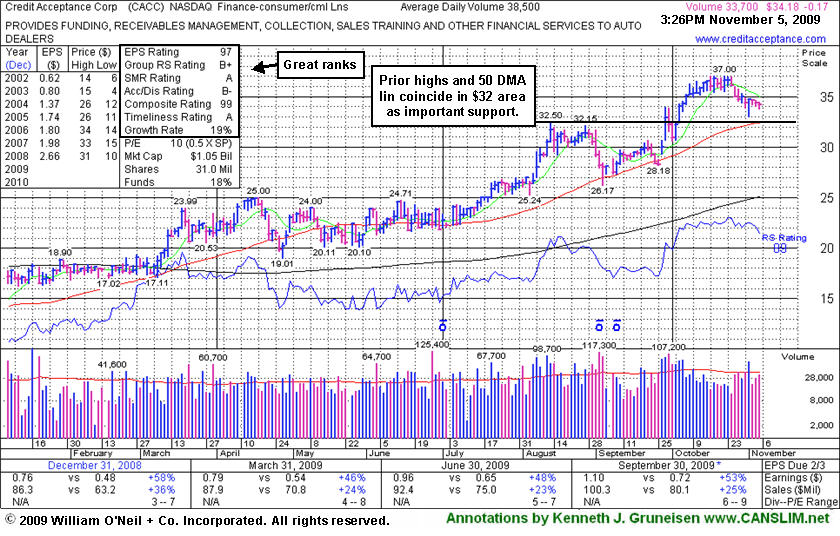
Credit Acceptance Corp (CACC +$0.75 or +2.21% to $34.75) opened the week with a small gap up gain today on average volume. It is continuing its consolidation in an orderly fashion above prior chart highs and its 50-day moving average (DMA) line in the $32 area. They coincide to define an important support level to watch on pullbacks. The Finance - Consumer/Commercial Loans firm has maintained a great track record of annual and quarterly sales revenues and earnings increases, satisfying the C and A criteria of the investment system. The high-ranked leader's 9/29/09 breakout gain was backed by more than 2 times average volume. Since featured it has also risen above its 2006-2007 highs ($33-34) to new all-time highs, which is a very reassuring sign of strength. CACC was featured in yellow in the 9/29/09 mid-day report (read here).
Investors might consider the current consolidation an opportunity to accumulate shares, however its recent price/volume action gives watchful investors an indication it is encountering some distributional pressure. Without chasing it more than +5% above prior chart highs, one might watch for a sound new base to form. It has been consolidating for 4 weeks since hitting a 2009 high of $37.00. In another week it might meet the definition of a new "flat base" which, at 5-weeks minimum, is technically the shortest of all basic chart patterns.
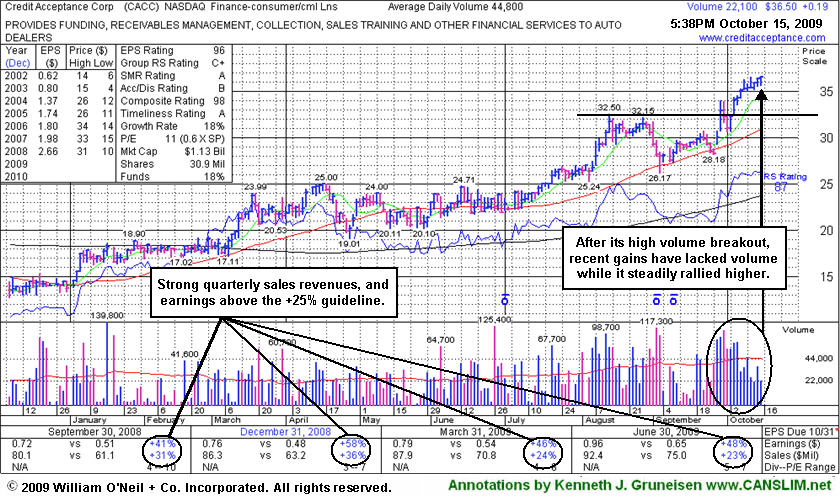
Credit Acceptance Corp (CACC -$0.35 or -1.02% to $34.00) has been quietly consolidating since its impressive positive reversal was noted on 11/02/09. Prior chart highs and its 50-day moving average (DMA) line coincide in the $32 area, an important level to watch on pullbacks. It had posted 10 consecutive gain for a new high close well above its "max buy" level when it last appeared in this Featured Stock Update section on 10/15/09 with an annotated graph under the headline, "Finance Firm Extended After 10-Day Winning Streak." The high-ranked Finance-Consumer/Commercial Loans firm's 9/29/09 breakout gain was backed by more than 2 times average volume. Since featured it has also risen above its 2006-2007 highs ($33-34) to new all-time highs, which is a very reassuring sign of strength. CACC was featured in yellow in the 9/29/09 mid-day report (read here).
Investors might consider a light volume pullback to offer an opportunity to accumulate shares without chasing them more than +5% above its prior chart highs. However, market conditions (M criteria) have recently been noted as an overriding concern suggesting that investors hold off on any new buying efforts. The lighter NYSE volume total reported today left the new rally effort still in need of a confirming follow-through-day, and there remains a clear lack of new leadership. For any sustainable rally, the market needs a healthy crop of stocks rising for new highs on heavier that normal volume.
Credit Acceptance Corp (CACC +$0.19 or +0.52% to $36.50) posted a 10th consecutive gain for a new high close well above its "max buy" level. Prior chart highs in the $32 area are now an important support level to watch on pullbacks. Disciplined investors might watch for a light volume pullback to offer an opportunity to accumulate shares without chasing them more than +5% above its prior chart highs. The high-ranked Finance-Consumer/Commercial Loans firm found prompt support near its prior chart highs during a brief pullback immediately following its 9/29/09 breakout with a considerable gain backed by more than 2 times average volume. Since triggering a technical buy signal we have noted that, "There is no overhead supply to hinder its upward price progress." However, it is now extended from its latest sound base, thus it is no longer buyable under the investment system guidelines. Since featured it has also risen above its 2006-2007 highs ($33-34) to new all-time highs, which is a very reassuring sign of strength. CACC was featured in yellow in the 9/29/09 mid-day report (read here).
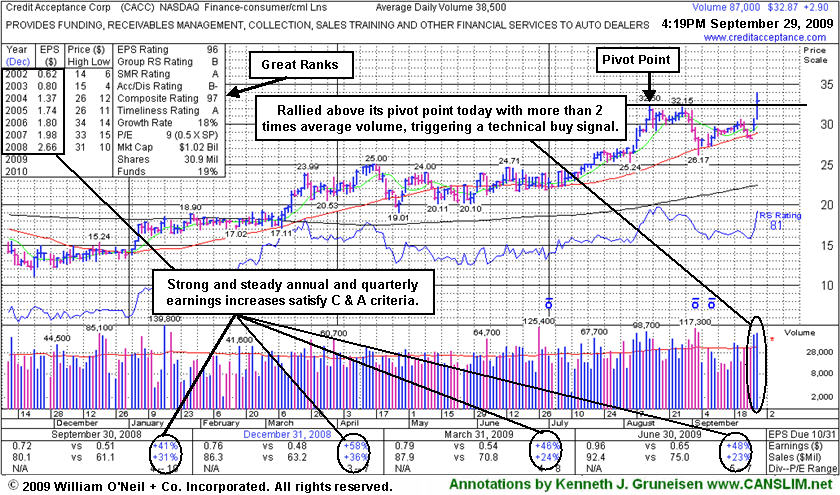
Credit Acceptance Corp (CACC +$2.90 or +9.68% to $32.87) gapped up for a second consecutive session and hit a new 52-week high as it rallied above its pivot point today, closing in the upper half of its trading range. The considerable gain backed by more than 2 times average volume triggered a technical buy signal. There is not any overhead supply to hinder its upward price progress now. It is near multi-year chart highs, and its ability to clear its 2006-2007 highs ($33-34) and reach new all-time highs would be a very reassuring sign to be watching for in the days ahead. The high-ranked Finance-Consumer/Commercial Loans firm was featured earlier today in yellow in the mid-day report (read here). Disciplined investors would avoid chasing the stock more than +5% above its pivot point. Any reversal leading to a close below its prior high closes would raise concerns, and as always, a sound loss-limiting strategy requires investors to sell any stock if it ever falls more than -7% from the price paid.