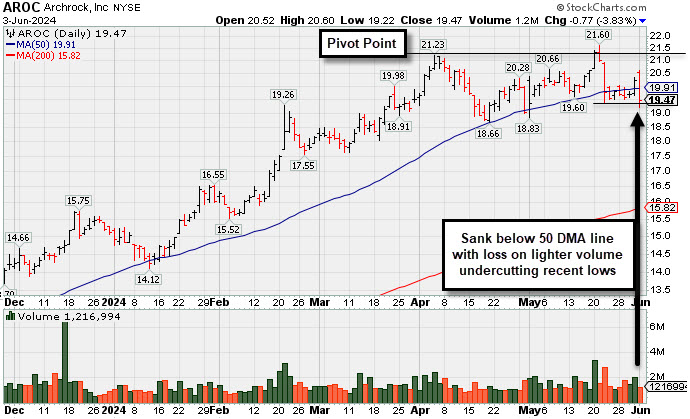
Slump Below 50-Day Moving Average Again Hurts Outlook - Monday, June 3, 2024
Archrock (AROC -$0.77 or -3.80% to $19.47) suffered a loss today with below-average volume as it slumped back below its 50-day moving average (DMA) line ($20). It also undercut the recent lows hurting its outlook and its color code was changed to green. A rebound above its 50-day moving average (DMA) line is again needed for its outlook to improve.
AROC has faltered and encountered distributional pressure since highlighted in yellow with pivot point cited based on its 4/04/24 high plus 10 cents in the 5/20/24 mid-day report (read here). It was shown in detail that evening with an annotated graph under the headline, "Strong Finish for Archrock After Highlighted in Mid-Day Report".
It has a highest possible Earnings Per Share Rating of 99. Earnings increases have been above the +25% mninimum guideline in quarterly comparisons through Mar '24 versus the year-ago periods. Annual earnings (A criteria) growth has been strong after a loss in FY '20. It hails from the Oil and Gas-Machinery/Equip group which is currently ranked 52nd on the 197 Industryu Groups List (L criteria).
There are 156.3 million shares (S criteria) outstanding. The number of top-rated funds owning its shares rose frm 380 in Jun '23 to 451 in Mar '24, a reassuring sign concerning the I criteria. Its current Up/Down Volume Ratio of 1.4 is an unbiased indication its shares have been under accumulation over the past 50 days.
| Symbol/Exchange Company Name Industry Group | PRICE | CHANGE | Day High | Volume (% DAV) (% 50 day avg vol) | 52 Wk Hi | Featured Date | Price Featured | Pivot Featured |
| Max Buy | ||||||||
TransDigm Group Aerospace/Defense | $1,339.19 | -4.04 -0.30% | $1,356.98 | 183,325 50 DAV is 200,000 | $1,363.66 -1.79% | 4/12/2024 | $1,224.21 | PP = $1,246.32 |
| MB = $1,308.64 | ||||||||
G - Still hovering near its all-time high after a "negative reversal" on 5/28/24. It is extended from any sound base and its 50 DMA line ($1,264) defines near-term support to watch on pullbacks. Fundamentals remain strong. >>> FEATURED STOCK ARTICLE : Aerospace/Defense Firm Hitting Another All-Time High - 5/21/2024 | View all notes | Set NEW NOTE alert | Company Profile | SEC News | Chart | Request a new note | ||||||||
U.S. Lime & Minerals Bldg-Cement/Concrt/Ag | $341.16 | -1.58 -0.46% | $345.75 | 19,673 50 DAV is 25,000 | $378.78 -9.93% | 2/9/2024 | $254.68 | PP = $265.09 |
| MB = $278.34 | ||||||||
| Most Recent Note - 5/30/2024 6:13:44 PM G - Posted a small gain today with below average volume, breaking a streak of 10 consecutive small losses. Its 50 DMA line ($323.25) defines important near-term support to watch. Fundamentals remain strong. >>> FEATURED STOCK ARTICLE : Stubbornly Held Ground and Posted Quiet Gain for Best-Ever Close - 5/14/2024 | View all notes | Set NEW NOTE alert | Company Profile | SEC News | Chart | Request a new note | ||||||||
Celestica Elec-Contract Mfg | $55.57 | -0.35 -0.63% | $57.12 | 1,543,336 50 DAV is 2,303,000 | $61.06 -8.99% | 5/15/2024 | $51.52 | PP = $51.22 |
| MB = $53.78 | ||||||||
| Most Recent Note - 5/31/2024 1:00:16 PM G - Pulling back today with ever-increasing volume behind its 3rd consecutive loss, retreating from its all-time high. Noted recently - "Extended from the previously noted base. Prior highs in the $51 area define initial support to watch above its 50 DMA line ($47.83)." >>> FEATURED STOCK ARTICLE : Strong Breakout After 6-Week Flat Base - 5/15/2024 | View all notes | Set NEW NOTE alert | Company Profile | SEC News | Chart | Request a new note | ||||||||
Archrock OilandGas-Machinery/Equip | $19.47 | -0.77 -3.80% | $20.60 | 1,288,270 50 DAV is 1,501,000 | $21.61 -9.90% | 5/20/2024 | $21.23 | PP = $21.50 |
| MB = $22.58 | ||||||||
G - Color code is changed to green after today''s loss violated its 50 DMA line ($20) and undercut recent lows in the $19 area raising concerns. A rebound above the 50 DMA line is again needed to help its outlook improve. See the latest FSU analysis for more details and a new annotated graph. >>> FEATURED STOCK ARTICLE : Slump Below 50-Day Moving Average Again Hurts Outlook - 6/3/2024 | View all notes | Set NEW NOTE alert | Company Profile | SEC News | Chart | Request a new note | ||||||||
Deckers Outdoor Apparel-Shoes and Rel Mfg | $1,086.57 | -7.35 -0.67% | $1,106.89 | 264,515 50 DAV is 377,000 | $1,095.48 -0.81% | 5/24/2024 | $1,010.60 | PP = $956.27 |
| MB = $1,004.08 | ||||||||
| Most Recent Note - 5/30/2024 6:12:18 PM G - Hit another new all-time high with today''s gain. Rallied well above its "max buy" level, quickly getting extended from prior highs in the $956 area that define initial support to watch on pullbacks. >>> FEATURED STOCK ARTICLE : Big "Breakaway Gap" for Deckers Outdoor - 5/24/2024 | View all notes | Set NEW NOTE alert | Company Profile | SEC News | Chart | Request a new note | ||||||||
| Symbol/Exchange Company Name Industry Group | PRICE | CHANGE | Day High | Volume (% DAV) (% 50 day avg vol) | 52 Wk Hi | Featured Date | Price Featured | Pivot Featured |
| Max Buy | ||||||||
e.l.f. Beauty Cosmetics/Personal Care | $196.45 | +9.54 5.10% | $202.58 | 1,837,679 50 DAV is 1,687,000 | $221.83 -11.44% | 5/24/2024 | $193.79 | PP = $182.73 |
| MB = $191.87 | ||||||||
G - Gapped up for a solid gain today with near average volume and its color code is changed to green after rising above it "max buy" level. Rallying after breaking out a "double-bottom" base. >>> FEATURED STOCK ARTICLE : Down on Lighter Volume After Breakout From "Double Bottom" Base - 5/29/2024 | View all notes | Set NEW NOTE alert | Company Profile | SEC News | Chart | Request a new note | ||||||||
PDD Holdings ADR Retail-Internet | $146.92 | -2.86 -1.91% | $149.88 | 8,573,675 50 DAV is 9,730,000 | $164.69 -10.79% | 5/24/2024 | $161.85 | PP = $153.09 |
| MB = $160.74 | ||||||||
Y - Slumping below prior highs with losses on below average volume raising concerns after it rallied to new 52-week highs with 3 consecutive volume-driven gains clearing a 20-week base. Disciplined investors avoid big losses by selling any stock that falls more than 7-8% below their purchase price. >>> FEATURED STOCK ARTICLE : Pulled Back Below Prior Highs Raising Concerns - 5/28/2024 | View all notes | Set NEW NOTE alert | Company Profile | SEC News | Chart | Request a new note | ||||||||
CrowdStrike Holdings Computer Sftwr-Security | $308.69 | -4.98 -1.59% | $319.48 | 4,357,032 50 DAV is 2,498,000 | $365.00 -15.43% | 5/28/2024 | $351.47 | PP = $365.10 |
| MB = $383.36 | ||||||||
G - Suffered a 3rd consecutive loss today after violating its 50 DMA line ($317) triggering a technical sell signal. Due to report Apr '24 quarterly results on 6/04/24. >>> FEATURED STOCK ARTICLE : Volume-Driven Loss Triggered Technical Sell Signal - 5/30/2024 | View all notes | Set NEW NOTE alert | Company Profile | SEC News | Chart | Request a new note | ||||||||
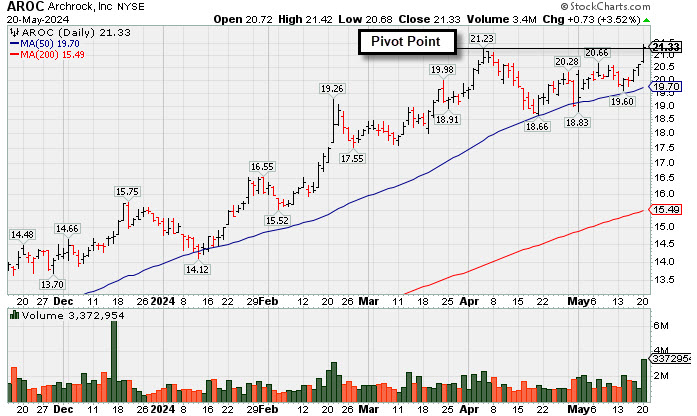
Strong Finish for Archrock After Highlighted in Mid-Day Report - Monday, May 20, 2024
Archrock (AROC +$0.72 or +3.50% to $21.32) finished strong after highlighted in yellow with pivot point cited based on its 4/04/24 high plus 10 cents in the earlier mid-day report (read here). It touched a new high and posted a big gain backed by +144% above average volume. AROC found support above its 50-day moving average (DMA) line during an orderly 6-week flat base. Subsequent gains and a strong close above the pivot point backed by at least +40% above average volume may trigger a technical buy signal.
It has a highest possible Earnings Per Share Rating of 99. Earnings increases have been above the +25% mninimum guideline in quarterly comparisons through Mar '24 versus the year-ago periods. Annual earnings (A criteria) growth has been strong after a loss in FY '20. It hails from the OilandGas-Machinery/Equip group which is currently ranked 48th on the 197 Industryu Groups List (L criteria).
There are 156.3 million shares (S criteria) outstanding. The number of top-rated funds owning its shares rose frm 380 in Jun '23 to 434 in Mar '24, a reassuring sign concerning the I criteria. Its current Up/Down Volume Ratio of 1.7 is an unbiased indication its shares have been under accumulation over the past 50 days.
Chart courtesy of www.stockcharts.com