***Last / Change / Volume data in this table is the closing quote data***
Symbol/Exchange
Company Name
Industry Group |
PRICE |
CHANGE
(%Change) |
Day High |
Volume
(% DAV)
(% 50 day avg vol) |
52 Wk Hi
% From Hi |
Featured
Date |
Price
Featured |
Pivot Featured |
|
Max Buy |
ARMH
-
NASDAQ
A R M Holdings Plc Ads
ELECTRONICS - Semiconductor - Specialized
|
$54.73
|
+0.29
0.53% |
$55.12
|
850,294
49.28% of 50 DAV
50 DAV is 1,725,500
|
$55.26
-0.96%
|
12/23/2013
|
$54.59
|
PP = $52.48
|
|
MB = $55.10
|
Most Recent Note - 12/30/2013 5:35:43 PM
Y - Prior highs near $52 define initial support to watch on pullbacks. Stubbornly holding its ground with volume totals cooling after technically breaking out as noted earlier.
>>> FEATURED STOCK ARTICLE : No Overhead Supply Remains Following Volume-Driven Breakout - 12/23/2013
View all notes |
Set NEW NOTE alert |
CANSLIM.net Company Profile |
SEC
News |
Chart |
Request a new note
C
A N
S L
I M


|
CELG
-
NASDAQ
Celgene Corp
DRUGS - Drug Manufacturers - Major
|
$168.97
|
-0.01
-0.01% |
$170.09
|
1,488,620
54.85% of 50 DAV
50 DAV is 2,713,800
|
$173.80
-2.78%
|
9/12/2013
|
$149.50
|
PP = $150.02
|
|
MB = $157.52
|
 Most Recent Note - 12/31/2013 5:23:06 PM
G - Perched within close striking distance of its 52-week high. Found prompt support near its 50 DMA line recently. Subsequent violations would raise greater concerns and trigger technical sell signals.
>>> FEATURED STOCK ARTICLE : Cooling Volume Totals While Hovering Near Highs - 12/4/2013
View all notes |
Set NEW NOTE alert |
CANSLIM.net Company Profile |
SEC
News |
Chart |
Request a new note
C
A N
S L
I M
|
EGOV
-
NASDAQ
N I C Inc
INTERNET - Internet Software and Services
|
$24.87
|
+0.24
0.97% |
$25.15
|
287,216
97.79% of 50 DAV
50 DAV is 293,700
|
$25.99
-4.31%
|
12/20/2013
|
$24.00
|
PP = $26.09
|
|
MB = $27.39
|
Most Recent Note - 12/31/2013 5:23:55 PM
Y - Posted a 4th consecutive gain today. Subsequent gains above the pivot with sufficient volume may trigger a new (or add-on) technical buy signal. Recent low ($22.17 on 12/16/13) defines near-term support above its 200 DMA line.
>>> FEATURED STOCK ARTICLE : Rebounded Above 50-Day Average; Relative Strength Rating Waned - 12/27/2013
View all notes |
Set NEW NOTE alert |
CANSLIM.net Company Profile |
SEC
News |
Chart |
Request a new note
C
A N
S L
I M
|
EQM
-
NYSE
E Q T Midstream Partners
ENERGY - Oil and Gas Pipelines
|
$58.79
|
+0.28
0.48% |
$59.39
|
142,679
106.08% of 50 DAV
50 DAV is 134,500
|
$59.10
-0.52%
|
12/12/2013
|
$53.17
|
PP = $56.51
|
|
MB = $59.34
|
Most Recent Note - 12/30/2013 5:37:04 PM
Y - Inched higher today with below average volume for a best-ever close. A gain above the pivot point backed by at least +40% above average volume is needed to trigger a proper technical buy signal.
>>> FEATURED STOCK ARTICLE : Finding Support Near 50-Day Moving Average While Perched Near Highs - 12/13/2013
View all notes |
Set NEW NOTE alert |
CANSLIM.net Company Profile |
SEC
News |
Chart |
Request a new note
C
A N
S L
I M
|
FB
-
NASDAQ
Facebook Inc Cl A
INTERNET
|
$54.65
|
+0.94
1.75% |
$54.86
|
43,041,321
57.20% of 50 DAV
50 DAV is 75,242,100
|
$58.58
-6.71%
|
12/12/2013
|
$51.40
|
PP = $54.93
|
|
MB = $57.68
|
Most Recent Note - 12/30/2013 5:39:53 PM
Y - Pulled back today and closed below its old high close ($54.22 on 10/18/13) raising concerns while slumping back into the prior base. Rallied from a 9-week cup shaped base without a handle after completing a Public Offering on 12/20/13. Disciplined investors always limit losses by selling any stock that falls more than -7% from their purchase price.
>>> FEATURED STOCK ARTICLE : Well Known Social Media Firm on Watch List While Still Base Building - 12/12/2013
View all notes |
Set NEW NOTE alert |
CANSLIM.net Company Profile |
SEC
News |
Chart |
Request a new note
C
A N
S L
I M
|
Symbol/Exchange
Company Name
Industry Group |
PRICE |
CHANGE
(%Change) |
Day High |
Volume
(% DAV)
(% 50 day avg vol) |
52 Wk Hi
% From Hi |
Featured
Date |
Price
Featured |
Pivot Featured |
|
Max Buy |
FLT
-
NYSE
Fleetcor Technologies
DIVERSIFIED SERVICES - Business/Management Services
|
$117.17
|
+2.90
2.54% |
$117.26
|
461,326
58.20% of 50 DAV
50 DAV is 792,700
|
$123.96
-5.48%
|
8/19/2013
|
$99.01
|
PP = $100.97
|
|
MB = $106.02
|
Most Recent Note - 12/31/2013 5:21:44 PM
G - Closed above its 50 DMA line with today's gain on light volume. It may be forming a new late-stage base but still faces some resistance up through the $123 level.
>>> FEATURED STOCK ARTICLE : Enduring Distributional Pressure While Extended From Sound Base - 12/17/2013
View all notes |
Set NEW NOTE alert |
CANSLIM.net Company Profile |
SEC
News |
Chart |
Request a new note
C
A N
S L
I M
|
GNRC
-
NYSE
Generac Hldgs Inc
CONSUMER DURABLES - Electronic Equipment
|
$56.64
|
+0.68
1.22% |
$56.79
|
347,578
45.45% of 50 DAV
50 DAV is 764,800
|
$57.05
-0.72%
|
11/26/2013
|
$53.02
|
PP = $52.42
|
|
MB = $55.04
|
Most Recent Note - 12/30/2013 4:23:41 PM
G - Holding its ground stubbornly near its all-time high with volume totals cooling, action indicating that few investors have been headed for the exit. Prior highs in the $52 area define initial support to watch on pullbacks.
>>> FEATURED STOCK ARTICLE : Following Latest Breakout Prior Highs Define Support - 11/29/2013
View all notes |
Set NEW NOTE alert |
CANSLIM.net Company Profile |
SEC
News |
Chart |
Request a new note
C
A N
S L
I M
|
HLF
-
NYSE
Herbalife Ltd
DRUGS - Nutrition and Weight Management
|
$78.70
|
+0.78
1.00% |
$78.94
|
1,003,784
37.71% of 50 DAV
50 DAV is 2,661,700
|
$81.75
-3.73%
|
11/22/2013
|
$72.21
|
PP = $75.04
|
|
MB = $78.79
|
Most Recent Note - 12/30/2013 5:30:33 PM
Y - Perched -4.7% off its 52-week high today. Color code was changed to yellow after quietly dipping below its "max buy" level. See the latest FSU analysis for more details and new annotated daily and weekly graphs.
>>> FEATURED STOCK ARTICLE : Volume Totals Cooling While Perched Near Highs - 12/30/2013
View all notes |
Set NEW NOTE alert |
CANSLIM.net Company Profile |
SEC
News |
Chart |
Request a new note
C
A N
S L
I M
|
JAZZ
-
NASDAQ
Jazz Pharmaceuticals Plc
DRUGS - Biotechnology
|
$126.56
|
-0.23
-0.18% |
$127.74
|
561,619
77.00% of 50 DAV
50 DAV is 729,400
|
$128.49
-1.50%
|
9/30/2013
|
$93.20
|
PP = $89.10
|
|
MB = $93.56
|
Most Recent Note - 12/26/2013 6:32:38 PM
G - Hovering at its 52-week high after heavy volume behind considerable gains on 12/20/13 news it will buy Gentium Spa (GENT) for $1 Billion.
>>> FEATURED STOCK ARTICLE : Technically Extended Stock May Be a Dangerous Chase - 12/10/2013
View all notes |
Set NEW NOTE alert |
CANSLIM.net Company Profile |
SEC
News |
Chart |
Request a new note
C
A N
S L
I M
|
KORS
-
NYSE
Michael Kors Hldgs Ltd
RETAIL - Apparel Stores
|
$81.19
|
+0.60
0.74% |
$81.53
|
1,558,516
33.02% of 50 DAV
50 DAV is 4,719,600
|
$84.58
-4.01%
|
8/6/2013
|
$69.66
|
PP = $66.28
|
|
MB = $69.59
|
Most Recent Note - 12/30/2013 5:41:19 PM
G - Still testing support at its 50 DMA line after recent distributional pressure. Did not form a new base of sufficient length.
>>> FEATURED STOCK ARTICLE : Consolidation Too Brief To Note New Pivot - 12/6/2013
View all notes |
Set NEW NOTE alert |
CANSLIM.net Company Profile |
SEC
News |
Chart |
Request a new note
C
A N
S L
I M
|
Symbol/Exchange
Company Name
Industry Group |
PRICE |
CHANGE
(%Change) |
Day High |
Volume
(% DAV)
(% 50 day avg vol) |
52 Wk Hi
% From Hi |
Featured
Date |
Price
Featured |
Pivot Featured |
|
Max Buy |
MRLN
-
NASDAQ
Marlin Business Services
DIVERSIFIED SERVICES - Rental and Leasing Services
|
$25.20
|
-0.03
-0.12% |
$25.30
|
27,233
105.15% of 50 DAV
50 DAV is 25,900
|
$28.64
-12.01%
|
12/19/2013
|
$26.69
|
PP = $28.74
|
|
MB = $30.18
|
Most Recent Note - 12/26/2013 6:29:14 PM
Y - Rebounded above its 50 DMA line today with light volume behind its gain and its color code is changed to yellow. Subsequent volume-driven gains above the pivot point are needed to trigger a proper new technical buy signal.
>>> FEATURED STOCK ARTICLE : Finished Weak While Enduring Distributional Pressure - 12/19/2013
View all notes |
Set NEW NOTE alert |
CANSLIM.net Company Profile |
SEC
News |
Chart |
Request a new note
C
A N
S L
I M
|
PCLN
-
NASDAQ
Priceline.Com Inc
INTERNET - Internet Software and Services
|
$1,162.40
|
+9.51
0.82% |
$1,162.40
|
443,877
74.50% of 50 DAV
50 DAV is 595,800
|
$1,198.75
-3.03%
|
12/18/2013
|
$1,156.20
|
PP = $1,198.85
|
|
MB = $1,258.79
|
Most Recent Note - 12/30/2013 12:39:49 PM
Y - Enduring mild distributional pressure recently at its highs after forming an advanced "3-week tight" base, albeit a riskier "late-stage" set-up. The new pivot point was based on its 11/29/13 high plus 10 cents. Subsequent volume-driven gains above the pivot point may trigger a new (or add-on) technical buy signal. Its 50 DMA line ($1,132.93 now) defines important support to watch on pullbacks.
>>> FEATURED STOCK ARTICLE : Extended From Any Sound Base Pattern - 12/3/2013
View all notes |
Set NEW NOTE alert |
CANSLIM.net Company Profile |
SEC
News |
Chart |
Request a new note
C
A N
S L
I M
|
SFUN
-
NYSE
Soufun Hldgs Ltd Ads A
INTERNET - Internet Information Providers
|
$82.41
|
+1.23
1.52% |
$82.73
|
640,008
50.69% of 50 DAV
50 DAV is 1,262,600
|
$84.44
-2.40%
|
10/17/2013
|
$58.02
|
PP = $53.87
|
|
MB = $56.56
|
Most Recent Note - 12/31/2013 5:25:22 PM
G - Perched at all-time highs, still holding its ground stubbornly. Wedged higher since noted in prior reports with caution - "It is extended from any sound base pattern yet may produce more climactic gains. Prior highs and its 50 DMA line coincide in the $59 area defining important support to watch."
>>> FEATURED STOCK ARTICLE : Extended From Base Yet May Produce More Climactic Gains - 12/9/2013
View all notes |
Set NEW NOTE alert |
CANSLIM.net Company Profile |
SEC
News |
Chart |
Request a new note
C
A N
S L
I M
|
SILC
-
NASDAQ
Silicom Ltd
COMPUTER HARDWARE - Networking andamp; Communication Dev
|
$45.72
|
+0.21
0.46% |
$45.82
|
38,275
89.01% of 50 DAV
50 DAV is 43,000
|
$46.15
-0.93%
|
12/23/2013
|
$44.62
|
PP = $46.25
|
|
MB = $48.56
|
Most Recent Note - 12/27/2013 6:47:54 PM
Y - Inched higher today on light volume for a best-ever close. Approaching its pivot point cited based on its 11/12/13 high plus 10 cents noted in the 12/23/13 mid-day report (read here). This Israeli manufacturer of Computer - Networking devices rallied toward its 52-week high with today's 7th consecutive gain. Little resistance remains due to overhead supply. Subsequent volume-driven gains above the pivot point may trigger a technical buy signal. Its small supply (S criteria) of only 3.93 million shares in the public float can contribute to greater price volatility.
>>> FEATURED STOCK ARTICLE : Stock With Small Supply Has Formed a Sound Base Pattern - 12/24/2013
View all notes |
Set NEW NOTE alert |
CANSLIM.net Company Profile |
SEC
News |
Chart |
Request a new note
C
A N
S L
I M
|
SSNC
-
NASDAQ
S S & C Technologies
COMPUTER SOFTWARE and SERVICES - Application Software
|
$44.26
|
+0.56
1.28% |
$44.26
|
250,596
87.07% of 50 DAV
50 DAV is 287,800
|
$43.80
1.05%
|
10/22/2013
|
$39.17
|
PP = $40.04
|
|
MB = $42.04
|
Most Recent Note - 12/30/2013 5:43:29 PM
G - Finished at a best-ever close after today's 6th consecutive gain with light volume. Found recent support near its 50 DMA line but did not form a sound new base. Recent low ($38.85 on 12/13/13) defines important near-term support to watch below its 50 DMA line.
>>> FEATURED STOCK ARTICLE : Found Prompt Support After Damaging Losses Raised Concerns - 12/16/2013
View all notes |
Set NEW NOTE alert |
CANSLIM.net Company Profile |
SEC
News |
Chart |
Request a new note
C
A N
S L
I M
|
Symbol/Exchange
Company Name
Industry Group |
PRICE |
CHANGE
(%Change) |
Day High |
Volume
(% DAV)
(% 50 day avg vol) |
52 Wk Hi
% From Hi |
Featured
Date |
Price
Featured |
Pivot Featured |
|
Max Buy |
SSYS
-
NASDAQ
Stratasys Ltd
COMPUTER HARDWARE - Computer Peripherals
|
$134.70
|
+4.17
3.19% |
$134.87
|
856,318
76.88% of 50 DAV
50 DAV is 1,113,900
|
$134.00
0.52%
|
10/11/2013
|
$102.94
|
PP = $105.38
|
|
MB = $110.65
|
Most Recent Note - 12/26/2013 6:27:29 PM
G - Perched near its 52-week high after rallying from support at its 50 DMA line. Previously noted with caution - "Reported earnings +13% on +153% sales revenues, below the +25% minimum earnings guideline (C criteria) raising fundamental concerns."
>>> FEATURED STOCK ARTICLE : Rallying From Support at 50-Day Moving Average Line - 12/20/2013
View all notes |
Set NEW NOTE alert |
CANSLIM.net Company Profile |
SEC
News |
Chart |
Request a new note
C
A N
S L
I M
|
ULTI
-
NASDAQ
Ultimate Software Group
INTERNET - Internet Software and Services
|
$153.22
|
+1.11
0.73% |
$153.36
|
108,854
75.80% of 50 DAV
50 DAV is 143,600
|
$162.88
-5.93%
|
10/16/2013
|
$142.95
|
PP = $151.18
|
|
MB = $158.74
|
Most Recent Note - 12/26/2013 6:24:35 PM
G - Inched above its 50 DMA line today with light volume behind its gain. See the latest FSU analysis for more details and new annotated daily and weekly graphs.
>>> FEATURED STOCK ARTICLE : Gain on Light Volume While Inching Above 50-Day Average - 12/26/2013
View all notes |
Set NEW NOTE alert |
CANSLIM.net Company Profile |
SEC
News |
Chart |
Request a new note
C
A N
S L
I M
|
VRX
-
NYSE
Valeant Pharmaceuticals
DRUGS - Drug Manufacturers - Other
|
$117.40
|
-0.02
-0.02% |
$118.25
|
695,448
64.76% of 50 DAV
50 DAV is 1,073,900
|
$117.78
-0.32%
|
9/11/2013
|
$100.26
|
PP = $105.50
|
|
MB = $110.78
|
Most Recent Note - 12/30/2013 5:45:51 PM
G - Rallied for a new 52-week high with +18% above average volume behind today's 6th consecutive gain. Resilient after earnings +24% on +74% sales revenues for the Sep '13 quarter came in a notch below the +25% minimum guideline (C criteria).
>>> FEATURED STOCK ARTICLE : Rebounding With Volume Backed Gains But Fundamental Concerns Remain - 12/18/2013
View all notes |
Set NEW NOTE alert |
CANSLIM.net Company Profile |
SEC
News |
Chart |
Request a new note
C
A N
S L
I M
|
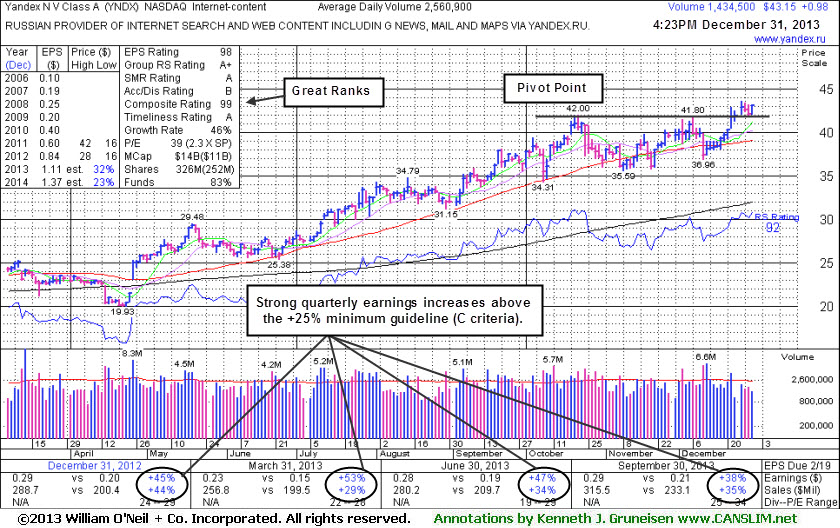
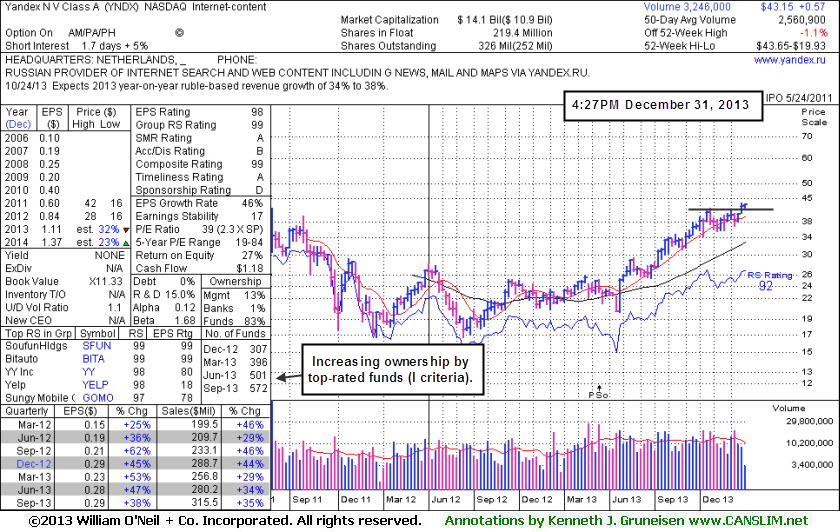
YNDX
-
NASDAQ
Yandex N V Class A
INTERNET - Internet Information Providers
|
$43.15
|
+0.98
2.32% |
$43.17
|
1,435,568
56.06% of 50 DAV
50 DAV is 2,560,900
|
$43.65
-1.15%
|
11/27/2013
|
$39.61
|
PP = $42.10
|
|
MB = $44.21
|
Most Recent Note - 12/31/2013 5:18:33 PM
Y - Rallied for a best ever close with light volume behind today's gain. At least +40% above average volume should be behind gains above the pivot point to trigger a proper new technical buy signal. See the latest FSU analysis for more details and a new annotated graph.
>>> FEATURED STOCK ARTICLE : Best Ever Close With Gain on Light Volume - 12/31/2013
View all notes |
Set NEW NOTE alert |
CANSLIM.net Company Profile |
SEC
News |
Chart |
Request a new note
C
A N
S L
I M
|