You are not logged in.
This means you
CAN ONLY VIEW reports that were published prior to Monday, April 14, 2025.
You
MUST UPGRADE YOUR MEMBERSHIP if you want to see any current reports.
AFTER MARKET UPDATE - MONDAY, DECEMBER 31ST, 2012
Previous After Market Report Next After Market Report >>>
|
|
|
|
DOW |
+166.03 |
13,104.14 |
+1.28% |
|
Volume |
731,690,450 |
+37% |
|
Volume |
1,494,856,650 |
+34% |
|
NASDAQ |
+59.20 |
3,019.51 |
+2.00% |
|
Advancers |
2,652 |
84% |
|
Advancers |
2,051 |
78% |
|
S&P 500 |
+23.76 |
1,426.19 |
+1.69% |
|
Decliners |
430 |
14% |
|
Decliners |
491 |
19% |
|
Russell 2000 |
+17.25 |
849.35 |
+2.07% |
|
52 Wk Highs |
102 |
|
|
52 Wk Highs |
61 |
|
|
S&P 600 |
+9.15 |
476.57 |
+1.96% |
|
52 Wk Lows |
24 |
|
|
52 Wk Lows |
35 |
|
|
We hope that all of our valued members are having a wonderful holiday season. Our team kindly wishes every one of you a happy, healthy, safe, and prosperous 2013. Thank you very much for being a loyal CANSLIM.net member!
|
 |
Major Averages Promptly Repaired Worrisome Technical Violations
Kenneth J. Gruneisen - Passed the CAN SLIM® Master's Exam
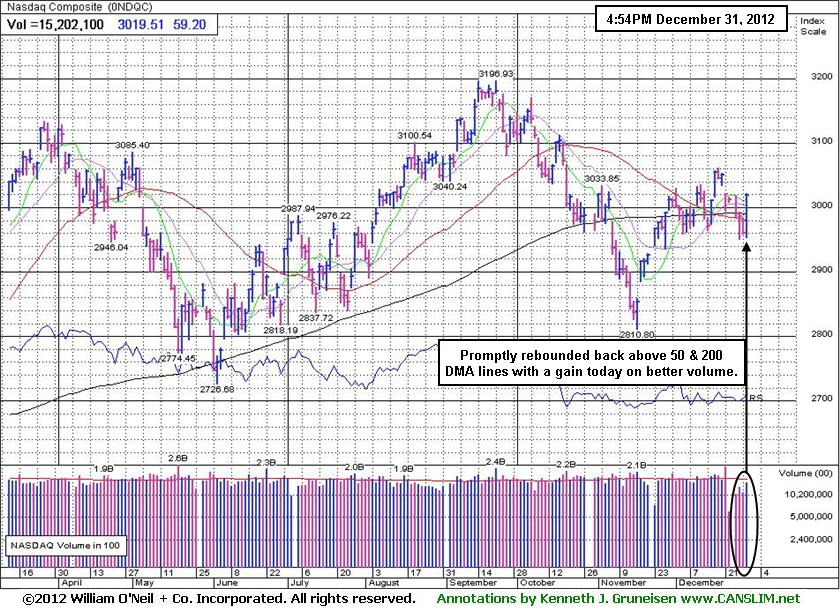
The Dow Jones Industrial Average, S&P 500 Index, and the Nasdaq Composite Index finished firmly in positive territory on Monday, and technically they rebounded above their respective 50-day and 200-day moving average lines. The volume totals were reported higher on both the NYSE and the Nasdaq exchange, which indicated that institutional buying was providing prompt support for the market's rebound near those important technical levels. Breadth was solidly positive as advancers led decliners by more than a 5-1 margin on the NYSE and by more than a 4-1 margin on the Nasdaq exchange. The total number of stocks hitting new 52-week highs outnumbered new 52-week lows on the NYSE and on the Nasdaq exchange. There were 37 high-ranked companies from the CANSLIM.net Leaders List making new 52-week highs and appearing on the CANSLIM.net BreakOuts Page, up abruptly from the prior session total of 10 stocks. Any sustainable rally requires a healthy crop of companies hitting new 52-week highs, so it is essential to see meaningful leadership continue. There were gains for 12 of the 13 high-ranked companies currently included on the Featured Stocks Page.
Monday's session brought solid gains for the major averages that helped them promptly rebound back above most of the very important technical hurdles which had been violated last week. That is a reassuring sign that institutional investors have an appetite for buying stocks and they were stepping in and showing support. Regular readers of this commentary may note that we observed last week's poor finish as, "action arguably putting the market (M criteria) back in a correction", however, the newspaper still made an argument that the under pressure rally had not officially ended even after Friday's technical deterioration, making the case for -"a wobbly uptrend as timid volume allowed the bulls to absorb the day's losses."
Stocks rallied on the final trading day of 2012. The major averages snapped a five-day decline amid optimism over fiscal cliff negotiations in Washington. The market advanced after President Obama and Senate minority leader Mitch McConnell both said lawmakers are close on a deal to avoid tax increases for middle income earners.
For the month of December, the Dow was up +0.6%, the S&P 500 gained +0.7% and the Nasdaq Composite Index rose +0.3%. For 2012, the Dow finished up +7.3%, the S&P 500 advanced +13.4% and the Nasdaq Composite Index gained +15.9%.
All 10 sectors in the S&P 500 ended Monday's session in positive territory led by tech and materials. Apple Inc (AAPL +4.43%) was up to end the year with a +31.9% gain. Cliff Natural Resources Inc (CLF +8.40%) jumped after a better-than expected Chinese manufacturing report last night. Energy stocks outperformed with Dow component Exxon Mobil Corp (XOM +1.70%) gaining as the price of oil advanced.
In fixed income, the 10-year note fell half a point to end the year with a yield of 1.76%.
Technically, the market (M criteria) may have narrowly avoided the lable of a full blown "correction" while the choppy uptrend came under recent pressure, as with Monday's solid gains the benchmark S&P 500 Index promptly rebounded above its 50-day moving average (DMA) line, and Nasdaq Composite Index and Dow Jones Industrial Average both promptly rebounded above their respective 50 DMA and 200 DMA lines. More damaging losses below the latest lows would end the current rally without question. Meanwhile, investors may consider new buying efforts only in stocks meeting all key criteria, and each individual holding should be closely monitored for any signs of technical deterioration.
Watch for an announcement via email concerning the next WEBCAST. The webcast will also be available via an updated link highlighted at the top of the Premium Member Homepage.
PICTURED: The Nasdaq Composite Index promptly rebounded above its 50-day moving average (DMA) line and above its 200 DMA line with a gain on higher volume. It finished -5.5% off its 2012 high.
|
 Kenneth J. Gruneisen started out as a licensed stockbroker in August 1987, a couple of months prior to the historic stock market crash that took the Dow Jones Industrial Average down -22.6% in a single day. He has published daily fact-based fundamental and technical analysis on high-ranked stocks online for two decades. Through FACTBASEDINVESTING.COM, Kenneth provides educational articles, news, market commentary, and other information regarding proven investment systems that work in good times and bad.
Comments contained in the body of this report are technical opinions only and are not necessarily those of Gruneisen Growth Corp. The material herein has been obtained from sources believed to be reliable and accurate, however, its accuracy and completeness cannot be guaranteed. Our firm, employees, and customers may effect transactions, including transactions contrary to any recommendation herein, or have positions in the securities mentioned herein or options with respect thereto. Any recommendation contained in this report may not be suitable for all investors and it is not to be deemed an offer or solicitation on our part with respect to the purchase or sale of any securities. |
|
 |
Widespread Gains Boosted All Industry Groups
Kenneth J. Gruneisen - Passed the CAN SLIM® Master's Exam
The Retail Index ($RLX +2.12%) was a positive influence on the major averages on Monday along with financial shares as the Bank Index ($BKX +1.36%) and the Broker/Dealer Index ($XBD +1.40%) tallied solid gains. The tech sector saw unanimous gains from the Networking Index ($NWX +1.60%), Internet Index ($IIX +1.85%), Semiconductor Index ($SOX +1.91%), and the Biotechnology Index ($BTK +1.97%). Energy-related shares rallied and boosted both the Integrated Oil Index ($XOI +2.05%) and the Oil Services Index ($OSX +2.59%). Defensive groups also traded up as the Healthcare Index ($HMO +1.72%) rose and the Gold & Silver Index ($XAU +3.10%) was a standout gainer.
Charts courtesy www.stockcharts.com
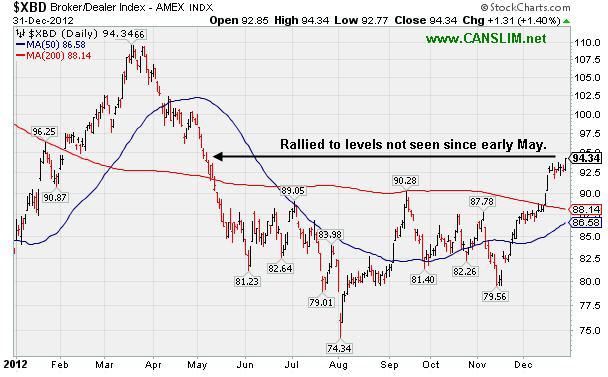
PICTURED: The Broker/Dealer Index ($XBD +1.40%) rallied to levels not seen since early May.
| Oil Services |
$OSX |
220.16 |
+5.56 |
+2.59% |
+1.79% |
| Healthcare |
$HMO |
2,514.18 |
+42.46 |
+1.72% |
+10.19% |
| Integrated Oil |
$XOI |
1,241.84 |
+24.98 |
+2.05% |
+1.04% |
| Semiconductor |
$SOX |
384.06 |
+7.19 |
+1.91% |
+5.38% |
| Networking |
$NWX |
226.55 |
+3.58 |
+1.60% |
+5.30% |
| Internet |
$IIX |
327.00 |
+5.94 |
+1.85% |
+16.07% |
| Broker/Dealer |
$XBD |
94.34 |
+1.31 |
+1.40% |
+13.29% |
| Retail |
$RLX |
653.06 |
+13.54 |
+2.12% |
+24.82% |
| Gold & Silver |
$XAU |
165.60 |
+4.98 |
+3.10% |
-8.33% |
| Bank |
$BKX |
51.28 |
+0.69 |
+1.36% |
+30.22% |
| Biotech |
$BTK |
1,547.03 |
+29.95 |
+1.97% |
+41.74% |
|
|
|
 |
Volume-Driven Gain Still Needed to Trigger Technical Buy Signal
Kenneth J. Gruneisen - Passed the CAN SLIM® Master's Exam
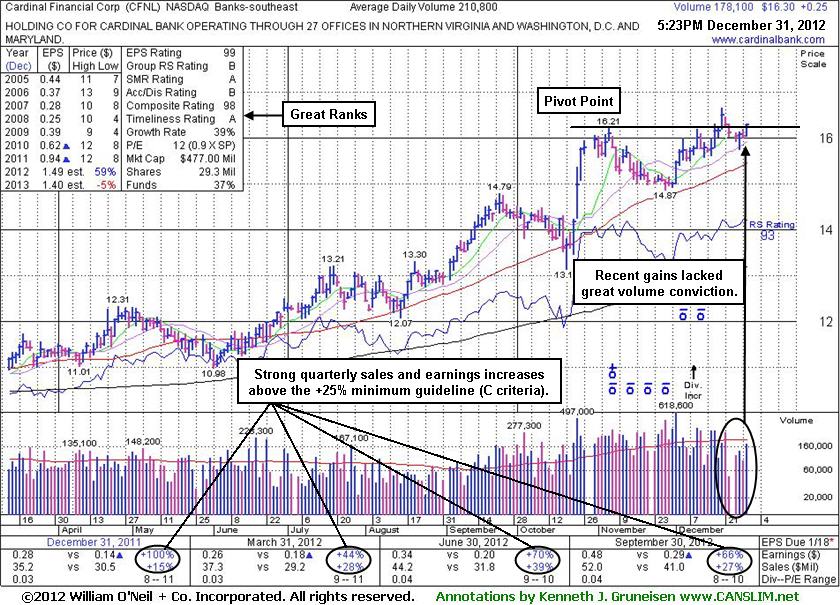
Cardinal Financial Corp's (CFNL +$0.25 or +1.56% to $16.30) still is quietly consolidating -2.2% off its 52-week high and hovering near its pivot point. A gain above the pivot point backed by at least +40% above average volume may trigger a proper new (or add-on) technical buy signal. It was last shown in this FSU section on 12/10/12 with an annotated graph under the headline, "Forming New Orderly Base Above Prior Highs and 50-Day Average".
It stayed above the prior high ($14.79 on 9/24/12) defining important support, however its recent gains lacked the volume conviction required for a proper technical buy signal. CFNL has traded up as much as +29.6% from $12.85 when first featured in the 7/20/12 mid-day report (read here). The high-ranked leader hailing from the Banks - Southeast industry group reported earnings +66% on +27% sales revenues for the quarter ended September 30, 2012 versus the year ago period, continuing its track record of strong quarterly earnings comparisons underpinned by encouraging sales revenues increases. It has earned high ranks and matches favorably with the C and A criteria. The number of top-rated funds owning its shares rose from 172 in Sep '11 to 185 in Sep '12, a reassuring trend concerning the I criteria. Its small supply (S criteria) of only 29.3 millions shares outstanding is a favorable characteristic, yet it can contribute to greater price volatility in the event of institutional accumulation or distributional pressure.
|
|
|
Color Codes Explained :
Y - Better candidates highlighted by our
staff of experts.
G - Previously featured
in past reports as yellow but may no longer be buyable under the
guidelines.
***Last / Change / Volume data in this table is the closing quote data***
Symbol/Exchange
Company Name
Industry Group |
PRICE |
CHANGE
(%Change) |
Day High |
Volume
(% DAV)
(% 50 day avg vol) |
52 Wk Hi
% From Hi |
Featured
Date |
Price
Featured |
Pivot Featured |
|
Max Buy |
CELG
-
NASDAQ
Celgene Corp
DRUGS - Drug Manufacturers - Major
|
$78.47
|
+0.74
0.95% |
$78.82
|
2,437,961
87.39% of 50 DAV
50 DAV is 2,789,800
|
$82.78
-5.21%
|
12/11/2012
|
$82.24
|
PP = $81.34
|
|
MB = $85.41
|
Most Recent Note - 12/28/2012 9:52:46 AM
Y - Down today and on track for its 5th consecutive small loss, consolidating above its 50 DMA which defines important near-term support. Slumped below its pivot point following a technical buy signal on 12/11/12. Disciplined investors always limit losses if any stock falls -7% from their purchase price.
>>> The latest Featured Stock Update with an annotated graph appeared on 12/12/2012. Click here.
View all notes |
Alert me of new notes |
CANSLIM.net Company Profile |
SEC |
Zacks Reports |
StockTalk |
News |
Chart |
Request a new note
C
A N
S L
I M


|
CFNL
-
NASDAQ
Cardinal Financial Corp
BANKING - Regional - Southeast Banks
|
$16.30
|
+0.25
1.56% |
$16.30
|
178,186
84.53% of 50 DAV
50 DAV is 210,800
|
$16.66
-2.16%
|
12/3/2012
|
$15.20
|
PP = $16.31
|
|
MB = $17.13
|
 Most Recent Note - 12/31/2012 5:40:47 PM
Y - Still quietly consolidating near its 52-week high and near its pivot point. A gain above the pivot point backed by at least +40% above average volume may trigger a proper new (or add-on) technical buy signal. See the latest FSU analysis for more details and a new annotated graph.
>>> The latest Featured Stock Update with an annotated graph appeared on 12/31/2012. Click here.
View all notes |
Alert me of new notes |
CANSLIM.net Company Profile |
SEC |
Zacks Reports |
StockTalk |
News |
Chart |
Request a new note
C
A N
S L
I M
|
CMCSA
-
NASDAQ
Comcast Corp Cl A
MEDIA - CATV Systems
|
$37.36
|
+0.82
2.24% |
$37.40
|
13,406,740
112.91% of 50 DAV
50 DAV is 11,873,800
|
$38.22
-2.25%
|
12/3/2012
|
$37.08
|
PP = $38.06
|
|
MB = $39.96
|
Most Recent Note - 12/31/2012 2:09:43 PM
Y - Holding its ground today near its 50 DMA line. It did not yet trigger a technical buy signal while remaining in healthy shape and highlighted in yellow throughout December.
>>> The latest Featured Stock Update with an annotated graph appeared on 12/27/2012. Click here.
View all notes |
Alert me of new notes |
CANSLIM.net Company Profile |
SEC |
Zacks Reports |
StockTalk |
News |
Chart |
Request a new note
C
A N
S L
I M
|
LULU
-
NASDAQ
Lululemon Athletica
MANUFACTURING - Textile Manufacturing
|
$76.23
|
+1.92
2.58% |
$76.51
|
1,530,291
80.08% of 50 DAV
50 DAV is 1,910,900
|
$81.09
-5.99%
|
12/26/2012
|
$73.81
|
PP = $77.95
|
|
MB = $81.85
|
Most Recent Note - 12/31/2012 3:13:56 PM
Y - Rallying toward its pivot point with higher volume than the prior session, yet below average volume today. Subsequent volume-driven gains above its pivot point are still needed to trigger a new technical buy signal.
>>> The latest Featured Stock Update with an annotated graph appeared on 12/28/2012. Click here.
View all notes |
Alert me of new notes |
CANSLIM.net Company Profile |
SEC |
Zacks Reports |
StockTalk |
News |
Chart |
Request a new note
C
A N
S L
I M
|
MIDD
-
NASDAQ
Middleby Corp
MANUFACTURING - Diversified Machinery
|
$128.21
|
+2.74
2.18% |
$129.26
|
60,265
69.27% of 50 DAV
50 DAV is 87,000
|
$134.51
-4.68%
|
10/8/2012
|
$118.46
|
PP = $122.67
|
|
MB = $128.80
|
Most Recent Note - 12/31/2012 2:07:36 PM
G - Holding its ground near its 50 DMA line today with a gain on light volume following distributional pressure after a negative reversal on 12/19/12 at its new 52-week and all-time high. Earnings +23% on +18% sales for the Sep '12 quarter, below the +25% minimum earnings guideline (C criteria), raised concerns.
>>> The latest Featured Stock Update with an annotated graph appeared on 12/26/2012. Click here.
View all notes |
Alert me of new notes |
CANSLIM.net Company Profile |
SEC |
Zacks Reports |
StockTalk |
News |
Chart |
Request a new note
C
A N
S L
I M
|
Symbol/Exchange
Company Name
Industry Group |
PRICE |
CHANGE
(%Change) |
Day High |
Volume
(% DAV)
(% 50 day avg vol) |
52 Wk Hi
% From Hi |
Featured
Date |
Price
Featured |
Pivot Featured |
|
Max Buy |
N
-
NYSE
Netsuite Inc
DIVERSIFIED SERVICES - Business/Management Services
|
$67.30
|
+2.10
3.22% |
$67.42
|
400,163
89.60% of 50 DAV
50 DAV is 446,600
|
$67.82
-0.77%
|
12/12/2012
|
$64.75
|
PP = $67.12
|
|
MB = $70.48
|
Most Recent Note - 12/31/2012 3:16:16 PM
Y - Rising today with a gain on higher but below average volume, breaking a 6 session losing streak marked by light volume. Disciplined investors know that volume must be at least +40% above average behind gains above the pivot point to trigger a proper technical buy signal.
>>> The latest Featured Stock Update with an annotated graph appeared on 12/13/2012. Click here.
View all notes |
Alert me of new notes |
CANSLIM.net Company Profile |
SEC |
Zacks Reports |
StockTalk |
News |
Chart |
Request a new note
C
A N
S L
I M
|
NSR
-
NYSE
Neustar Inc
TELECOMMUNICATIONS - Diversified Communication Serv
|
$41.93
|
+0.39
0.94% |
$41.95
|
448,068
117.54% of 50 DAV
50 DAV is 381,200
|
$43.85
-4.38%
|
12/11/2012
|
$41.85
|
PP = $41.41
|
|
MB = $43.48
|
Most Recent Note - 12/31/2012 2:16:03 PM
Y - On track today for a 4th consecutive loss. It found prompt support after dipping near its 50 DMA line on 12/27/12 before finishing in the upper third of its intra-day range, an encouraging sign. Subsequent deterioration below its old high close ($41.05 on 10/05/12) could negate its recent breakout, a worrisome sign.
>>> The latest Featured Stock Update with an annotated graph appeared on 12/11/2012. Click here.
View all notes |
Alert me of new notes |
CANSLIM.net Company Profile |
SEC |
Zacks Reports |
StockTalk |
News |
Chart |
Request a new note
C
A N
S L
I M
|
RAX
-
NYSE
Rackspace Hosting Inc
INTERNET - Internet Software and; Services
|
$74.27
|
+1.55
2.13% |
$74.78
|
1,104,367
75.89% of 50 DAV
50 DAV is 1,455,300
|
$73.86
0.56%
|
12/18/2012
|
$71.88
|
PP = $70.10
|
|
MB = $73.61
|
Most Recent Note - 12/31/2012 2:17:24 PM
Y - Perched within close striking distance of a best-ever close today. Holding its ground but failing to make meaningful price progress in recent weeks while volume totals have been cooling. Prior highs in the $70 area define initial support to watch following its recent breakout. Disciplined investors always limit losses if ever any stock falls more than -7% from their purchase price.
>>> The latest Featured Stock Update with an annotated graph appeared on 12/18/2012. Click here.
View all notes |
Alert me of new notes |
CANSLIM.net Company Profile |
SEC |
Zacks Reports |
StockTalk |
News |
Chart |
Request a new note
C
A N
S L
I M
|
RNF
-
NYSE
Rentech Nitrogen Ptnr Lp
CHEMICALS - Agricultural Chemicals
|
$37.69
|
+0.01
0.03% |
$38.19
|
248,739
85.77% of 50 DAV
50 DAV is 290,000
|
$41.15
-8.41%
|
11/1/2012
|
$39.11
|
PP = $40.15
|
|
MB = $42.16
|
Most Recent Note - 12/28/2012 11:24:23 AM
Y - Still quietly consolidating near its 50 DMA line. While patient investors may still be watching for a technical buy signal, a violation of its recent low ($36.06 on 12/18/12) would raise more serious concerns and could trigger a technical sell signal.
>>> The latest Featured Stock Update with an annotated graph appeared on 12/19/2012. Click here.
View all notes |
Alert me of new notes |
CANSLIM.net Company Profile |
SEC |
Zacks Reports |
StockTalk |
News |
Chart |
Request a new note
C
A N
S L
I M
|
ULTA
-
NASDAQ
Ulta Salon Cosm & Frag
SPECIALTY RETAIL - Specialty Retail, Other
|
$98.26
|
+1.71
1.77% |
$98.27
|
435,180
54.27% of 50 DAV
50 DAV is 801,900
|
$103.52
-5.08%
|
12/4/2012
|
$100.29
|
PP = $103.62
|
|
MB = $108.80
|
Most Recent Note - 12/28/2012 9:54:22 AM
Y - Still quietly consolidating above its 50 DMA line which recently acted as support. As previously noted, its waning Relative Strength rating, below the 80+ minimum guideline for buy candidates, is a concern.
>>> The latest Featured Stock Update with an annotated graph appeared on 12/21/2012. Click here.
View all notes |
Alert me of new notes |
CANSLIM.net Company Profile |
SEC |
Zacks Reports |
StockTalk |
News |
Chart |
Request a new note
C
A N
S L
I M
|
Symbol/Exchange
Company Name
Industry Group |
PRICE |
CHANGE
(%Change) |
Day High |
Volume
(% DAV)
(% 50 day avg vol) |
52 Wk Hi
% From Hi |
Featured
Date |
Price
Featured |
Pivot Featured |
|
Max Buy |
VRX
-
NYSE
Valeant Pharmaceuticals
DRUGS - Drug Manufacturers - Other
|
$59.77
|
+0.90
1.53% |
$59.99
|
1,940,653
136.76% of 50 DAV
50 DAV is 1,419,000
|
$61.11
-2.19%
|
12/20/2012
|
$60.24
|
PP = $61.21
|
|
MB = $64.27
|
Most Recent Note - 12/31/2012 2:14:16 PM
Y - Managed a positive reversal from earlier lows, and now poised for a gain on higher volume today. It stalled and encountered mild distributional pressure after highlighted in yellow in the 12/20/12 mid-day report, encountering stubborn resistance again in the $60-61 area. Disciplined investors may watch for a volume-driven gain above its pivot point to trigger a technical buy signal before taking action.
>>> The latest Featured Stock Update with an annotated graph appeared on 12/20/2012. Click here.
View all notes |
Alert me of new notes |
CANSLIM.net Company Profile |
SEC |
Zacks Reports |
StockTalk |
News |
Chart |
Request a new note
C
A N
S L
I M
|
VSI
-
NYSE
Vitamin Shoppe Inc
SPECIALTY RETAIL - Specialty Retail, Other
|
$57.36
|
+1.38
2.47% |
$57.56
|
344,518
139.71% of 50 DAV
50 DAV is 246,600
|
$61.89
-7.32%
|
12/3/2012
|
$59.06
|
PP = $61.99
|
|
MB = $65.09
|
Most Recent Note - 12/31/2012 2:11:42 PM
G - Rebounded into positive territory today after initially slumping near prior lows and testing its 200 DMA line defining important support to watch in the $53 area. It faces resistance due to overhead supply up through the $61 level which has been a stubborn resistance level in recent months.
>>> The latest Featured Stock Update with an annotated graph appeared on 12/24/2012. Click here.
View all notes |
Alert me of new notes |
CANSLIM.net Company Profile |
SEC |
Zacks Reports |
StockTalk |
News |
Chart |
Request a new note
C
A N
S L
I M
|
WPI
-
NYSE
Watson Pharmaceuticals
DRUGS - Drugs - Generic
|
$86.00
|
-3.04
-3.41% |
$88.95
|
2,479,100
323.68% of 50 DAV
50 DAV is 765,900
|
$91.47
-5.98%
|
12/17/2012
|
$87.99
|
PP = $90.49
|
|
MB = $95.01
|
Most Recent Note - 12/31/2012 12:44:25 PM
G - Violated its 50 DMA line with today's volume-driven loss triggering a technical sell signal, and its color code is changed to green. It stalled after the gain with +122% above average volume for a new 52-week high on 12/21/12 clinched a technical buy signal.
>>> The latest Featured Stock Update with an annotated graph appeared on 12/17/2012. Click here.
View all notes |
Alert me of new notes |
CANSLIM.net Company Profile |
SEC |
Zacks Reports |
StockTalk |
News |
Chart |
Request a new note
C
A N
S L
I M
|
|
|
|
THESE ARE NOT BUY RECOMMENDATIONS!
Comments contained in the body of this report are technical
opinions only. The material herein has been obtained
from sources believed to be reliable and accurate, however,
its accuracy and completeness cannot be guaranteed.
This site is not an investment advisor, hence it does
not endorse or recommend any securities or other investments.
Any recommendation contained in this report may not
be suitable for all investors and it is not to be deemed
an offer or solicitation on our part with respect to
the purchase or sale of any securities. All trademarks,
service marks and trade names appearing in this report
are the property of their respective owners, and are
likewise used for identification purposes only.
This report is a service available
only to active Paid Premium Members.
You may opt-out of receiving report notifications
at any time. Questions or comments may be submitted
by writing to Premium Membership Services 665 S.E. 10 Street, Suite 201 Deerfield Beach, FL 33441-5634 or by calling 1-800-965-8307
or 954-785-1121.
|
|
|

