You are not logged in.
This means you
CAN ONLY VIEW reports that were published prior to Monday, April 14, 2025.
You
MUST UPGRADE YOUR MEMBERSHIP if you want to see any current reports.
AFTER MARKET UPDATE - FRIDAY, DECEMBER 28TH, 2012
Previous After Market Report Next After Market Report >>>
|
|
|
|
DOW |
-158.20 |
12,938.11 |
-1.21% |
|
Volume |
535,485,810 |
-6% |
|
Volume |
1,112,804,920 |
-15% |
|
NASDAQ |
-25.60 |
2,960.31 |
-0.86% |
|
Advancers |
957 |
30% |
|
Advancers |
839 |
32% |
|
S&P 500 |
-15.67 |
1,402.43 |
-1.10% |
|
Decliners |
2,089 |
66% |
|
Decliners |
1,650 |
64% |
|
Russell 2000 |
-5.30 |
832.10 |
-0.63% |
|
52 Wk Highs |
39 |
|
|
52 Wk Highs |
24 |
|
|
S&P 600 |
-2.94 |
467.41 |
-0.63% |
|
52 Wk Lows |
24 |
|
|
52 Wk Lows |
27 |
|
|
 |
Major Averages Violated Important Moving Averages
Kenneth J. Gruneisen - Passed the CAN SLIM® Master's Exam
On the week, the Dow Jones Industrial Average and the S&P 500 Index both shed -1.9%, and the Nasdaq Composite Index fell -2.0%. The major averages finished firmly in negative territory on Friday, weak action arguably putting the market (M criteria) back in a correction. The volume totals were reported lighter on both the NYSE and the Nasdaq exchange, which at least indicated that institutional selling pressure was not intensifying. Breadth was negative as decliners led advancers by a 2-1 margin on the NYSE and on the Nasdaq exchange. The total number of stocks hitting new 52-week highs still outnumbered new 52-week lows on the NYSE, but new lows outnumbered new highs on the Nasdaq exchange. There were 10 high-ranked companies from the CANSLIM.net Leaders List making new 52-week highs and appearing on the CANSLIM.net BreakOuts Page, down from the prior session total of 14 stocks. Any sustainable rally requires a healthy crop of companies hitting new 52-week highs, so it is essential to see meaningful leadership continue. There were gains for only 3 of the 13 high-ranked companies currently included on the Featured Stocks Page.
The major averages had pared losses on reports President Obama was offering a scaled back budget proposal at a meeting with Congressional leaders, then the major averages closed near session lows amid uncertainty lawmakers will reach a deal to avoid the fiscal cliff. The scheduled tax increases and spending cuts that go into effect January 1st are widely expected to slow the economy.
On the economic front, a report showed activity in the Midwest expanded more-than-expected in December. Pending home sales increased +1.7% in November to its highest level since April 2010.
Energy and materials sectors were leading the market decline. Dow component Exxon Mobil Corp (XOM -2.03%) fell after a report showed gas inventories climbed to a nine-month high. Coal producer Peabody Energy Corp (BTU -2.39%) also faced pressure. In other news, shares of Barnes & Noble Inc (BKS +6%) rose after British publisher Pearson agreed to purchase a 5% stake in the company's Nook e-reader unit.
The 10-year note was up 3/8 of a point to yield 1.69%.
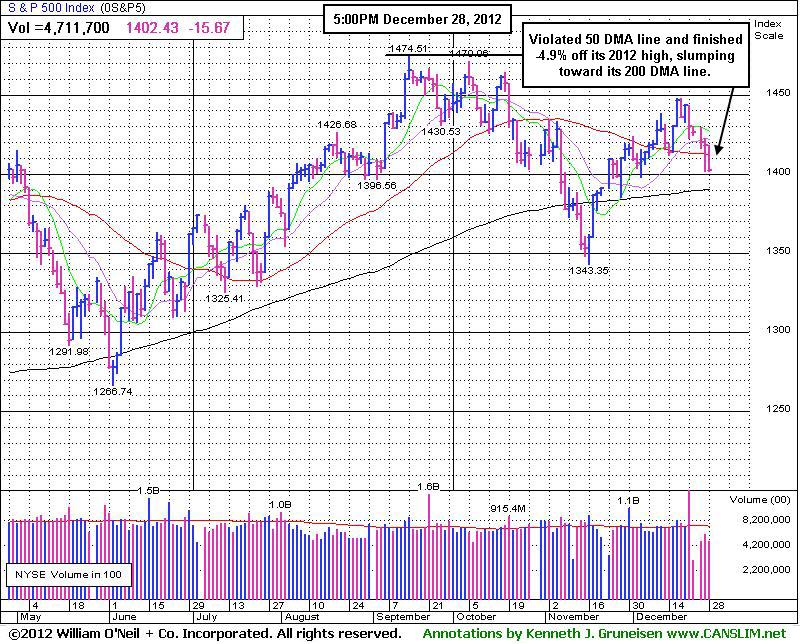
Technically, the market (M criteria) has entered another "correction" as the Dow Jones Industrial Average and Nasdaq Composite Index both undercut their respective 50-day moving average (DMA) and 200 DMA lines, and the benchmark S&P 500 Index violated its 50 DMA line. The damaging losses prompt investors to avoid new buying efforts until a new confirmed rally with follow-though day, and meanwhile have a bias toward reducing exposure in stocks. Each individual holding should be closely monitored for any signs of technical deterioration.
Watch for an announcement via email concerning the next WEBCAST. The webcast will also be available via an updated link highlighted at the top of the Premium Member Homepage.
PICTURED: The benchmark S&P 500 Index undercut its 50-day moving average (DMA) line and finished -4.9% off its 2012 high, slumping toward its 200 DMA line.
|
 Kenneth J. Gruneisen started out as a licensed stockbroker in August 1987, a couple of months prior to the historic stock market crash that took the Dow Jones Industrial Average down -22.6% in a single day. He has published daily fact-based fundamental and technical analysis on high-ranked stocks online for two decades. Through FACTBASEDINVESTING.COM, Kenneth provides educational articles, news, market commentary, and other information regarding proven investment systems that work in good times and bad.
Comments contained in the body of this report are technical opinions only and are not necessarily those of Gruneisen Growth Corp. The material herein has been obtained from sources believed to be reliable and accurate, however, its accuracy and completeness cannot be guaranteed. Our firm, employees, and customers may effect transactions, including transactions contrary to any recommendation herein, or have positions in the securities mentioned herein or options with respect thereto. Any recommendation contained in this report may not be suitable for all investors and it is not to be deemed an offer or solicitation on our part with respect to the purchase or sale of any securities. |
|
 |
Retail, Financial, Tech, Energy, and Defensive Groups Fell
Kenneth J. Gruneisen - Passed the CAN SLIM® Master's Exam
The Retail Index ($RLX -0.70%) had a negative influence on the major averages while the Bank Index ($BKX -0.71%) suffered a small loss and the Broker/Dealer Index ($XBD -0.13%) inched lower. Energy-related shares were weaker and the Integrated Oil Index ($XOI -1.81%) and Oil Services Index ($OSX -1.27%) fell while the market anticipated weaker economic activity. Defensive groups also lost ground as the Healthcare Index ($HMO -1.58%) and the Gold & Silver Index ($XAU -0.97%) fell. The tech sector saw unanimous losses from the Networking Index ($NWX -1.39%), Internet Index ($IIX -0.98%), Biotechnology Index ($BTK -0.91%), and the Semiconductor Index ($SOX -0.71%), rounding out Friday's widely negative session.
Charts courtesy www.stockcharts.com
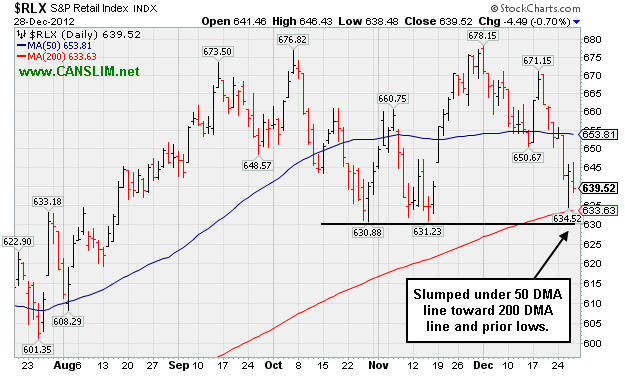
PICTURED: The Retail Index ($RLX -0.70%) has slumped under its 50-day moving average (DMA) line toward its 200 DMA line and prior lows. Consumers account for about 2/3 of the economy, and concerns about the "fiscal cliff" in Washington have been recently taking a toll on consumer sentiment.
| Oil Services |
$OSX |
214.60 |
-2.76 |
-1.27% |
-0.78% |
| Healthcare |
$HMO |
2,471.73 |
-39.68 |
-1.58% |
+8.33% |
| Integrated Oil |
$XOI |
1,216.85 |
-22.44 |
-1.81% |
-1.00% |
| Semiconductor |
$SOX |
376.87 |
-2.68 |
-0.71% |
+3.41% |
| Networking |
$NWX |
222.98 |
-3.14 |
-1.39% |
+3.63% |
| Internet |
$IIX |
321.06 |
-3.19 |
-0.98% |
+13.96% |
| Broker/Dealer |
$XBD |
93.03 |
-0.12 |
-0.13% |
+11.72% |
| Retail |
$RLX |
639.52 |
-4.49 |
-0.71% |
+22.23% |
| Gold & Silver |
$XAU |
160.62 |
-1.58 |
-0.97% |
-11.08% |
| Bank |
$BKX |
50.59 |
-0.36 |
-0.71% |
+28.47% |
| Biotech |
$BTK |
1,517.08 |
-13.96 |
-0.91% |
+39.00% |
|
|
|
 |
Formed New Base, But Yet To Trigger Technical Buy Signal
Kenneth J. Gruneisen - Passed the CAN SLIM® Master's Exam
Often, when a leading stock is setting up to breakout of a solid base it is highlighted in CANSLIM.net's Mid-Day Breakouts Report. Sometimes stocks are highlighted shortly after a technical breakout, yet while the potential buy candidate may still be considered action-worthy. The most relevant factors are noted in the report which alerts prudent CANSLIM oriented investors to place the issue in their watch list. After doing any necessary backup research, the investor is prepared to act after the stock triggers a technical buy signal (breaks above its pivot point on more than +50% average turnover) but before it gets too extended from a sound base. In the event the stock fails to trigger a technical buy signal and its price declines then it will simply be removed from the watch list. Disciplined investors know to buy as near as possible to the pivot point and avoid chasing stocks after they have rallied more than +5% above their pivot point. It is crucial to always limit losses whenever any stock heads the wrong direction, and disciplined investors sell if a struggling stock ever falls more than -7% from their purchase price.
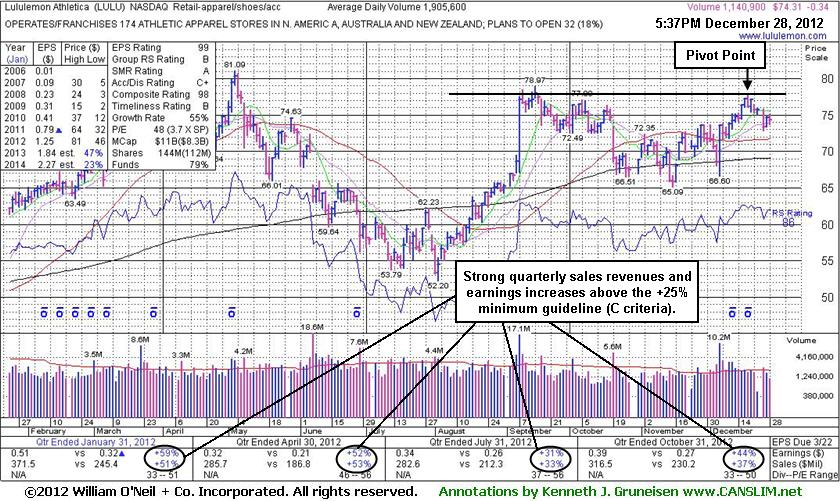
Lululemon Athletica (LULU -$0.34 or -0.46% to $74.31) was highlighted in yellow again with new pivot point cited based on its 12/19/12 high plus 10 cents when it showed up in the 12/26/12 mid-day report (read here). It has encountered stubborn resistance in the $80 area. Subsequent volume-driven gains above its pivot point are still needed to trigger a new technical buy signal. Fundamentals (C and A criteria) remain strong and its resilience is encouraging. Keep in mind that the M criteria may also be an overriding concern arguing against new buying efforts in stocks until a new confirmed rally with a follow through day.
Its last appearance in this FSU section was on 10/02/12 with an annotated graph under the headline, "Former Favorite Still Has Strong Characteristics", while building on a cup-with-handle base pattern. It did not yet trigger a technical buy signal. It found support near its 200-day moving average (DMA) line since dropped from the Featured Stocks list on 10/22/12 after violating its 50 DMA line with a damaging loss on heavy volume. However, it has rebounded impressively, and very little resistance remains due to overhead supply.
It reported earnings +44% on +37% sales revenues for the quarter ended October 31, 2012 versus the year ago period. The number of top-rated funds owning its shares rose from 417 in Sep '11 to 595 in Sep '12, a good sign concerning the I criteria. LULU was first featured in yellow at $23.83 (split adjusted after 2:1 split effective 7/21/11) in the October 8, 2010 mid-day report report (read here) and it traded up as much as +163.7% in a little more than 9 months. As previously noted - "In a bullish market, many high-ranked leaders offer multiple opportunities to accumulate their shares under the fact-based system's strict guidelines. Patience may often allow another ideal base or secondary buy point to possibly develop and be noted."
|
|
|
Color Codes Explained :
Y - Better candidates highlighted by our
staff of experts.
G - Previously featured
in past reports as yellow but may no longer be buyable under the
guidelines.
***Last / Change / Volume data in this table is the closing quote data***
Symbol/Exchange
Company Name
Industry Group |
PRICE |
CHANGE
(%Change) |
Day High |
Volume
(% DAV)
(% 50 day avg vol) |
52 Wk Hi
% From Hi |
Featured
Date |
Price
Featured |
Pivot Featured |
|
Max Buy |
CELG
-
NASDAQ
Celgene Corp
DRUGS - Drug Manufacturers - Major
|
$77.73
|
-0.85
-1.08% |
$78.72
|
1,518,320
54.31% of 50 DAV
50 DAV is 2,795,800
|
$82.78
-6.10%
|
12/11/2012
|
$82.24
|
PP = $81.34
|
|
MB = $85.41
|
 Most Recent Note - 12/28/2012 9:52:46 AM
Y - Down today and on track for its 5th consecutive small loss, consolidating above its 50 DMA which defines important near-term support. Slumped below its pivot point following a technical buy signal on 12/11/12. Disciplined investors always limit losses if any stock falls -7% from their purchase price.
>>> The latest Featured Stock Update with an annotated graph appeared on 12/12/2012. Click here.
View all notes |
Alert me of new notes |
CANSLIM.net Company Profile |
SEC |
Zacks Reports |
StockTalk |
News |
Chart |
Request a new note
C
A N
S L
I M


|
CFNL
-
NASDAQ
Cardinal Financial Corp
BANKING - Regional - Southeast Banks
|
$16.05
|
-0.04
-0.25% |
$16.20
|
90,060
42.89% of 50 DAV
50 DAV is 210,000
|
$16.66
-3.66%
|
12/3/2012
|
$15.20
|
PP = $16.31
|
|
MB = $17.13
|
Most Recent Note - 12/28/2012 9:49:40 AM
Y - Still quietly consolidating -3.7% off its 52-week high today and hovering near its pivot point. A gain above the pivot point backed by at least +40% above average volume may trigger a proper new (or add-on) technical buy signal.
>>> The latest Featured Stock Update with an annotated graph appeared on 12/10/2012. Click here.
View all notes |
Alert me of new notes |
CANSLIM.net Company Profile |
SEC |
Zacks Reports |
StockTalk |
News |
Chart |
Request a new note
C
A N
S L
I M
|
CMCSA
-
NASDAQ
Comcast Corp Cl A
MEDIA - CATV Systems
|
$36.54
|
-0.29
-0.78% |
$36.99
|
7,587,380
63.45% of 50 DAV
50 DAV is 11,958,100
|
$38.22
-4.40%
|
12/3/2012
|
$37.08
|
PP = $38.06
|
|
MB = $39.96
|
Most Recent Note - 12/27/2012 4:33:51 PM
Y - Finished in the upper half of its intra-day range after dipping below its 50 DMA line amid widespread weakness today. It did not trigger a technical buy signal yet while highlighted in yellow throughout December. See the latest FSU analysis for more details and a new annotated graph.
>>> The latest Featured Stock Update with an annotated graph appeared on 12/27/2012. Click here.
View all notes |
Alert me of new notes |
CANSLIM.net Company Profile |
SEC |
Zacks Reports |
StockTalk |
News |
Chart |
Request a new note
C
A N
S L
I M
|
LULU
-
NASDAQ
Lululemon Athletica
MANUFACTURING - Textile Manufacturing
|
$74.31
|
-0.34
-0.46% |
$75.13
|
1,141,124
59.88% of 50 DAV
50 DAV is 1,905,600
|
$81.09
-8.36%
|
12/26/2012
|
$73.81
|
PP = $77.95
|
|
MB = $81.85
|
Most Recent Note - 12/28/2012 5:54:20 PM
Y - Color code was changed to yellow again with new pivot point cited based on its 12/19/12 high plus 10 cents as highlighted in the 12/26/12 mid-day report (read here). Subsequent volume-driven gains above its pivot point are still needed to trigger a new technical buy signal. See the latest FSU analysis for more details and a new annotated graph.
>>> The latest Featured Stock Update with an annotated graph appeared on 12/28/2012. Click here.
View all notes |
Alert me of new notes |
CANSLIM.net Company Profile |
SEC |
Zacks Reports |
StockTalk |
News |
Chart |
Request a new note
C
A N
S L
I M
|
MIDD
-
NASDAQ
Middleby Corp
MANUFACTURING - Diversified Machinery
|
$125.47
|
-0.82
-0.65% |
$127.20
|
57,957
66.09% of 50 DAV
50 DAV is 87,700
|
$134.51
-6.72%
|
10/8/2012
|
$118.46
|
PP = $122.67
|
|
MB = $128.80
|
Most Recent Note - 12/26/2012 5:19:55 PM
G - Halted its slide with a gain today on light volume following distributional pressure after a negative reversal on 12/19/12 at its new 52-week and all-time high. Earnings +23% on +18% sales for the Sep '12 quarter, below the +25% minimum earnings guideline (C criteria), raised concerns. See the latest FSU analysis for more details and an annotated graph.
>>> The latest Featured Stock Update with an annotated graph appeared on 12/26/2012. Click here.
View all notes |
Alert me of new notes |
CANSLIM.net Company Profile |
SEC |
Zacks Reports |
StockTalk |
News |
Chart |
Request a new note
C
A N
S L
I M
|
Symbol/Exchange
Company Name
Industry Group |
PRICE |
CHANGE
(%Change) |
Day High |
Volume
(% DAV)
(% 50 day avg vol) |
52 Wk Hi
% From Hi |
Featured
Date |
Price
Featured |
Pivot Featured |
|
Max Buy |
N
-
NYSE
Netsuite Inc
DIVERSIFIED SERVICES - Business/Management Services
|
$65.20
|
-0.35
-0.53% |
$65.70
|
167,955
37.44% of 50 DAV
50 DAV is 448,600
|
$67.82
-3.86%
|
12/12/2012
|
$64.75
|
PP = $67.12
|
|
MB = $70.48
|
Most Recent Note - 12/28/2012 11:16:38 AM
Y - Retreating from its 52-week high with today's 6th consecutive small loss on light volume. Disciplined investors know that volume must be at least +40% above average behind gains above the pivot point to trigger a proper technical buy signal.
>>> The latest Featured Stock Update with an annotated graph appeared on 12/13/2012. Click here.
View all notes |
Alert me of new notes |
CANSLIM.net Company Profile |
SEC |
Zacks Reports |
StockTalk |
News |
Chart |
Request a new note
C
A N
S L
I M
|
NSR
-
NYSE
Neustar Inc
TELECOMMUNICATIONS - Diversified Communication Serv
|
$41.54
|
-0.09
-0.22% |
$42.01
|
491,648
131.14% of 50 DAV
50 DAV is 374,900
|
$43.85
-5.27%
|
12/11/2012
|
$41.85
|
PP = $41.41
|
|
MB = $43.48
|
Most Recent Note - 12/28/2012 12:35:58 PM
Y - Posting a small gain today. It found prompt support after dipping near its 50 DMA line on the prior session before finishing in the upper third of its intra-day range, an encouraging sign. Subsequent deterioration below its old high close ($41.05 on 10/05/12) could negate its recent breakout, a worrisome sign.
>>> The latest Featured Stock Update with an annotated graph appeared on 12/11/2012. Click here.
View all notes |
Alert me of new notes |
CANSLIM.net Company Profile |
SEC |
Zacks Reports |
StockTalk |
News |
Chart |
Request a new note
C
A N
S L
I M
|
RAX
-
NYSE
Rackspace Hosting Inc
INTERNET - Internet Software and; Services
|
$72.72
|
+0.55
0.76% |
$73.28
|
832,117
57.17% of 50 DAV
50 DAV is 1,455,500
|
$73.86
-1.54%
|
12/18/2012
|
$71.88
|
PP = $70.10
|
|
MB = $73.61
|
Most Recent Note - 12/28/2012 11:21:00 AM
Y - Holding its ground but failing to make meaningful price progress in recent weeks while volume totals have been cooling. Prior highs in the $70 area define initial support to watch following its recent breakout. Disciplined investors always limit losses if ever any stock falls more than -7% from their purchase price.
>>> The latest Featured Stock Update with an annotated graph appeared on 12/18/2012. Click here.
View all notes |
Alert me of new notes |
CANSLIM.net Company Profile |
SEC |
Zacks Reports |
StockTalk |
News |
Chart |
Request a new note
C
A N
S L
I M
|
RNF
-
NYSE
Rentech Nitrogen Ptnr Lp
CHEMICALS - Agricultural Chemicals
|
$37.68
|
+0.11
0.29% |
$37.89
|
141,043
48.44% of 50 DAV
50 DAV is 291,200
|
$41.15
-8.43%
|
11/1/2012
|
$39.11
|
PP = $40.15
|
|
MB = $42.16
|
Most Recent Note - 12/28/2012 11:24:23 AM
Y - Still quietly consolidating near its 50 DMA line. While patient investors may still be watching for a technical buy signal, a violation of its recent low ($36.06 on 12/18/12) would raise more serious concerns and could trigger a technical sell signal.
>>> The latest Featured Stock Update with an annotated graph appeared on 12/19/2012. Click here.
View all notes |
Alert me of new notes |
CANSLIM.net Company Profile |
SEC |
Zacks Reports |
StockTalk |
News |
Chart |
Request a new note
C
A N
S L
I M
|
ULTA
-
NASDAQ
Ulta Salon Cosm & Frag
SPECIALTY RETAIL - Specialty Retail, Other
|
$96.55
|
+0.11
0.11% |
$97.40
|
323,072
40.36% of 50 DAV
50 DAV is 800,500
|
$103.52
-6.73%
|
12/4/2012
|
$100.29
|
PP = $103.62
|
|
MB = $108.80
|
Most Recent Note - 12/28/2012 9:54:22 AM
Y - Still quietly consolidating above its 50 DMA line which recently acted as support. As previously noted, its waning Relative Strength rating, below the 80+ minimum guideline for buy candidates, is a concern.
>>> The latest Featured Stock Update with an annotated graph appeared on 12/21/2012. Click here.
View all notes |
Alert me of new notes |
CANSLIM.net Company Profile |
SEC |
Zacks Reports |
StockTalk |
News |
Chart |
Request a new note
C
A N
S L
I M
|
Symbol/Exchange
Company Name
Industry Group |
PRICE |
CHANGE
(%Change) |
Day High |
Volume
(% DAV)
(% 50 day avg vol) |
52 Wk Hi
% From Hi |
Featured
Date |
Price
Featured |
Pivot Featured |
|
Max Buy |
VRX
-
NYSE
Valeant Pharmaceuticals
DRUGS - Drug Manufacturers - Other
|
$58.87
|
-0.81
-1.36% |
$59.93
|
673,158
47.49% of 50 DAV
50 DAV is 1,417,600
|
$61.11
-3.67%
|
12/20/2012
|
$60.24
|
PP = $61.21
|
|
MB = $64.27
|
Most Recent Note - 12/28/2012 9:56:45 AM
Y - It stalled and encountered mild distributional pressure after highlighted in yellow in the 12/20/12 mid-day report, encountering stubborn resistance again in the $60-61 area. Disciplined investors may watch for a volume-driven gain above its pivot point to trigger a technical buy signal before taking action.
>>> The latest Featured Stock Update with an annotated graph appeared on 12/20/2012. Click here.
View all notes |
Alert me of new notes |
CANSLIM.net Company Profile |
SEC |
Zacks Reports |
StockTalk |
News |
Chart |
Request a new note
C
A N
S L
I M
|
VSI
-
NYSE
Vitamin Shoppe Inc
SPECIALTY RETAIL - Specialty Retail, Other
|
$55.98
|
-0.03
-0.05% |
$56.59
|
176,935
71.95% of 50 DAV
50 DAV is 245,900
|
$61.89
-9.55%
|
12/3/2012
|
$59.06
|
PP = $61.99
|
|
MB = $65.09
|
Most Recent Note - 12/28/2012 9:59:20 AM
G - On track today for a 5th consecutive loss, slumping near prior lows and its 200 DMA line defining important support to watch in the $53 area. It faces resistance due to overhead supply up through the $61 level which has been a stubborn resistance level in recent months.
>>> The latest Featured Stock Update with an annotated graph appeared on 12/24/2012. Click here.
View all notes |
Alert me of new notes |
CANSLIM.net Company Profile |
SEC |
Zacks Reports |
StockTalk |
News |
Chart |
Request a new note
C
A N
S L
I M
|
WPI
-
NYSE
Watson Pharmaceuticals
DRUGS - Drugs - Generic
|
$89.04
|
-0.17
-0.19% |
$90.10
|
592,117
76.93% of 50 DAV
50 DAV is 769,700
|
$91.47
-2.66%
|
12/17/2012
|
$87.99
|
PP = $90.49
|
|
MB = $95.01
|
Most Recent Note - 12/28/2012 10:01:16 AM
Y - It stalled and has been quietly holding its ground since a gain with +122% above average volume for a new 52-week high on 12/21/12 clinched a technical buy signal. No resistance remains due to overhead supply. Its 50 DMA defines near-term support to watch.
>>> The latest Featured Stock Update with an annotated graph appeared on 12/17/2012. Click here.
View all notes |
Alert me of new notes |
CANSLIM.net Company Profile |
SEC |
Zacks Reports |
StockTalk |
News |
Chart |
Request a new note
C
A N
S L
I M
|
|
|
|
THESE ARE NOT BUY RECOMMENDATIONS!
Comments contained in the body of this report are technical
opinions only. The material herein has been obtained
from sources believed to be reliable and accurate, however,
its accuracy and completeness cannot be guaranteed.
This site is not an investment advisor, hence it does
not endorse or recommend any securities or other investments.
Any recommendation contained in this report may not
be suitable for all investors and it is not to be deemed
an offer or solicitation on our part with respect to
the purchase or sale of any securities. All trademarks,
service marks and trade names appearing in this report
are the property of their respective owners, and are
likewise used for identification purposes only.
This report is a service available
only to active Paid Premium Members.
You may opt-out of receiving report notifications
at any time. Questions or comments may be submitted
by writing to Premium Membership Services 665 S.E. 10 Street, Suite 201 Deerfield Beach, FL 33441-5634 or by calling 1-800-965-8307
or 954-785-1121.
|
|
|

