***Last / Change / Volume data in this table is the closing quote data***
Symbol/Exchange
Company Name
Industry Group |
PRICE |
CHANGE
(%Change) |
Day High |
Volume
(% DAV)
(% 50 day avg vol) |
52 Wk Hi
% From Hi |
Featured
Date |
Price
Featured |
Pivot Featured |
|
Max Buy |
ARMH
-
NASDAQ
A R M Holdings Plc Ads
ELECTRONICS - Semiconductor - Specialized
|
$54.80
|
-0.03
-0.05% |
$55.26
|
682,670
38.61% of 50 DAV
50 DAV is 1,768,300
|
$54.92
-0.22%
|
12/23/2013
|
$54.59
|
PP = $52.48
|
|
MB = $55.10
|
Most Recent Note - 12/23/2013 5:56:35 PM
Y - Finished strong today after highlighted in yellow with pivot point cited based on its 10/21/13 high plus 10 cents in the mid-day breakouts report (read here). Hit a new 52-week high with its 5th consecutive gain, and it technically broke out with a volume-driven gain on the prior session. This high-ranked UK-based Electronics - Semiconductor firm reported earnings +39% on +28% sales in the Sep '13 quarter, marking 3 consecutive quarterly comparisons with an earnings increase above the +25% minimum earnings guideline (C criteria). It followed a downturn in FY '09 earnings with strong annual earnings increases (A criteria). The number of top-rated funds owning its shares rose from 206 in Sep '12 to 256 in Sep '13, a reassuring sign concerning the I criteria. It has a large supply of 470 million shares outstanding. See the latest FSU analysis for more details and new annotated daily and weekly graphs.
>>> FEATURED STOCK ARTICLE : No Overhead Supply Remains Following Volume-Driven Breakout - 12/23/2013
View all notes |
Set NEW NOTE alert |
CANSLIM.net Company Profile |
SEC
News |
Chart |
Request a new note
C
A N
S L
I M


|
CELG
-
NASDAQ
Celgene Corp
DRUGS - Drug Manufacturers - Major
|
$168.93
|
-0.21
-0.12% |
$170.47
|
1,257,867
45.61% of 50 DAV
50 DAV is 2,758,100
|
$173.80
-2.80%
|
9/12/2013
|
$149.50
|
PP = $150.02
|
|
MB = $157.52
|
Most Recent Note - 12/24/2013 2:48:25 PM
G - Found prompt support near prior highs in the $161 area and its 50 DMA line recently. Subsequent violations would raise greater concerns and trigger technical sell signals.
>>> FEATURED STOCK ARTICLE : Cooling Volume Totals While Hovering Near Highs - 12/4/2013
View all notes |
Set NEW NOTE alert |
CANSLIM.net Company Profile |
SEC
News |
Chart |
Request a new note
C
A N
S L
I M
|
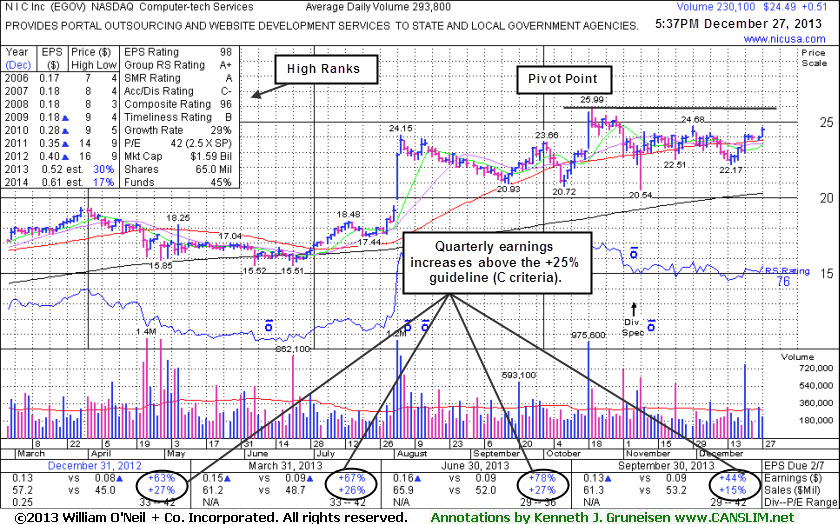
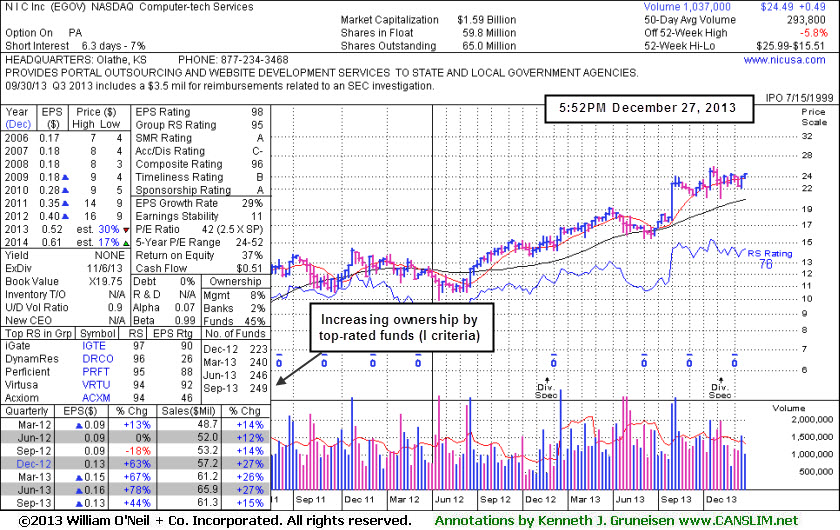
EGOV
-
NASDAQ
N I C Inc
INTERNET - Internet Software and Services
|
$24.49
|
+0.51
2.13% |
$24.66
|
230,131
78.33% of 50 DAV
50 DAV is 293,800
|
$25.99
-5.77%
|
12/20/2013
|
$24.00
|
PP = $26.09
|
|
MB = $27.39
|
 Most Recent Note - 12/27/2013 6:43:12 PM
Y - Subsequent gains above the pivot with sufficient volume may trigger a new (or add-on) technical buy signal. Recent low ($22.17 on 12/16/13) defines near-term support above its 200 DMA line. See the latest FSU analysis for more details and new annotated daily and weekly graphs.
>>> FEATURED STOCK ARTICLE : Rebounded Above 50-Day Average; Relative Strength Rating Waned - 12/27/2013
View all notes |
Set NEW NOTE alert |
CANSLIM.net Company Profile |
SEC
News |
Chart |
Request a new note
C
A N
S L
I M
|
EQM
-
NYSE
E Q T Midstream Partners
ENERGY - Oil and Gas Pipelines
|
$58.30
|
+0.47
0.81% |
$58.43
|
35,829
26.40% of 50 DAV
50 DAV is 135,700
|
$59.02
-1.22%
|
12/12/2013
|
$53.17
|
PP = $56.51
|
|
MB = $59.34
|
Most Recent Note - 12/23/2013 3:55:19 PM
Y - Gapped up today while rallying to a new 52-week high with today's 4th consecutive gain. A gain above the pivot point backed by at least +40% above average volume is needed to trigger a proper technical buy signal.
>>> FEATURED STOCK ARTICLE : Finding Support Near 50-Day Moving Average While Perched Near Highs - 12/13/2013
View all notes |
Set NEW NOTE alert |
CANSLIM.net Company Profile |
SEC
News |
Chart |
Request a new note
C
A N
S L
I M
|
FB
-
NASDAQ
Facebook Inc Cl A
INTERNET
|
$55.44
|
-2.29
-3.97% |
$57.68
|
60,385,803
80.10% of 50 DAV
50 DAV is 75,390,600
|
$58.58
-5.36%
|
12/12/2013
|
$51.40
|
PP = $54.93
|
|
MB = $57.68
|
Most Recent Note - 12/27/2013 6:40:56 PM
Y - Retreated below its "max buy" level and its color code is changed to yellow. Recently rallied from a 9-week cup shaped base without a handle after completing a Public Offering on 12/20/13.
>>> FEATURED STOCK ARTICLE : Well Known Social Media Firm on Watch List While Still Base Building - 12/12/2013
View all notes |
Set NEW NOTE alert |
CANSLIM.net Company Profile |
SEC
News |
Chart |
Request a new note
C
A N
S L
I M
|
Symbol/Exchange
Company Name
Industry Group |
PRICE |
CHANGE
(%Change) |
Day High |
Volume
(% DAV)
(% 50 day avg vol) |
52 Wk Hi
% From Hi |
Featured
Date |
Price
Featured |
Pivot Featured |
|
Max Buy |
FLT
-
NYSE
Fleetcor Technologies
DIVERSIFIED SERVICES - Business/Management Services
|
$115.95
|
-2.58
-2.18% |
$118.88
|
526,966
66.45% of 50 DAV
50 DAV is 793,000
|
$123.96
-6.46%
|
8/19/2013
|
$99.01
|
PP = $100.97
|
|
MB = $106.02
|
Most Recent Note - 12/24/2013 2:40:55 PM
G - Still consolidating above its 50 DMA line. A subsequent violation of that important near-term support level may trigger a technical sell signal.
>>> FEATURED STOCK ARTICLE : Enduring Distributional Pressure While Extended From Sound Base - 12/17/2013
View all notes |
Set NEW NOTE alert |
CANSLIM.net Company Profile |
SEC
News |
Chart |
Request a new note
C
A N
S L
I M
|
GNRC
-
NYSE
Generac Hldgs Inc
CONSUMER DURABLES - Electronic Equipment
|
$56.24
|
-0.30
-0.53% |
$56.59
|
360,983
46.20% of 50 DAV
50 DAV is 781,400
|
$57.05
-1.42%
|
11/26/2013
|
$53.02
|
PP = $52.42
|
|
MB = $55.04
|
Most Recent Note - 12/26/2013 6:31:07 PM
G - Finished at a best-ever close today following recent gains with light volume. Prior highs in the $52 area define initial support to watch on pullbacks.
>>> FEATURED STOCK ARTICLE : Following Latest Breakout Prior Highs Define Support - 11/29/2013
View all notes |
Set NEW NOTE alert |
CANSLIM.net Company Profile |
SEC
News |
Chart |
Request a new note
C
A N
S L
I M
|
HLF
-
NYSE
Herbalife Ltd
DRUGS - Nutrition and Weight Management
|
$78.28
|
-0.49
-0.62% |
$79.92
|
1,114,375
41.55% of 50 DAV
50 DAV is 2,682,300
|
$81.75
-4.24%
|
11/22/2013
|
$72.21
|
PP = $75.04
|
|
MB = $78.79
|
Most Recent Note - 12/24/2013 2:39:46 PM
Y - Pulled back from its 52-week high today following 6 consecutive gains, rallying with no resistance due to overhead supply. Color code is changed to yellow after quietly dipping below its "max buy" level.
>>> FEATURED STOCK ARTICLE : Perched Near Highs Following Rebound - 11/22/2013
View all notes |
Set NEW NOTE alert |
CANSLIM.net Company Profile |
SEC
News |
Chart |
Request a new note
C
A N
S L
I M
|
JAZZ
-
NASDAQ
Jazz Pharmaceuticals Plc
DRUGS - Biotechnology
|
$123.29
|
-2.32
-1.85% |
$125.62
|
362,499
49.07% of 50 DAV
50 DAV is 738,700
|
$126.84
-2.80%
|
9/30/2013
|
$93.20
|
PP = $89.10
|
|
MB = $93.56
|
Most Recent Note - 12/26/2013 6:32:38 PM
G - Hovering at its 52-week high after heavy volume behind considerable gains on 12/20/13 news it will buy Gentium Spa (GENT) for $1 Billion.
>>> FEATURED STOCK ARTICLE : Technically Extended Stock May Be a Dangerous Chase - 12/10/2013
View all notes |
Set NEW NOTE alert |
CANSLIM.net Company Profile |
SEC
News |
Chart |
Request a new note
C
A N
S L
I M
|
KORS
-
NYSE
Michael Kors Hldgs Ltd
RETAIL - Apparel Stores
|
$80.58
|
-0.44
-0.54% |
$81.44
|
1,440,820
29.95% of 50 DAV
50 DAV is 4,810,200
|
$84.58
-4.73%
|
8/6/2013
|
$69.66
|
PP = $66.28
|
|
MB = $69.59
|
Most Recent Note - 12/23/2013 12:37:12 PM
G - Retreating from its 52-week high with above average volume behind today's loss. Testing support to watch at its 50 DMA line. Did not form a recent base of sufficient length.
>>> FEATURED STOCK ARTICLE : Consolidation Too Brief To Note New Pivot - 12/6/2013
View all notes |
Set NEW NOTE alert |
CANSLIM.net Company Profile |
SEC
News |
Chart |
Request a new note
C
A N
S L
I M
|
Symbol/Exchange
Company Name
Industry Group |
PRICE |
CHANGE
(%Change) |
Day High |
Volume
(% DAV)
(% 50 day avg vol) |
52 Wk Hi
% From Hi |
Featured
Date |
Price
Featured |
Pivot Featured |
|
Max Buy |
MRLN
-
NASDAQ
Marlin Business Services
DIVERSIFIED SERVICES - Rental and Leasing Services
|
$25.30
|
-0.19
-0.75% |
$25.63
|
9,495
36.80% of 50 DAV
50 DAV is 25,800
|
$28.64
-11.66%
|
12/19/2013
|
$26.69
|
PP = $28.74
|
|
MB = $30.18
|
Most Recent Note - 12/26/2013 6:29:14 PM
Y - Rebounded above its 50 DMA line today with light volume behind its gain and its color code is changed to yellow. Subsequent volume-driven gains above the pivot point are needed to trigger a proper new technical buy signal.
>>> FEATURED STOCK ARTICLE : Finished Weak While Enduring Distributional Pressure - 12/19/2013
View all notes |
Set NEW NOTE alert |
CANSLIM.net Company Profile |
SEC
News |
Chart |
Request a new note
C
A N
S L
I M
|
PCLN
-
NASDAQ
Priceline.Com Inc
INTERNET - Internet Software and Services
|
$1,170.31
|
-19.54
-1.64% |
$1,191.74
|
516,271
87.49% of 50 DAV
50 DAV is 590,100
|
$1,198.75
-2.37%
|
12/18/2013
|
$1,156.20
|
PP = $1,198.85
|
|
MB = $1,258.79
|
Most Recent Note - 12/24/2013 2:44:35 PM
Y - Endured distributional pressure recently at its highs after forming an advanced "3-week tight" base, albeit a riskier "late-stage" set-up. The new pivot point was based on its 11/29/13 high plus 10 cents. Subsequent volume-driven gains above the pivot point may trigger a new (or add-on) technical buy signal. It 50 DMA line defines important support to watch on pullbacks.
>>> FEATURED STOCK ARTICLE : Extended From Any Sound Base Pattern - 12/3/2013
View all notes |
Set NEW NOTE alert |
CANSLIM.net Company Profile |
SEC
News |
Chart |
Request a new note
C
A N
S L
I M
|
SFUN
-
NYSE
Soufun Hldgs Ltd Ads A
INTERNET - Internet Information Providers
|
$81.14
|
-0.44
-0.54% |
$82.49
|
535,025
40.17% of 50 DAV
50 DAV is 1,331,800
|
$84.44
-3.90%
|
10/17/2013
|
$58.02
|
PP = $53.87
|
|
MB = $56.56
|
Most Recent Note - 12/24/2013 2:45:53 PM
G - Volume was below average behind today's 3rd consecutive gain for new all-time highs. Held its ground stubbornly and wedged higher since noted in prior reports with caution - "It is extended from any sound base pattern yet may produce more climactic gains. Prior highs and its 50 DMA line coincide in the $59 area defining important support to watch."
>>> FEATURED STOCK ARTICLE : Extended From Base Yet May Produce More Climactic Gains - 12/9/2013
View all notes |
Set NEW NOTE alert |
CANSLIM.net Company Profile |
SEC
News |
Chart |
Request a new note
C
A N
S L
I M
|
SILC
-
NASDAQ
Silicom Ltd
COMPUTER HARDWARE - Networking andamp; Communication Dev
|
$45.05
|
+0.10
0.22% |
$45.09
|
10,447
24.47% of 50 DAV
50 DAV is 42,700
|
$46.15
-2.38%
|
12/23/2013
|
$44.62
|
PP = $46.25
|
|
MB = $48.56
|
Most Recent Note - 12/27/2013 6:47:54 PM
Y - Inched higher today on light volume for a best-ever close. Approaching its pivot point cited based on its 11/12/13 high plus 10 cents noted in the 12/23/13 mid-day report (read here). This Israeli manufacturer of Computer - Networking devices rallied toward its 52-week high with today's 7th consecutive gain. Little resistance remains due to overhead supply. Subsequent volume-driven gains above the pivot point may trigger a technical buy signal. Its small supply (S criteria) of only 3.93 million shares in the public float can contribute to greater price volatility.
>>> FEATURED STOCK ARTICLE : Stock With Small Supply Has Formed a Sound Base Pattern - 12/24/2013
View all notes |
Set NEW NOTE alert |
CANSLIM.net Company Profile |
SEC
News |
Chart |
Request a new note
C
A N
S L
I M
|
SSNC
-
NASDAQ
S S & C Technologies
COMPUTER SOFTWARE and SERVICES - Application Software
|
$43.35
|
+0.26
0.60% |
$43.37
|
125,929
42.86% of 50 DAV
50 DAV is 293,800
|
$43.80
-1.03%
|
10/22/2013
|
$39.17
|
PP = $40.04
|
|
MB = $42.04
|
Most Recent Note - 12/23/2013 1:23:30 PM
G - Found prompt support near its 50 DMA line but it has not formed a sound new base. Recent low ($38.85 on 12/13/13) defines important near-term support to watch below its 50 DMA line.
>>> FEATURED STOCK ARTICLE : Found Prompt Support After Damaging Losses Raised Concerns - 12/16/2013
View all notes |
Set NEW NOTE alert |
CANSLIM.net Company Profile |
SEC
News |
Chart |
Request a new note
C
A N
S L
I M
|
Symbol/Exchange
Company Name
Industry Group |
PRICE |
CHANGE
(%Change) |
Day High |
Volume
(% DAV)
(% 50 day avg vol) |
52 Wk Hi
% From Hi |
Featured
Date |
Price
Featured |
Pivot Featured |
|
Max Buy |
SSYS
-
NASDAQ
Stratasys Ltd
COMPUTER HARDWARE - Computer Peripherals
|
$129.00
|
-1.33
-1.02% |
$132.81
|
720,748
62.79% of 50 DAV
50 DAV is 1,147,900
|
$134.00
-3.73%
|
10/11/2013
|
$102.94
|
PP = $105.38
|
|
MB = $110.65
|
Most Recent Note - 12/26/2013 6:27:29 PM
G - Perched near its 52-week high after rallying from support at its 50 DMA line. Previously noted with caution - "Reported earnings +13% on +153% sales revenues, below the +25% minimum earnings guideline (C criteria) raising fundamental concerns."
>>> FEATURED STOCK ARTICLE : Rallying From Support at 50-Day Moving Average Line - 12/20/2013
View all notes |
Set NEW NOTE alert |
CANSLIM.net Company Profile |
SEC
News |
Chart |
Request a new note
C
A N
S L
I M
|
ULTI
-
NASDAQ
Ultimate Software Group
INTERNET - Internet Software and Services
|
$153.09
|
+0.32
0.21% |
$154.04
|
94,760
64.46% of 50 DAV
50 DAV is 147,000
|
$162.88
-6.01%
|
10/16/2013
|
$142.95
|
PP = $151.18
|
|
MB = $158.74
|
Most Recent Note - 12/26/2013 6:24:35 PM
G - Inched above its 50 DMA line today with light volume behind its gain. See the latest FSU analysis for more details and new annotated daily and weekly graphs.
>>> FEATURED STOCK ARTICLE : Gain on Light Volume While Inching Above 50-Day Average - 12/26/2013
View all notes |
Set NEW NOTE alert |
CANSLIM.net Company Profile |
SEC
News |
Chart |
Request a new note
C
A N
S L
I M
|
VRX
-
NYSE
Valeant Pharmaceuticals
DRUGS - Drug Manufacturers - Other
|
$113.60
|
+0.04
0.04% |
$113.97
|
543,650
50.92% of 50 DAV
50 DAV is 1,067,700
|
$115.40
-1.56%
|
9/11/2013
|
$100.26
|
PP = $105.50
|
|
MB = $110.78
|
Most Recent Note - 12/23/2013 1:25:21 PM
G - Consolidating above its 50 DMA line and only -3.0% off its 52-week high. Recent lows in the $102 area define near-term support where a violation may trigger a technical sell signal. Resilient after earnings +24% on +74% sales revenues for the Sep '13 quarter came in a notch below the +25% minimum guideline (C criteria).
>>> FEATURED STOCK ARTICLE : Rebounding With Volume Backed Gains But Fundamental Concerns Remain - 12/18/2013
View all notes |
Set NEW NOTE alert |
CANSLIM.net Company Profile |
SEC
News |
Chart |
Request a new note
C
A N
S L
I M
|
YNDX
-
NASDAQ
Yandex N V Class A
INTERNET - Internet Information Providers
|
$42.58
|
-0.36
-0.84% |
$43.41
|
1,667,084
64.24% of 50 DAV
50 DAV is 2,595,200
|
$43.65
-2.45%
|
11/27/2013
|
$39.61
|
PP = $42.10
|
|
MB = $44.21
|
Most Recent Note - 12/26/2013 6:26:14 PM
Y - Rallied further above the previously cited pivot point and hit another new 52-week high with light volume behind today's 10th consecutive gain. Found prompt support at its 50 DMA line recently. At least +40% above average volume should be behind gains above the pivot point to trigger a proper new technical buy signal.
>>> FEATURED STOCK ARTICLE : Forming New Base Pattern With Little Resistance Remaining - 11/27/2013
View all notes |
Set NEW NOTE alert |
CANSLIM.net Company Profile |
SEC
News |
Chart |
Request a new note
C
A N
S L
I M
|