You are not logged in.
This means you
CAN ONLY VIEW reports that were published prior to Monday, April 14, 2025.
You
MUST UPGRADE YOUR MEMBERSHIP if you want to see any current reports.
AFTER MARKET UPDATE - THURSDAY, DECEMBER 27TH, 2012
Previous After Market Report Next After Market Report >>>
|
|
|
|
DOW |
-18.28 |
13,096.31 |
-0.14% |
|
Volume |
566,697,570 |
+19% |
|
Volume |
1,312,425,990 |
+27% |
|
NASDAQ |
-4.25 |
2,985.91 |
-0.14% |
|
Advancers |
1,367 |
43% |
|
Advancers |
1,066 |
41% |
|
S&P 500 |
-1.74 |
1,418.09 |
-0.12% |
|
Decliners |
1,682 |
53% |
|
Decliners |
1,401 |
54% |
|
Russell 2000 |
-1.49 |
837.40 |
-0.18% |
|
52 Wk Highs |
47 |
|
|
52 Wk Highs |
27 |
|
|
S&P 600 |
-0.26 |
470.36 |
-0.06% |
|
52 Wk Lows |
34 |
|
|
52 Wk Lows |
27 |
|
|
 |
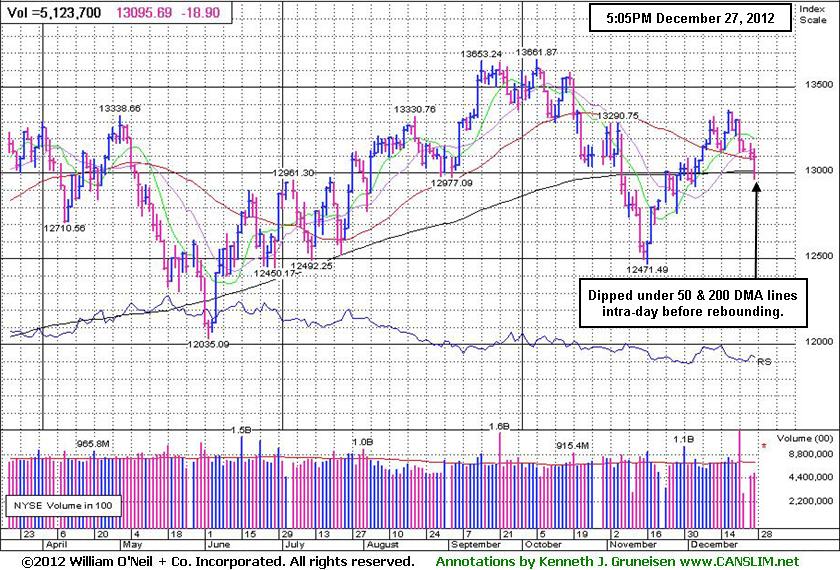
Indices Rebounded After Undercutting Important Moving Averages
Kenneth J. Gruneisen - Passed the CAN SLIM® Master's Exam
The major averages lost ground on Thursday's session but rebounded sharply from steep declines after the House of Representatives said it will reconvene on Sunday night to resume budget talks. The volume totals were reported higher on both the NYSE and the Nasdaq exchange verus the prior session. Breadth was slightly negative as decliners led advancers by an 8-7 margin on the NYSE and by a 7-5 margin on the Nasdaq exchange. The total number of stocks hitting new 52-week highs still outnumbered new 52-week lows on the NYSE, but new highs and new lows were evenly matched on the Nasdaq exchange. There were 14 high-ranked companies from the CANSLIM.net Leaders List making new 52-week highs and appearing on the CANSLIM.net BreakOuts Page, down from the prior session total of 18 stocks. Any sustainable rally requires a healthy crop of companies hitting new 52-week highs, so it is essential to see meaningful leadership continue. There were gains for only 3 of the 13 high-ranked companies currently included on the Featured Stocks Page.
The market was down for most of the session after Senate Leader Harry Reid suggested lawmakers are unlikely to reach an agreement on the scheduled tax increases and spending cuts before January 1st. As the deadline approached for the scheduled tax increases and spending cuts, Treasury Secretary Tim Geithner warned Congress the U.S. will hit the debt ceiling by the end of the month. On the economic front, weekly initial jobless claims declined to 350,000 from a revised prior reading of 362,000. Separate reports showed new home sales rose +4.4% to 377,000 in November while consumer confidence unexpectedly declined to a four-month low in December.
Materials and financials were the worst performing sectors. U.S. Steel Corp (X -2.56%) and JP Morgan Chase & Co (JPM -0.75%) were among the influential decliners. Consumer related stocks were the best performing with Expedia Inc (EXPE +4.09%) advancing.
The 10-year note was up 3/16 to yield 1.73%.
Technically, the market (M criteria) has seen its prior uptrend come under pressure, while, if not for the resilience shown, it could be more arguable that the market had entered another "correction". The benchmark S&P 500 Index and the Dow Jones Industrial Average both undercut their respective 50-day moving average (DMA) lines intra-day before finding support and rebounding to both finish Thursday's session above their 50 DMA lines. More damaging losses would prompt investors to start reducing exposure in stocks, meanwhile each individual holding should be closely monitored for any signs of technical deterioration.
Watch for an announcement via email concerning the next WEBCAST. The webcast will also be available via an updated link highlighted at the top of the Premium Member Homepage.
PICTURED: The Dow Jones Industrial Average undercut its 50-day and 200-day moving average (DMA) lines yet rebounded to finish above both of those important technical hurdles.
|
 Kenneth J. Gruneisen started out as a licensed stockbroker in August 1987, a couple of months prior to the historic stock market crash that took the Dow Jones Industrial Average down -22.6% in a single day. He has published daily fact-based fundamental and technical analysis on high-ranked stocks online for two decades. Through FACTBASEDINVESTING.COM, Kenneth provides educational articles, news, market commentary, and other information regarding proven investment systems that work in good times and bad.
Comments contained in the body of this report are technical opinions only and are not necessarily those of Gruneisen Growth Corp. The material herein has been obtained from sources believed to be reliable and accurate, however, its accuracy and completeness cannot be guaranteed. Our firm, employees, and customers may effect transactions, including transactions contrary to any recommendation herein, or have positions in the securities mentioned herein or options with respect thereto. Any recommendation contained in this report may not be suitable for all investors and it is not to be deemed an offer or solicitation on our part with respect to the purchase or sale of any securities. |
|
 |
Broker/Dealer Index Holding Onto Recent Gains
Kenneth J. Gruneisen - Passed the CAN SLIM® Master's Exam
Financial shares were mixed as the Bank Index ($BKX -0.39%) ended with a small loss and the Broker/Dealer Index ($XBD +0.17%) posted a small gain. The Networking Index ($NWX -0.59%), Semiconductor Index ($SOX -0.38%), and Internet Index ($IIX -0.36%) ended with modest losses while the Biotechnology Index ($BTK -0.05%) finished virtually unchanged. Energy-related shares showed little conviction as the Oil Services Index ($OSX -0.26%) edged lower and the Integrated Oil Index ($XOI +0.16%) edged higher. The Retail Index ($RLX +0.17%) posted a tiny gain and the Gold & Silver Index ($XAU +0.53%) was a standout with its modest gain, meanwhile the Healthcare Index ($HMO -0.17%) suffered a small loss.
Charts courtesy www.stockcharts.com
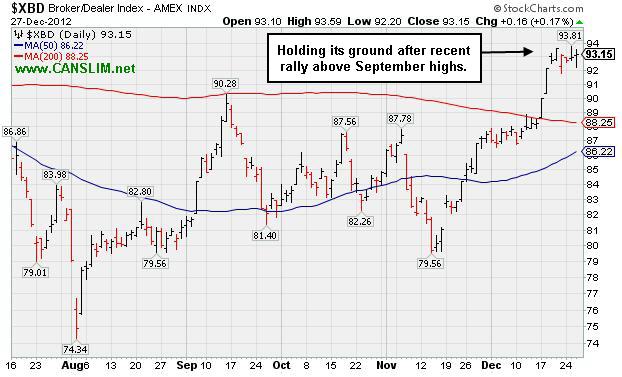
PICTURED: The Broker/Dealer Index ($XBD +0.17%) is holding its ground after recently rallying above its September highs.
| Oil Services |
$OSX |
217.36 |
-0.56 |
-0.26% |
+0.50% |
| Healthcare |
$HMO |
2,511.41 |
-4.25 |
-0.17% |
+10.07% |
| Integrated Oil |
$XOI |
1,239.29 |
+2.04 |
+0.16% |
+0.83% |
| Semiconductor |
$SOX |
379.55 |
-1.46 |
-0.38% |
+4.15% |
| Networking |
$NWX |
226.12 |
-1.35 |
-0.59% |
+5.09% |
| Internet |
$IIX |
324.25 |
-1.18 |
-0.36% |
+15.09% |
| Broker/Dealer |
$XBD |
93.15 |
+0.16 |
+0.17% |
+11.86% |
| Retail |
$RLX |
643.97 |
+1.10 |
+0.17% |
+23.08% |
| Gold & Silver |
$XAU |
162.20 |
+0.86 |
+0.53% |
-10.21% |
| Bank |
$BKX |
50.95 |
-0.20 |
-0.39% |
+29.38% |
| Biotech |
$BTK |
1,531.04 |
-0.78 |
-0.05% |
+40.28% |
|
|
|
 |
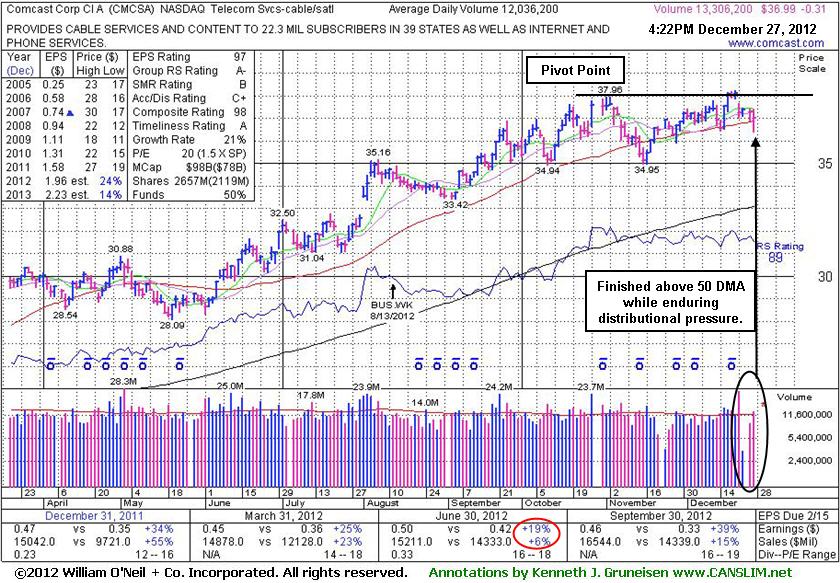
Found Support at 50-Day Average While Still Awaiting Breakout
Kenneth J. Gruneisen - Passed the CAN SLIM® Master's Exam
Comcast Corp Cl A (CMCSA -$0.31 or -0.83% to $36.99) finished in the upper half of its intra-day range after dipping below its 50-day moving average (DMA) line amid widespread weakness today. It did not trigger a technical buy signal yet while highlighted in yellow throughout December and repeatedly noted with caution - "Disciplined investors will watch for gains above the pivot point backed by at least the bare minimum +40% above average volume threshold to trigger a proper new (or add-on) technical buy signal before taking action." It was last shown in this FSU section on 12/07/12 with an annotated graph under the headline, "Perched Near New Pivot Point", while trading within close striking distance of its 52-week high with very little resistance remaining due to overhead supply.
Keep in mind that the M criteria argues against any new buying efforts when the major averages are in a correction. Subsequent volume-driven gains above the pivot point may trigger a new (or add-on) technical buy signal. Disciplined investors would have the patience to watch for a fresh breakout and favorable read on the current market environment before considering any new buying efforts.
It reported earnings +39% on +15% sales revenues for the Sep '12 quarter, above the fact-based investment system's +25% minimum guideline for the C criteria, a reassuring follow-up to the previously noted sub par quarter (see red circle). It has earned high ranks. Its annual earnings (A criteria) history has been strong and leadership from other firms in the Telecom Services - Cable/Satellite industry group is a reassuring sign concerning the L criteria. The number of top-rated funds owning its shares rose from 1,916 in Jun '11 to 2,221 in Sep '12, a reassuring sign concerning the I criteria. Its huge supply of 2.097 billion shares in the float could make it less likely to be a great sprinter, meanwhile, the S criteria calls for investors to usually look at small-cap or mid-cap companies.
|
|
|
Color Codes Explained :
Y - Better candidates highlighted by our
staff of experts.
G - Previously featured
in past reports as yellow but may no longer be buyable under the
guidelines.
***Last / Change / Volume data in this table is the closing quote data***
Symbol/Exchange
Company Name
Industry Group |
PRICE |
CHANGE
(%Change) |
Day High |
Volume
(% DAV)
(% 50 day avg vol) |
52 Wk Hi
% From Hi |
Featured
Date |
Price
Featured |
Pivot Featured |
|
Max Buy |
CELG
-
NASDAQ
Celgene Corp
DRUGS - Drug Manufacturers - Major
|
$78.58
|
-0.13
-0.17% |
$79.52
|
2,219,140
78.64% of 50 DAV
50 DAV is 2,821,800
|
$82.78
-5.07%
|
12/11/2012
|
$82.24
|
PP = $81.34
|
|
MB = $85.41
|
Most Recent Note - 12/21/2012 12:06:59 PM
Y - Down with above average volume today after a small gap down, enduring distributional pressure amid weakness in the broader market. Slumped below its pivot point following a technical buy signal on 12/11/12, however its small losses lacked great volume conviction. Disciplined investors always limit losses if any stock falls -7% from their purchase price.
>>> The latest Featured Stock Update with an annotated graph appeared on 12/12/2012. Click here.
View all notes |
Alert me of new notes |
CANSLIM.net Company Profile |
SEC |
Zacks Reports |
StockTalk |
News |
Chart |
Request a new note
C
A N
S L
I M


|
CFNL
-
NASDAQ
Cardinal Financial Corp
BANKING - Regional - Southeast Banks
|
$16.09
|
+0.04
0.25% |
$16.15
|
130,339
62.57% of 50 DAV
50 DAV is 208,300
|
$16.66
-3.42%
|
12/3/2012
|
$15.20
|
PP = $16.31
|
|
MB = $17.13
|
Most Recent Note - 12/20/2012 11:14:30 AM
Y - Today's 4th consecutive gain has it hitting a new 52-week high and rallying above its pivot point. A strong gain backed by at least +40% above average volume may trigger a proper new (or add-on) technical buy signal.
>>> The latest Featured Stock Update with an annotated graph appeared on 12/10/2012. Click here.
View all notes |
Alert me of new notes |
CANSLIM.net Company Profile |
SEC |
Zacks Reports |
StockTalk |
News |
Chart |
Request a new note
C
A N
S L
I M
|
CMCSA
-
NASDAQ
Comcast Corp Cl A
MEDIA - CATV Systems
|
$36.99
|
-0.31
-0.83% |
$37.36
|
13,453,102
111.77% of 50 DAV
50 DAV is 12,036,200
|
$38.22
-3.22%
|
12/3/2012
|
$37.08
|
PP = $38.06
|
|
MB = $39.96
|
 Most Recent Note - 12/27/2012 4:33:51 PM
Y - Finished in the upper half of its intra-day range after dipping below its 50 DMA line amid widespread weakness today. It did not trigger a technical buy signal yet while highlighted in yellow throughout December. See the latest FSU analysis for more details and a new annotated graph.
>>> The latest Featured Stock Update with an annotated graph appeared on 12/27/2012. Click here.
View all notes |
Alert me of new notes |
CANSLIM.net Company Profile |
SEC |
Zacks Reports |
StockTalk |
News |
Chart |
Request a new note
C
A N
S L
I M
|
LULU
-
NASDAQ
Lululemon Athletica
MANUFACTURING - Textile Manufacturing
|
$74.65
|
+1.27
1.73% |
$74.92
|
1,643,641
88.30% of 50 DAV
50 DAV is 1,861,400
|
$81.09
-7.94%
|
12/26/2012
|
$73.81
|
PP = $77.95
|
|
MB = $81.85
|
Most Recent Note - 12/27/2012 4:35:51 PM
Y - Color code was changed to yellow again with new pivot point cited based on its 12/19/12 high plus 10 cents as highlighted in the 12/26/12 mid-day report (read here). Encountered stubborn resistance in the $80 area, and subsequent volume-driven gains above its pivot point are still needed to trigger a new technical buy signal. Fundamentals (C and A criteria) remain strong and its resilience is encouraging, however its Relative Strength line was plotted higher earlier this year. Found support near its 200 DMA line since dropped from the Featured Stocks list on 10/22/12 after violating its 50 DMA line with a damaging loss on heavy volume.

>>> The latest Featured Stock Update with an annotated graph appeared on 10/2/2012. Click here.
View all notes |
Alert me of new notes |
CANSLIM.net Company Profile |
SEC |
Zacks Reports |
StockTalk |
News |
Chart |
Request a new note
C
A N
S L
I M
|
MIDD
-
NASDAQ
Middleby Corp
MANUFACTURING - Diversified Machinery
|
$126.29
|
-0.63
-0.50% |
$127.14
|
45,494
52.11% of 50 DAV
50 DAV is 87,300
|
$134.51
-6.11%
|
10/8/2012
|
$118.46
|
PP = $122.67
|
|
MB = $128.80
|
Most Recent Note - 12/26/2012 5:19:55 PM
G - Halted its slide with a gain today on light volume following distributional pressure after a negative reversal on 12/19/12 at its new 52-week and all-time high. Earnings +23% on +18% sales for the Sep '12 quarter, below the +25% minimum earnings guideline (C criteria), raised concerns. See the latest FSU analysis for more details and an annotated graph.
>>> The latest Featured Stock Update with an annotated graph appeared on 12/26/2012. Click here.
View all notes |
Alert me of new notes |
CANSLIM.net Company Profile |
SEC |
Zacks Reports |
StockTalk |
News |
Chart |
Request a new note
C
A N
S L
I M
|
Symbol/Exchange
Company Name
Industry Group |
PRICE |
CHANGE
(%Change) |
Day High |
Volume
(% DAV)
(% 50 day avg vol) |
52 Wk Hi
% From Hi |
Featured
Date |
Price
Featured |
Pivot Featured |
|
Max Buy |
N
-
NYSE
Netsuite Inc
DIVERSIFIED SERVICES - Business/Management Services
|
$65.55
|
-0.47
-0.71% |
$66.25
|
200,183
44.14% of 50 DAV
50 DAV is 453,500
|
$67.82
-3.35%
|
12/12/2012
|
$64.75
|
PP = $67.12
|
|
MB = $70.48
|
Most Recent Note - 12/24/2012 2:10:00 PM
Y - Hovering in a tight range near its 52-week high and its pivot point. Disciplined investors know that volume must be at least +40% above average behind gains above the pivot point to trigger a proper technical buy signal.
>>> The latest Featured Stock Update with an annotated graph appeared on 12/13/2012. Click here.
View all notes |
Alert me of new notes |
CANSLIM.net Company Profile |
SEC |
Zacks Reports |
StockTalk |
News |
Chart |
Request a new note
C
A N
S L
I M
|
NSR
-
NYSE
Neustar Inc
TELECOMMUNICATIONS - Diversified Communication Serv
|
$41.63
|
-0.50
-1.19% |
$42.26
|
906,727
250.62% of 50 DAV
50 DAV is 361,800
|
$43.85
-5.06%
|
12/11/2012
|
$41.85
|
PP = $41.41
|
|
MB = $43.48
|
Most Recent Note - 12/27/2012 12:18:39 PM
Y - Raising concerns with above average volume behind today's damaging loss, yet it is up from earlier lows near its 50 DMA line. A finish in the upper third of its intra-day range would be an encouraging sign it is attracting prompt support, but a finish near the session lows and below its old high close ($41.05 on 10/05/12), completely negating its recent breakout, would be a worrisome sign.
>>> The latest Featured Stock Update with an annotated graph appeared on 12/11/2012. Click here.
View all notes |
Alert me of new notes |
CANSLIM.net Company Profile |
SEC |
Zacks Reports |
StockTalk |
News |
Chart |
Request a new note
C
A N
S L
I M
|
RAX
-
NYSE
Rackspace Hosting Inc
INTERNET - Internet Software and; Services
|
$72.17
|
-0.10
-0.14% |
$72.75
|
880,637
59.01% of 50 DAV
50 DAV is 1,492,300
|
$73.86
-2.29%
|
12/18/2012
|
$71.88
|
PP = $70.10
|
|
MB = $73.61
|
Most Recent Note - 12/24/2012 1:21:03 PM
Y - Holding its ground stubbornly since its volume-driven gain on 12/18/12 above its new pivot point triggered a new (or add-on) technical buy signal. Prior highs in the $70 area define initial support to watch on pullbacks.
>>> The latest Featured Stock Update with an annotated graph appeared on 12/18/2012. Click here.
View all notes |
Alert me of new notes |
CANSLIM.net Company Profile |
SEC |
Zacks Reports |
StockTalk |
News |
Chart |
Request a new note
C
A N
S L
I M
|
RNF
-
NYSE
Rentech Nitrogen Ptnr Lp
CHEMICALS - Agricultural Chemicals
|
$37.57
|
-0.12
-0.32% |
$37.90
|
165,476
56.34% of 50 DAV
50 DAV is 293,700
|
$41.15
-8.70%
|
11/1/2012
|
$39.11
|
PP = $40.15
|
|
MB = $42.16
|
Most Recent Note - 12/24/2012 1:29:33 PM
Y - Quietly consolidating near its 50 DMA line. Disciplined investors may still be watching for volume-driven gains for a new high close to trigger a technical buy signal.
>>> The latest Featured Stock Update with an annotated graph appeared on 12/19/2012. Click here.
View all notes |
Alert me of new notes |
CANSLIM.net Company Profile |
SEC |
Zacks Reports |
StockTalk |
News |
Chart |
Request a new note
C
A N
S L
I M
|
ULTA
-
NASDAQ
Ulta Salon Cosm & Frag
SPECIALTY RETAIL - Specialty Retail, Other
|
$96.44
|
+0.72
0.75% |
$96.58
|
386,407
48.01% of 50 DAV
50 DAV is 804,800
|
$103.52
-6.84%
|
12/4/2012
|
$100.29
|
PP = $103.62
|
|
MB = $108.80
|
Most Recent Note - 12/21/2012 5:32:43 PM
Y - Consolidating above its 50 DMA line which recently acted as support. Waning Relative Strength rating, below the 80+ minimum guideline for buy candidates, is a concern. See the latest FSU analysis for more details and a new annotated graph.
>>> The latest Featured Stock Update with an annotated graph appeared on 12/21/2012. Click here.
View all notes |
Alert me of new notes |
CANSLIM.net Company Profile |
SEC |
Zacks Reports |
StockTalk |
News |
Chart |
Request a new note
C
A N
S L
I M
|
Symbol/Exchange
Company Name
Industry Group |
PRICE |
CHANGE
(%Change) |
Day High |
Volume
(% DAV)
(% 50 day avg vol) |
52 Wk Hi
% From Hi |
Featured
Date |
Price
Featured |
Pivot Featured |
|
Max Buy |
VRX
-
NYSE
Valeant Pharmaceuticals
DRUGS - Drug Manufacturers - Other
|
$59.68
|
-0.63
-1.04% |
$60.44
|
2,035,336
147.36% of 50 DAV
50 DAV is 1,381,200
|
$61.11
-2.34%
|
12/20/2012
|
$60.24
|
PP = $61.21
|
|
MB = $64.27
|
Most Recent Note - 12/20/2012 5:21:06 PM
Y - Rallied with +92% above average volume but failed to rise above its pivot point cited based on its 9/07/12 high plus 10 cents after highlighted in yellow in the earlier mid-day report. Encountered stubborn resistance in prior months near the $60-61 area. Disciplined investors may watch for a volume-driven gain above its pivot point to trigger a technical buy signal before taking action. Quarterly earnings increases (C criteria) have been strong and well above the +25% guideline. A downturn in FY '07 and '08 earnings (A criteria) has been followed by a strong earnings rebound in recent years. See the latest FSU analysis for more details and a new annotated graph.
>>> The latest Featured Stock Update with an annotated graph appeared on 12/20/2012. Click here.
View all notes |
Alert me of new notes |
CANSLIM.net Company Profile |
SEC |
Zacks Reports |
StockTalk |
News |
Chart |
Request a new note
C
A N
S L
I M
|
VSI
-
NYSE
Vitamin Shoppe Inc
SPECIALTY RETAIL - Specialty Retail, Other
|
$56.01
|
-0.09
-0.16% |
$56.45
|
230,425
94.44% of 50 DAV
50 DAV is 244,000
|
$61.89
-9.50%
|
12/3/2012
|
$59.06
|
PP = $61.99
|
|
MB = $65.09
|
Most Recent Note - 12/26/2012 12:45:50 PM
G - Slumping further below its 50 DMA line today raising more serious concerns while prior lows and its 200 DMA line define the next important support to watch. The $61 area has been a stubborn resistance level in recent months. See the latest FSU analysis for more details and a new annotated graph.
>>> The latest Featured Stock Update with an annotated graph appeared on 12/24/2012. Click here.
View all notes |
Alert me of new notes |
CANSLIM.net Company Profile |
SEC |
Zacks Reports |
StockTalk |
News |
Chart |
Request a new note
C
A N
S L
I M
|
WPI
-
NYSE
Watson Pharmaceuticals
DRUGS - Drugs - Generic
|
$89.21
|
-0.28
-0.31% |
$89.97
|
508,601
66.41% of 50 DAV
50 DAV is 765,900
|
$91.47
-2.47%
|
12/17/2012
|
$87.99
|
PP = $90.49
|
|
MB = $95.01
|
Most Recent Note - 12/21/2012 5:37:26 PM
Y - Gain today with +122% above average volume for a new 52-week high clinched a technical buy signal. No resistance remains due to overhead supply.
>>> The latest Featured Stock Update with an annotated graph appeared on 12/17/2012. Click here.
View all notes |
Alert me of new notes |
CANSLIM.net Company Profile |
SEC |
Zacks Reports |
StockTalk |
News |
Chart |
Request a new note
C
A N
S L
I M
|
|
|
|
THESE ARE NOT BUY RECOMMENDATIONS!
Comments contained in the body of this report are technical
opinions only. The material herein has been obtained
from sources believed to be reliable and accurate, however,
its accuracy and completeness cannot be guaranteed.
This site is not an investment advisor, hence it does
not endorse or recommend any securities or other investments.
Any recommendation contained in this report may not
be suitable for all investors and it is not to be deemed
an offer or solicitation on our part with respect to
the purchase or sale of any securities. All trademarks,
service marks and trade names appearing in this report
are the property of their respective owners, and are
likewise used for identification purposes only.
This report is a service available
only to active Paid Premium Members.
You may opt-out of receiving report notifications
at any time. Questions or comments may be submitted
by writing to Premium Membership Services 665 S.E. 10 Street, Suite 201 Deerfield Beach, FL 33441-5634 or by calling 1-800-965-8307
or 954-785-1121.
|
|
|

