You are not logged in.
This means you
CAN ONLY VIEW reports that were published prior to Monday, April 14, 2025.
You
MUST UPGRADE YOUR MEMBERSHIP if you want to see any current reports.
AFTER MARKET UPDATE - WEDNESDAY, DECEMBER 26TH, 2012
Previous After Market Report Next After Market Report >>>
|
|
|
|
DOW |
-24.49 |
13,114.59 |
-0.19% |
|
Volume |
475,584,460 |
+66% |
|
Volume |
1,036,316,990 |
+72% |
|
NASDAQ |
-22.44 |
2,990.16 |
-0.74% |
|
Advancers |
1,053 |
33% |
|
Advancers |
891 |
35% |
|
S&P 500 |
-6.83 |
1,419.83 |
-0.48% |
|
Decliners |
1,957 |
62% |
|
Decliners |
1,569 |
61% |
|
Russell 2000 |
-5.85 |
838.89 |
-0.69% |
|
52 Wk Highs |
67 |
|
|
52 Wk Highs |
29 |
|
|
S&P 600 |
-3.55 |
470.62 |
-0.75% |
|
52 Wk Lows |
20 |
|
|
52 Wk Lows |
20 |
|
|
 |
Breadth Negative as Major Averages Pulled Back
Kenneth J. Gruneisen - Passed the CAN SLIM® Master's Exam
The major averages lost ground on Wednesday's session while the volume totals were reported higher on both the NYSE and the Nasdaq exchange versus Monday's shortened session. Breadth was negative as decliners led advancers by nearly a 2-1 margin on the NYSE and on the Nasdaq exchange. The total number of stocks hitting new 52-week highs still outnumbered new 52-week lows on the NYSE and on the Nasdaq exchange. There were 18 high-ranked companies from the CANSLIM.net Leaders List making new 52-week highs and appearing on the CANSLIM.net BreakOuts Page, down from the prior session total of 22 stocks. Any sustainable rally requires a healthy crop of companies hitting new 52-week highs, so it is essential to see meaningful leadership continue. There were losses for 12 of the 13 high-ranked companies currently included on the Featured Stocks Page
The major averages spent the day trading in negative territory amid uncertainty surrounding fiscal cliff negotiations. President Obama and Congress are scheduled to resume talks on Thursday in an attempt to reach a deal to avoid the scheduled tax increases and spending cuts that to go into effect on Jan 1. On the economic front, home prices in the 20 largest U.S. cities rose more-than-expected in October. Another report showed manufacturing activity in the Richmond area slowed in December.
Consumer discretionary is the worst performing sector led by a decline in retailers. Urban Outfitters Inc (URBN -2.70%), Coach Inc (COH -5.89%), and Macy's Inc (M -1.04%) fell after a report showed holiday sales growth slowed this year. Tech also weighed on the market with Apple Inc (AAPL -1.38%) trading down. Materials were the best performing group with Cliff Natural Resources (CLF +1.95%) and U.S. Steel Corp (X +0.83%) advancing.
The 10-year note was up 3/16 to yield 1.75%.
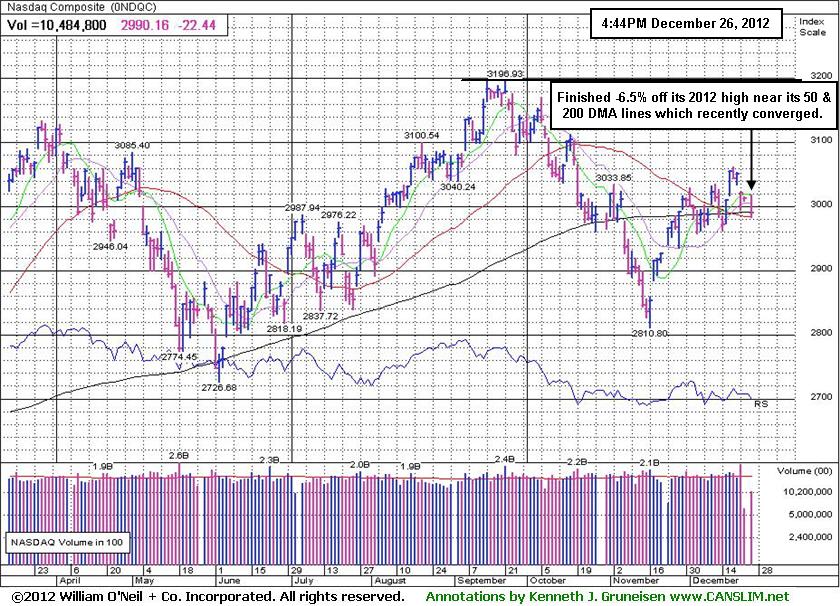
Technically, the market direction (M criteria) remains in a confirmed uptrend. The Nasdaq Composite Index, benchmark S&P 500 Index, and the Dow Jones Industrial Average are again collectively rallying above their respective 50-day moving average (DMA) lines. New buying efforts may be justified only in worthy high-ranked leaders. See the noteworthy companies included on the Featured Stocks Page.
Watch for an announcement via email concerning the next WEBCAST. The webcast will also be available via an updated link highlighted at the top of the Premium Member Homepage.
PICTURED: The Nasdaq Composite Index is consolidating -6.5% off its 2012 high, and it slumped near its 50-day and 200-day moving average (DMA) lines which recently converged.
|
 Kenneth J. Gruneisen started out as a licensed stockbroker in August 1987, a couple of months prior to the historic stock market crash that took the Dow Jones Industrial Average down -22.6% in a single day. He has published daily fact-based fundamental and technical analysis on high-ranked stocks online for two decades. Through FACTBASEDINVESTING.COM, Kenneth provides educational articles, news, market commentary, and other information regarding proven investment systems that work in good times and bad.
Comments contained in the body of this report are technical opinions only and are not necessarily those of Gruneisen Growth Corp. The material herein has been obtained from sources believed to be reliable and accurate, however, its accuracy and completeness cannot be guaranteed. Our firm, employees, and customers may effect transactions, including transactions contrary to any recommendation herein, or have positions in the securities mentioned herein or options with respect thereto. Any recommendation contained in this report may not be suitable for all investors and it is not to be deemed an offer or solicitation on our part with respect to the purchase or sale of any securities. |
|
 |
Retail Index, Tech, and Energy-Related Groups Fell
Kenneth J. Gruneisen - Passed the CAN SLIM® Master's Exam
Weakness in the Retail Index ($RLX -1.71%) weighed on the major averages on Wednesday. The Bank Index ($BKX +0.16%) and Broker/Dealer Index ($XBD +0.26%) posted small gains, and the Gold & Silver Index ($XAU +0.46%) rose while the Healthcare Index ($HMO +0.04%) finished flat. Energy-related shares fell and dragged the Oil Services Index ($OSX -0.73%) and Integrated Oil Index ($XOI -0.45%) lower. The tech sector saw unanimous losses from the Biotechnology Index ($BTK -1.09%), Semiconductor Index ($SOX -0.81%), Networking Index ($NWX -0.39%), and Internet Index ($IIX -0.33%).
Charts courtesy www.stockcharts.com
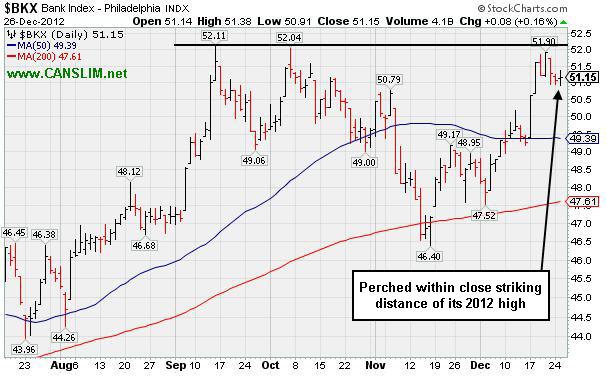
PICTURED: The Bank Index ($BKX +0.16%) is perched within close striking distance of its 2012 high.
| Oil Services |
$OSX |
217.92 |
-1.61 |
-0.73% |
+0.76% |
| Healthcare |
$HMO |
2,515.65 |
+0.91 |
+0.04% |
+10.26% |
| Integrated Oil |
$XOI |
1,237.26 |
-5.56 |
-0.45% |
+0.66% |
| Semiconductor |
$SOX |
381.01 |
-3.13 |
-0.81% |
+4.55% |
| Networking |
$NWX |
227.46 |
-0.90 |
-0.39% |
+5.72% |
| Internet |
$IIX |
325.43 |
-1.07 |
-0.33% |
+15.51% |
| Broker/Dealer |
$XBD |
92.99 |
+0.25 |
+0.26% |
+11.67% |
| Retail |
$RLX |
642.87 |
-11.20 |
-1.71% |
+22.87% |
| Gold & Silver |
$XAU |
161.34 |
+0.74 |
+0.46% |
-10.68% |
| Bank |
$BKX |
51.15 |
+0.08 |
+0.16% |
+29.89% |
| Biotech |
$BTK |
1,531.82 |
-16.83 |
-1.09% |
+40.35% |
|
|
|
 |
Following Distributional Action 50-Day Average Acted as Support
Kenneth J. Gruneisen - Passed the CAN SLIM® Master's Exam
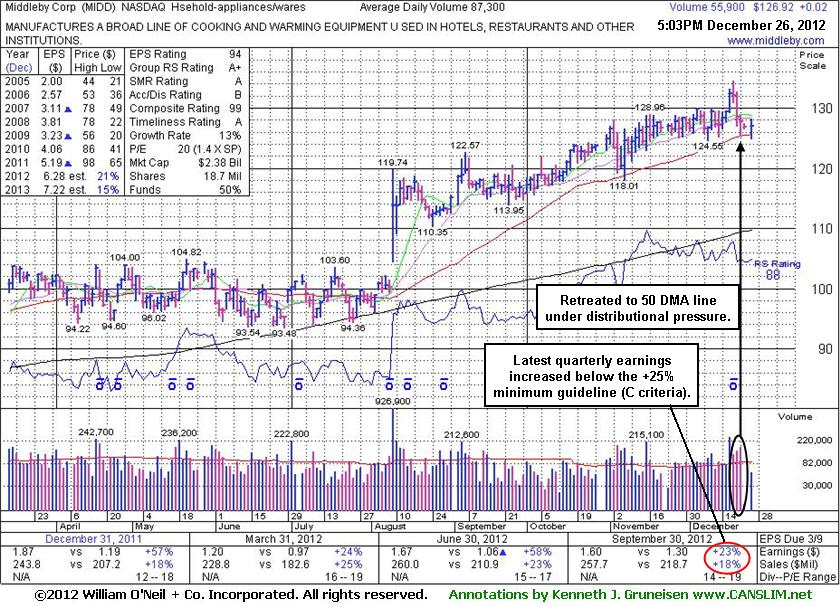
Middleby Corp (MIDD +0.02 or +0.02% to $126.92) halted its slide with a gain on light volume today. That followed 3 consecutive losses with above average volume and increasing volume, enduring distributional pressure after a negative reversal on 12/19/12 at its new 52-week and all-time high. Its last appearance in this FSU section was on 12/06/12 with an annotated graph under the headline, "Wedging Higher But Flaws Give Cause For Concern". That report cautioned members - "Disciplined investors may watch closely for sell signals if holding it and giving it a chance to produce more climactic gains. Its 50-day moving average (DMA) line defines near-term chart support to watch where any violation would trigger a technical sell signal. It reported earnings +23% on +18% sales for the Sep '12 quarter, below the +25% minimum earnings guideline (C criteria), raising fundamental concerns. Prior reports also cautioned that its annual earnings (A criteria) had a downturn in FY '09, yet they have otherwise been good and steady."
The number of top-rated funds owning its shares rose from 351 in Dec '11 to 389 in Sep '12, a reassuring sign concerning the I criteria. Today its current Up/Down Volume Ratio of 1.3 is an unbiased indication its shares have been under accumulation over the past 50 days. Its small supply (S criteria) of only 17.1 million shares can contribute to greater price volatility in the event of institutional buying or selling.
Investors who are disciplined, selective, and patient would likely watch for a fresh breakout in another high-ranked stock without any fundamental flaws, rather than looking for excuses to buy one with flaws.
|
|
|
Color Codes Explained :
Y - Better candidates highlighted by our
staff of experts.
G - Previously featured
in past reports as yellow but may no longer be buyable under the
guidelines.
***Last / Change / Volume data in this table is the closing quote data***
Symbol/Exchange
Company Name
Industry Group |
PRICE |
CHANGE
(%Change) |
Day High |
Volume
(% DAV)
(% 50 day avg vol) |
52 Wk Hi
% From Hi |
Featured
Date |
Price
Featured |
Pivot Featured |
|
Max Buy |
CELG
-
NASDAQ
Celgene Corp
DRUGS - Drug Manufacturers - Major
|
$78.71
|
-0.56
-0.71% |
$79.54
|
1,626,118
57.63% of 50 DAV
50 DAV is 2,821,800
|
$82.78
-4.92%
|
12/11/2012
|
$82.24
|
PP = $81.34
|
|
MB = $85.41
|
Most Recent Note - 12/21/2012 12:06:59 PM
Y - Down with above average volume today after a small gap down, enduring distributional pressure amid weakness in the broader market. Slumped below its pivot point following a technical buy signal on 12/11/12, however its small losses lacked great volume conviction. Disciplined investors always limit losses if any stock falls -7% from their purchase price.
>>> The latest Featured Stock Update with an annotated graph appeared on 12/12/2012. Click here.
View all notes |
Alert me of new notes |
CANSLIM.net Company Profile |
SEC |
Zacks Reports |
StockTalk |
News |
Chart |
Request a new note
C
A N
S L
I M


|
CFNL
-
NASDAQ
Cardinal Financial Corp
BANKING - Regional - Southeast Banks
|
$16.05
|
-0.07
-0.43% |
$16.12
|
109,989
52.80% of 50 DAV
50 DAV is 208,300
|
$16.66
-3.66%
|
12/3/2012
|
$15.20
|
PP = $16.31
|
|
MB = $17.13
|
Most Recent Note - 12/20/2012 11:14:30 AM
Y - Today's 4th consecutive gain has it hitting a new 52-week high and rallying above its pivot point. A strong gain backed by at least +40% above average volume may trigger a proper new (or add-on) technical buy signal.
>>> The latest Featured Stock Update with an annotated graph appeared on 12/10/2012. Click here.
View all notes |
Alert me of new notes |
CANSLIM.net Company Profile |
SEC |
Zacks Reports |
StockTalk |
News |
Chart |
Request a new note
C
A N
S L
I M
|
CMCSA
-
NASDAQ
Comcast Corp Cl A
MEDIA - CATV Systems
|
$37.30
|
-0.06
-0.16% |
$37.40
|
8,661,498
71.96% of 50 DAV
50 DAV is 12,036,200
|
$38.22
-2.41%
|
12/3/2012
|
$37.08
|
PP = $38.06
|
|
MB = $39.96
|
Most Recent Note - 12/21/2012 12:09:44 PM
Y - Small gap down for a loss with above average volume amid widespread weakness today. It did not trigger a buy signal since previously noted with caution - "Disciplined investors will watch for gains above the pivot point backed by at least the bare minimum +40% above average volume threshold to trigger a proper new (or add-on) technical buy signal before taking action."
>>> The latest Featured Stock Update with an annotated graph appeared on 12/7/2012. Click here.
View all notes |
Alert me of new notes |
CANSLIM.net Company Profile |
SEC |
Zacks Reports |
StockTalk |
News |
Chart |
Request a new note
C
A N
S L
I M
|
LULU
-
NASDAQ
Lululemon Athletica
MANUFACTURING - Textile Manufacturing
|
$73.38
|
-2.38
-3.14% |
$75.79
|
2,308,444
124.02% of 50 DAV
50 DAV is 1,861,400
|
$81.09
-9.51%
|
12/26/2012
|
$73.81
|
PP = $77.95
|
|
MB = $81.85
|
 Most Recent Note - 12/26/2012 12:36:08 PM
Y - Color code is changed to yellow again with new pivot point cited based on its 12/19/12 high plus 10 cents. Encountered stubborn resistance in the $80 area, and subsequent volume-driven gains above its pivot point are still needed to trigger a new technical buy signal. Fundamentals (C and A criteria) remain strong and its resilience is encouraging, however its Relative Strength line was plotted higher earlier this year. Found support near its 200 DMA line since dropped from the Featured Stocks list on 10/22/12 after violating its 50 DMA line with a damaging loss on heavy volume.

>>> The latest Featured Stock Update with an annotated graph appeared on 10/2/2012. Click here.
View all notes |
Alert me of new notes |
CANSLIM.net Company Profile |
SEC |
Zacks Reports |
StockTalk |
News |
Chart |
Request a new note
C
A N
S L
I M
|
MIDD
-
NASDAQ
Middleby Corp
MANUFACTURING - Diversified Machinery
|
$126.92
|
+0.02
0.02% |
$128.20
|
55,959
64.10% of 50 DAV
50 DAV is 87,300
|
$134.51
-5.64%
|
10/8/2012
|
$118.46
|
PP = $122.67
|
|
MB = $128.80
|
Most Recent Note - 12/26/2012 5:19:55 PM
G - Halted its slide with a gain today on light volume following distributional pressure after a negative reversal on 12/19/12 at its new 52-week and all-time high. Earnings +23% on +18% sales for the Sep '12 quarter, below the +25% minimum earnings guideline (C criteria), raised concerns. See the latest FSU analysis for more details and an annotated graph.
>>> The latest Featured Stock Update with an annotated graph appeared on 12/26/2012. Click here.
View all notes |
Alert me of new notes |
CANSLIM.net Company Profile |
SEC |
Zacks Reports |
StockTalk |
News |
Chart |
Request a new note
C
A N
S L
I M
|
Symbol/Exchange
Company Name
Industry Group |
PRICE |
CHANGE
(%Change) |
Day High |
Volume
(% DAV)
(% 50 day avg vol) |
52 Wk Hi
% From Hi |
Featured
Date |
Price
Featured |
Pivot Featured |
|
Max Buy |
N
-
NYSE
Netsuite Inc
DIVERSIFIED SERVICES - Business/Management Services
|
$66.02
|
-0.95
-1.42% |
$67.35
|
264,207
58.26% of 50 DAV
50 DAV is 453,500
|
$67.82
-2.65%
|
12/12/2012
|
$64.75
|
PP = $67.12
|
|
MB = $70.48
|
Most Recent Note - 12/24/2012 2:10:00 PM
Y - Hovering in a tight range near its 52-week high and its pivot point. Disciplined investors know that volume must be at least +40% above average behind gains above the pivot point to trigger a proper technical buy signal.
>>> The latest Featured Stock Update with an annotated graph appeared on 12/13/2012. Click here.
View all notes |
Alert me of new notes |
CANSLIM.net Company Profile |
SEC |
Zacks Reports |
StockTalk |
News |
Chart |
Request a new note
C
A N
S L
I M
|
NSR
-
NYSE
Neustar Inc
TELECOMMUNICATIONS - Diversified Communication Serv
|
$42.13
|
-0.49
-1.15% |
$42.74
|
211,964
58.59% of 50 DAV
50 DAV is 361,800
|
$43.85
-3.92%
|
12/11/2012
|
$41.85
|
PP = $41.41
|
|
MB = $43.48
|
Most Recent Note - 12/21/2012 3:56:27 PM
Y - Retreating from its 52-week high with above average volume behind today's 3rd consecutive small loss, yet it remains above its pivot point. Prior highs near $41 define initial support to watch on pullbacks.
>>> The latest Featured Stock Update with an annotated graph appeared on 12/11/2012. Click here.
View all notes |
Alert me of new notes |
CANSLIM.net Company Profile |
SEC |
Zacks Reports |
StockTalk |
News |
Chart |
Request a new note
C
A N
S L
I M
|
RAX
-
NYSE
Rackspace Hosting Inc
INTERNET - Internet Software and; Services
|
$72.27
|
-0.44
-0.61% |
$73.32
|
739,289
49.54% of 50 DAV
50 DAV is 1,492,300
|
$73.86
-2.15%
|
12/18/2012
|
$71.88
|
PP = $70.10
|
|
MB = $73.61
|
Most Recent Note - 12/24/2012 1:21:03 PM
Y - Holding its ground stubbornly since its volume-driven gain on 12/18/12 above its new pivot point triggered a new (or add-on) technical buy signal. Prior highs in the $70 area define initial support to watch on pullbacks.
>>> The latest Featured Stock Update with an annotated graph appeared on 12/18/2012. Click here.
View all notes |
Alert me of new notes |
CANSLIM.net Company Profile |
SEC |
Zacks Reports |
StockTalk |
News |
Chart |
Request a new note
C
A N
S L
I M
|
RNF
-
NYSE
Rentech Nitrogen Ptnr Lp
CHEMICALS - Agricultural Chemicals
|
$37.69
|
-0.03
-0.08% |
$38.49
|
223,894
76.23% of 50 DAV
50 DAV is 293,700
|
$41.15
-8.41%
|
11/1/2012
|
$39.11
|
PP = $40.15
|
|
MB = $42.16
|
Most Recent Note - 12/24/2012 1:29:33 PM
Y - Quietly consolidating near its 50 DMA line. Disciplined investors may still be watching for volume-driven gains for a new high close to trigger a technical buy signal.
>>> The latest Featured Stock Update with an annotated graph appeared on 12/19/2012. Click here.
View all notes |
Alert me of new notes |
CANSLIM.net Company Profile |
SEC |
Zacks Reports |
StockTalk |
News |
Chart |
Request a new note
C
A N
S L
I M
|
ULTA
-
NASDAQ
Ulta Salon Cosm & Frag
SPECIALTY RETAIL - Specialty Retail, Other
|
$95.72
|
-1.38
-1.42% |
$97.40
|
401,109
49.84% of 50 DAV
50 DAV is 804,800
|
$103.52
-7.53%
|
12/4/2012
|
$100.29
|
PP = $103.62
|
|
MB = $108.80
|
Most Recent Note - 12/21/2012 5:32:43 PM
Y - Consolidating above its 50 DMA line which recently acted as support. Waning Relative Strength rating, below the 80+ minimum guideline for buy candidates, is a concern. See the latest FSU analysis for more details and a new annotated graph.
>>> The latest Featured Stock Update with an annotated graph appeared on 12/21/2012. Click here.
View all notes |
Alert me of new notes |
CANSLIM.net Company Profile |
SEC |
Zacks Reports |
StockTalk |
News |
Chart |
Request a new note
C
A N
S L
I M
|
Symbol/Exchange
Company Name
Industry Group |
PRICE |
CHANGE
(%Change) |
Day High |
Volume
(% DAV)
(% 50 day avg vol) |
52 Wk Hi
% From Hi |
Featured
Date |
Price
Featured |
Pivot Featured |
|
Max Buy |
VRX
-
NYSE
Valeant Pharmaceuticals
DRUGS - Drug Manufacturers - Other
|
$60.31
|
-0.08
-0.13% |
$60.88
|
774,331
56.06% of 50 DAV
50 DAV is 1,381,200
|
$61.11
-1.31%
|
12/20/2012
|
$60.24
|
PP = $61.21
|
|
MB = $64.27
|
Most Recent Note - 12/20/2012 5:21:06 PM
Y - Rallied with +92% above average volume but failed to rise above its pivot point cited based on its 9/07/12 high plus 10 cents after highlighted in yellow in the earlier mid-day report. Encountered stubborn resistance in prior months near the $60-61 area. Disciplined investors may watch for a volume-driven gain above its pivot point to trigger a technical buy signal before taking action. Quarterly earnings increases (C criteria) have been strong and well above the +25% guideline. A downturn in FY '07 and '08 earnings (A criteria) has been followed by a strong earnings rebound in recent years. See the latest FSU analysis for more details and a new annotated graph.
>>> The latest Featured Stock Update with an annotated graph appeared on 12/20/2012. Click here.
View all notes |
Alert me of new notes |
CANSLIM.net Company Profile |
SEC |
Zacks Reports |
StockTalk |
News |
Chart |
Request a new note
C
A N
S L
I M
|
VSI
-
NYSE
Vitamin Shoppe Inc
SPECIALTY RETAIL - Specialty Retail, Other
|
$56.10
|
-1.31
-2.28% |
$57.44
|
209,075
85.69% of 50 DAV
50 DAV is 244,000
|
$61.89
-9.36%
|
12/3/2012
|
$59.06
|
PP = $61.99
|
|
MB = $65.09
|
Most Recent Note - 12/26/2012 12:45:50 PM
G - Slumping further below its 50 DMA line today raising more serious concerns while prior lows and its 200 DMA line define the next important support to watch. The $61 area has been a stubborn resistance level in recent months. See the latest FSU analysis for more details and a new annotated graph.
>>> The latest Featured Stock Update with an annotated graph appeared on 12/24/2012. Click here.
View all notes |
Alert me of new notes |
CANSLIM.net Company Profile |
SEC |
Zacks Reports |
StockTalk |
News |
Chart |
Request a new note
C
A N
S L
I M
|
WPI
-
NYSE
Watson Pharmaceuticals
DRUGS - Drugs - Generic
|
$89.49
|
-0.87
-0.96% |
$90.68
|
496,563
64.83% of 50 DAV
50 DAV is 765,900
|
$91.47
-2.16%
|
12/17/2012
|
$87.99
|
PP = $90.49
|
|
MB = $95.01
|
Most Recent Note - 12/21/2012 5:37:26 PM
Y - Gain today with +122% above average volume for a new 52-week high clinched a technical buy signal. No resistance remains due to overhead supply.
>>> The latest Featured Stock Update with an annotated graph appeared on 12/17/2012. Click here.
View all notes |
Alert me of new notes |
CANSLIM.net Company Profile |
SEC |
Zacks Reports |
StockTalk |
News |
Chart |
Request a new note
C
A N
S L
I M
|
|
|
|
THESE ARE NOT BUY RECOMMENDATIONS!
Comments contained in the body of this report are technical
opinions only. The material herein has been obtained
from sources believed to be reliable and accurate, however,
its accuracy and completeness cannot be guaranteed.
This site is not an investment advisor, hence it does
not endorse or recommend any securities or other investments.
Any recommendation contained in this report may not
be suitable for all investors and it is not to be deemed
an offer or solicitation on our part with respect to
the purchase or sale of any securities. All trademarks,
service marks and trade names appearing in this report
are the property of their respective owners, and are
likewise used for identification purposes only.
This report is a service available
only to active Paid Premium Members.
You may opt-out of receiving report notifications
at any time. Questions or comments may be submitted
by writing to Premium Membership Services 665 S.E. 10 Street, Suite 201 Deerfield Beach, FL 33441-5634 or by calling 1-800-965-8307
or 954-785-1121.
|
|
|

