***Last / Change / Volume data in this table is the closing quote data***
Symbol/Exchange
Company Name
Industry Group |
PRICE |
CHANGE
(%Change) |
Day High |
Volume
(% DAV)
(% 50 day avg vol) |
52 Wk Hi
% From Hi |
Featured
Date |
Price
Featured |
Pivot Featured |
|
Max Buy |
ARMH
-
NASDAQ
A R M Holdings Plc Ads
ELECTRONICS - Semiconductor - Specialized
|
$54.28
|
-0.20
-0.37% |
$54.49
|
547,739
30.73% of 50 DAV
50 DAV is 1,782,300
|
$54.82
-0.98%
|
12/23/2013
|
$54.59
|
PP = $52.48
|
|
MB = $55.10
|
Most Recent Note - 12/23/2013 5:56:35 PM
Y - Finished strong today after highlighted in yellow with pivot point cited based on its 10/21/13 high plus 10 cents in the mid-day breakouts report (read here). Hit a new 52-week high with its 5th consecutive gain, and it technically broke out with a volume-driven gain on the prior session. This high-ranked UK-based Electronics - Semiconductor firm reported earnings +39% on +28% sales in the Sep '13 quarter, marking 3 consecutive quarterly comparisons with an earnings increase above the +25% minimum earnings guideline (C criteria). It followed a downturn in FY '09 earnings with strong annual earnings increases (A criteria). The number of top-rated funds owning its shares rose from 206 in Sep '12 to 256 in Sep '13, a reassuring sign concerning the I criteria. It has a large supply of 470 million shares outstanding. See the latest FSU analysis for more details and new annotated daily and weekly graphs.
>>> FEATURED STOCK ARTICLE : No Overhead Supply Remains Following Volume-Driven Breakout - 12/23/2013
View all notes |
Set NEW NOTE alert |
CANSLIM.net Company Profile |
SEC
News |
Chart |
Request a new note
C
A N
S L
I M


|
CELG
-
NASDAQ
Celgene Corp
DRUGS - Drug Manufacturers - Major
|
$167.42
|
-0.93
-0.55% |
$168.34
|
820,152
29.24% of 50 DAV
50 DAV is 2,804,600
|
$173.80
-3.67%
|
9/12/2013
|
$149.50
|
PP = $150.02
|
|
MB = $157.52
|
 Most Recent Note - 12/24/2013 2:48:25 PM
G - Found prompt support near prior highs in the $161 area and its 50 DMA line recently. Subsequent violations would raise greater concerns and trigger technical sell signals.
>>> FEATURED STOCK ARTICLE : Cooling Volume Totals While Hovering Near Highs - 12/4/2013
View all notes |
Set NEW NOTE alert |
CANSLIM.net Company Profile |
SEC
News |
Chart |
Request a new note
C
A N
S L
I M
|
EGOV
-
NASDAQ
N I C Inc
INTERNET - Internet Software and Services
|
$23.98
|
-0.02
-0.08% |
$24.11
|
173,427
58.83% of 50 DAV
50 DAV is 294,800
|
$25.99
-7.73%
|
12/20/2013
|
$24.00
|
PP = $26.09
|
|
MB = $27.39
|
Most Recent Note - 12/24/2013 2:42:48 PM
Y - Holding its ground stubbornly after a volume-driven gain helped it rebound above its 50 DMA line. Subsequent gains above the pivot with sufficient volume may trigger a new (or add-on) technical buy signal.
>>> FEATURED STOCK ARTICLE : Finding Support Near 50-Day Average During Distributional Pressure - 11/25/2013
View all notes |
Set NEW NOTE alert |
CANSLIM.net Company Profile |
SEC
News |
Chart |
Request a new note
C
A N
S L
I M
|
EQM
-
NYSE
E Q T Midstream Partners
ENERGY - Oil and Gas Pipelines
|
$57.86
|
-0.09
-0.16% |
$58.69
|
51,088
37.79% of 50 DAV
50 DAV is 135,200
|
$58.49
-1.08%
|
12/12/2013
|
$53.17
|
PP = $56.51
|
|
MB = $59.34
|
Most Recent Note - 12/23/2013 3:55:19 PM
Y - Gapped up today while rallying to a new 52-week high with today's 4th consecutive gain. A gain above the pivot point backed by at least +40% above average volume is needed to trigger a proper technical buy signal.
>>> FEATURED STOCK ARTICLE : Finding Support Near 50-Day Moving Average While Perched Near Highs - 12/13/2013
View all notes |
Set NEW NOTE alert |
CANSLIM.net Company Profile |
SEC
News |
Chart |
Request a new note
C
A N
S L
I M
|
FB
-
NASDAQ
Facebook Inc Cl A
INTERNET
|
$57.96
|
+0.19
0.33% |
$58.58
|
46,510,088
60.91% of 50 DAV
50 DAV is 76,355,200
|
$58.32
-0.62%
|
12/12/2013
|
$51.40
|
PP = $54.93
|
|
MB = $57.68
|
Most Recent Note - 12/23/2013 1:19:34 PM
G - Rising beyond its "max buy" level today yet without great volume conviction behind its gain, and its color code is changed to green. Formed a 9-week cup shaped base without a handle. Last week it announced an offering of more than 27 Million new shares and a total of nearly 43 Million existing shares are also being offered by certain selling stockholders including Mark Zuckerberg. Such offerings often are a short-term hindrance to price progress.
>>> FEATURED STOCK ARTICLE : Well Known Social Media Firm on Watch List While Still Base Building - 12/12/2013
View all notes |
Set NEW NOTE alert |
CANSLIM.net Company Profile |
SEC
News |
Chart |
Request a new note
C
A N
S L
I M
|
Symbol/Exchange
Company Name
Industry Group |
PRICE |
CHANGE
(%Change) |
Day High |
Volume
(% DAV)
(% 50 day avg vol) |
52 Wk Hi
% From Hi |
Featured
Date |
Price
Featured |
Pivot Featured |
|
Max Buy |
FLT
-
NYSE
Fleetcor Technologies
DIVERSIFIED SERVICES - Business/Management Services
|
$118.09
|
-0.53
-0.45% |
$118.99
|
272,307
33.30% of 50 DAV
50 DAV is 817,800
|
$123.96
-4.74%
|
8/19/2013
|
$99.01
|
PP = $100.97
|
|
MB = $106.02
|
Most Recent Note - 12/24/2013 2:40:55 PM
G - Still consolidating above its 50 DMA line. A subsequent violation of that important near-term support level may trigger a technical sell signal.
>>> FEATURED STOCK ARTICLE : Enduring Distributional Pressure While Extended From Sound Base - 12/17/2013
View all notes |
Set NEW NOTE alert |
CANSLIM.net Company Profile |
SEC
News |
Chart |
Request a new note
C
A N
S L
I M
|
GNRC
-
NYSE
Generac Hldgs Inc
CONSUMER DURABLES - Electronic Equipment
|
$56.13
|
+0.02
0.04% |
$57.05
|
231,548
29.09% of 50 DAV
50 DAV is 795,900
|
$56.39
-0.46%
|
11/26/2013
|
$53.02
|
PP = $52.42
|
|
MB = $55.04
|
Most Recent Note - 12/20/2013 5:34:34 PM
G - Hit another new 52-week high and rose above its "max buy" level with today's considerable gain backed by +44% above average volume, and its color code is changed to green. Prior highs in the $52 area define initial support to watch on pullbacks.
>>> FEATURED STOCK ARTICLE : Following Latest Breakout Prior Highs Define Support - 11/29/2013
View all notes |
Set NEW NOTE alert |
CANSLIM.net Company Profile |
SEC
News |
Chart |
Request a new note
C
A N
S L
I M
|
HLF
-
NYSE
Herbalife Ltd
DRUGS - Nutrition and Weight Management
|
$78.55
|
-2.26
-2.80% |
$80.64
|
1,711,047
63.55% of 50 DAV
50 DAV is 2,692,300
|
$81.75
-3.91%
|
11/22/2013
|
$72.21
|
PP = $75.04
|
|
MB = $78.79
|
Most Recent Note - 12/24/2013 2:39:46 PM
Y - Pulled back from its 52-week high today following 6 consecutive gains, rallying with no resistance due to overhead supply. Color code is changed to yellow after quietly dipping below its "max buy" level.
>>> FEATURED STOCK ARTICLE : Perched Near Highs Following Rebound - 11/22/2013
View all notes |
Set NEW NOTE alert |
CANSLIM.net Company Profile |
SEC
News |
Chart |
Request a new note
C
A N
S L
I M
|
JAZZ
-
NASDAQ
Jazz Pharmaceuticals Plc
DRUGS - Biotechnology
|
$125.00
|
-0.41
-0.33% |
$125.94
|
287,670
38.07% of 50 DAV
50 DAV is 755,600
|
$126.84
-1.45%
|
9/30/2013
|
$93.20
|
PP = $89.10
|
|
MB = $93.56
|
Most Recent Note - 12/20/2013 12:23:16 PM
G - Extended from any sound base, it is off the session's earlier highs after gapping up for a new 52-week high with heavy volume behind its considerable gain. Reported news it will buy Gentium Spa (GENT) for $1 Billion.
>>> FEATURED STOCK ARTICLE : Technically Extended Stock May Be a Dangerous Chase - 12/10/2013
View all notes |
Set NEW NOTE alert |
CANSLIM.net Company Profile |
SEC
News |
Chart |
Request a new note
C
A N
S L
I M
|
KORS
-
NYSE
Michael Kors Hldgs Ltd
RETAIL - Apparel Stores
|
$81.40
|
+0.60
0.74% |
$81.95
|
1,938,481
40.01% of 50 DAV
50 DAV is 4,844,400
|
$84.58
-3.76%
|
8/6/2013
|
$69.66
|
PP = $66.28
|
|
MB = $69.59
|
Most Recent Note - 12/23/2013 12:37:12 PM
G - Retreating from its 52-week high with above average volume behind today's loss. Testing support to watch at its 50 DMA line. Did not form a recent base of sufficient length.
>>> FEATURED STOCK ARTICLE : Consolidation Too Brief To Note New Pivot - 12/6/2013
View all notes |
Set NEW NOTE alert |
CANSLIM.net Company Profile |
SEC
News |
Chart |
Request a new note
C
A N
S L
I M
|
Symbol/Exchange
Company Name
Industry Group |
PRICE |
CHANGE
(%Change) |
Day High |
Volume
(% DAV)
(% 50 day avg vol) |
52 Wk Hi
% From Hi |
Featured
Date |
Price
Featured |
Pivot Featured |
|
Max Buy |
MRLN
-
NASDAQ
Marlin Business Services
DIVERSIFIED SERVICES - Rental and Leasing Services
|
$24.93
|
-0.82
-3.18% |
$25.85
|
28,445
114.24% of 50 DAV
50 DAV is 24,900
|
$28.64
-12.95%
|
12/19/2013
|
$26.69
|
PP = $28.74
|
|
MB = $30.18
|
Most Recent Note - 12/24/2013 2:37:32 PM
G - Slumped below its 50 DMA line raising concerns today and its color code is changed to green. A prompt rebound above the 50 DMA line is needed to help its outlook. Subsequent volume-driven gains above the pivot point are needed to trigger a proper new technical buy signal.
>>> FEATURED STOCK ARTICLE : Finished Weak While Enduring Distributional Pressure - 12/19/2013
View all notes |
Set NEW NOTE alert |
CANSLIM.net Company Profile |
SEC
News |
Chart |
Request a new note
C
A N
S L
I M
|
PCLN
-
NASDAQ
Priceline.Com Inc
INTERNET - Internet Software and Services
|
$1,179.90
|
-7.35
-0.62% |
$1,188.40
|
254,563
42.64% of 50 DAV
50 DAV is 597,000
|
$1,198.75
-1.57%
|
12/18/2013
|
$1,156.20
|
PP = $1,198.85
|
|
MB = $1,258.79
|
Most Recent Note - 12/24/2013 2:44:35 PM
Y - Endured distributional pressure recently at its highs after forming an advanced "3-week tight" base, albeit a riskier "late-stage" set-up. The new pivot point was based on its 11/29/13 high plus 10 cents. Subsequent volume-driven gains above the pivot point may trigger a new (or add-on) technical buy signal. It 50 DMA line defines important support to watch on pullbacks.
>>> FEATURED STOCK ARTICLE : Extended From Any Sound Base Pattern - 12/3/2013
View all notes |
Set NEW NOTE alert |
CANSLIM.net Company Profile |
SEC
News |
Chart |
Request a new note
C
A N
S L
I M
|
SFUN
-
NYSE
Soufun Hldgs Ltd Ads A
INTERNET - Internet Information Providers
|
$83.26
|
+2.61
3.24% |
$83.99
|
699,962
52.31% of 50 DAV
50 DAV is 1,338,100
|
$82.33
1.13%
|
10/17/2013
|
$58.02
|
PP = $53.87
|
|
MB = $56.56
|
Most Recent Note - 12/24/2013 2:45:53 PM
G - Volume was below average behind today's 3rd consecutive gain for new all-time highs. Held its ground stubbornly and wedged higher since noted in prior reports with caution - "It is extended from any sound base pattern yet may produce more climactic gains. Prior highs and its 50 DMA line coincide in the $59 area defining important support to watch."
>>> FEATURED STOCK ARTICLE : Extended From Base Yet May Produce More Climactic Gains - 12/9/2013
View all notes |
Set NEW NOTE alert |
CANSLIM.net Company Profile |
SEC
News |
Chart |
Request a new note
C
A N
S L
I M
|
SILC
-
NASDAQ
Silicom Ltd
COMPUTER HARDWARE - Networking andamp; Communication Dev
|
$44.83
|
+0.15
0.32% |
$45.00
|
11,840
27.92% of 50 DAV
50 DAV is 42,400
|
$46.15
-2.87%
|
12/23/2013
|
$44.62
|
PP = $46.25
|
|
MB = $48.56
|
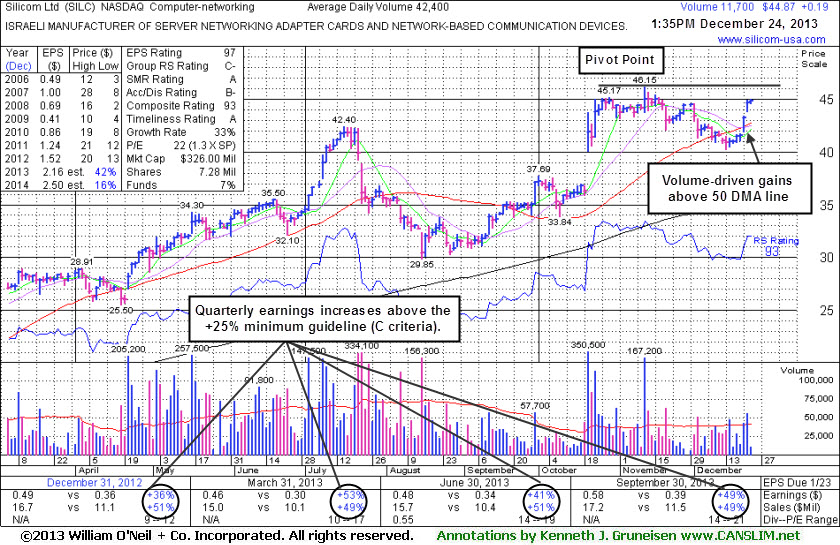
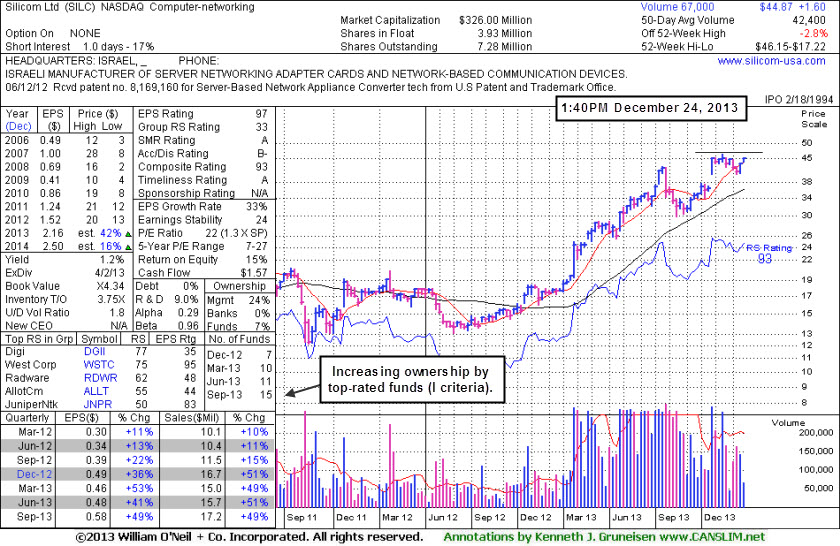
Most Recent Note - 12/24/2013 2:35:00 PM
Y - Approaching its pivot point cited based on its 11/12/13 high plus 10 cents noted in the 12/23/13 mid-day report (read here). This Israeli manufacturer of Computer - Networking devices rallied toward its 52-week high with today's 7th consecutive gain. Little resistance remains due to overhead supply. Subsequent volume-driven gains above the pivot point may trigger a technical buy signal. Its small supply (S criteria) of only 3.93 million shares in the public float can contribute to greater price volatility. See the latest FSU analysis for more details and new annotated daily and weekly graphs.
>>> FEATURED STOCK ARTICLE : Stock With Small Supply Has Formed a Sound Base Pattern - 12/24/2013
View all notes |
Set NEW NOTE alert |
CANSLIM.net Company Profile |
SEC
News |
Chart |
Request a new note
C
A N
S L
I M
|
SSNC
-
NASDAQ
S S & C Technologies
COMPUTER SOFTWARE and SERVICES - Application Software
|
$42.48
|
+0.03
0.07% |
$42.99
|
56,838
18.96% of 50 DAV
50 DAV is 299,700
|
$43.80
-3.01%
|
10/22/2013
|
$39.17
|
PP = $40.04
|
|
MB = $42.04
|
Most Recent Note - 12/23/2013 1:23:30 PM
G - Found prompt support near its 50 DMA line but it has not formed a sound new base. Recent low ($38.85 on 12/13/13) defines important near-term support to watch below its 50 DMA line.
>>> FEATURED STOCK ARTICLE : Found Prompt Support After Damaging Losses Raised Concerns - 12/16/2013
View all notes |
Set NEW NOTE alert |
CANSLIM.net Company Profile |
SEC
News |
Chart |
Request a new note
C
A N
S L
I M
|
Symbol/Exchange
Company Name
Industry Group |
PRICE |
CHANGE
(%Change) |
Day High |
Volume
(% DAV)
(% 50 day avg vol) |
52 Wk Hi
% From Hi |
Featured
Date |
Price
Featured |
Pivot Featured |
|
Max Buy |
SSYS
-
NASDAQ
Stratasys Ltd
COMPUTER HARDWARE - Computer Peripherals
|
$125.92
|
-5.35
-4.08% |
$131.21
|
1,208,786
103.60% of 50 DAV
50 DAV is 1,166,800
|
$134.00
-6.03%
|
10/11/2013
|
$102.94
|
PP = $105.38
|
|
MB = $110.65
|
Most Recent Note - 12/24/2013 11:30:06 AM
G - Pulling back today after challenging its 52-week high with a streak of 5 consecutive gains while rallying from support at its 50 DMA line. Previously noted with caution - "Reported earnings +13% on +153% sales revenues, below the +25% minimum earnings guideline (C criteria) raising fundamental concerns."
>>> FEATURED STOCK ARTICLE : Rallying From Support at 50-Day Moving Average Line - 12/20/2013
View all notes |
Set NEW NOTE alert |
CANSLIM.net Company Profile |
SEC
News |
Chart |
Request a new note
C
A N
S L
I M
|
ULTI
-
NASDAQ
Ultimate Software Group
INTERNET - Internet Software and Services
|
$151.04
|
-0.55
-0.36% |
$152.01
|
89,167
59.68% of 50 DAV
50 DAV is 149,400
|
$162.88
-7.27%
|
10/16/2013
|
$142.95
|
PP = $151.18
|
|
MB = $158.74
|
Most Recent Note - 12/20/2013 5:27:04 PM
G - Rallied near its 50 DMA line today with a volume-driven gain. That short-term average may act as resistance, while a rebound above its 50 DMA line is needed to help its technical stance.
>>> FEATURED STOCK ARTICLE : Consolidating Above 50 DMA Line and Prior Highs Defining Support - 11/21/2013
View all notes |
Set NEW NOTE alert |
CANSLIM.net Company Profile |
SEC
News |
Chart |
Request a new note
C
A N
S L
I M
|
VRX
-
NYSE
Valeant Pharmaceuticals
DRUGS - Drug Manufacturers - Other
|
$113.02
|
+0.40
0.36% |
$113.35
|
380,257
35.34% of 50 DAV
50 DAV is 1,076,000
|
$115.40
-2.06%
|
9/11/2013
|
$100.26
|
PP = $105.50
|
|
MB = $110.78
|
Most Recent Note - 12/23/2013 1:25:21 PM
G - Consolidating above its 50 DMA line and only -3.0% off its 52-week high. Recent lows in the $102 area define near-term support where a violation may trigger a technical sell signal. Resilient after earnings +24% on +74% sales revenues for the Sep '13 quarter came in a notch below the +25% minimum guideline (C criteria).
>>> FEATURED STOCK ARTICLE : Rebounding With Volume Backed Gains But Fundamental Concerns Remain - 12/18/2013
View all notes |
Set NEW NOTE alert |
CANSLIM.net Company Profile |
SEC
News |
Chart |
Request a new note
C
A N
S L
I M
|
YNDX
-
NASDAQ
Yandex N V Class A
INTERNET - Internet Information Providers
|
$41.88
|
+0.03
0.07% |
$42.50
|
1,027,789
39.39% of 50 DAV
50 DAV is 2,609,300
|
$42.94
-2.47%
|
11/27/2013
|
$39.61
|
PP = $42.10
|
|
MB = $44.21
|
Most Recent Note - 12/23/2013 1:09:43 PM
Y - Color code is changed to yellow while rallying above the previously cited pivot point and hitting a new 52-week high with today's 8th consecutive gain. Found prompt support at its 50 DMA line recently. At least +40% above average volume should be behind gains above the pivot point to trigger a proper new technical buy signal.
>>> FEATURED STOCK ARTICLE : Forming New Base Pattern With Little Resistance Remaining - 11/27/2013
View all notes |
Set NEW NOTE alert |
CANSLIM.net Company Profile |
SEC
News |
Chart |
Request a new note
C
A N
S L
I M
|