You are not logged in.
This means you
CAN ONLY VIEW reports that were published prior to Monday, April 14, 2025.
You
MUST UPGRADE YOUR MEMBERSHIP if you want to see any current reports.
AFTER MARKET UPDATE - TUESDAY, DECEMBER 23RD, 2014
Previous After Market Report Next After Market Report >>>
|
|
|
|
DOW |
+64.73 |
18,024.17 |
+0.36% |
|
Volume |
677,274,570 |
-12% |
|
Volume |
1,477,144,800 |
-6% |
|
NASDAQ |
-16.00 |
4,765.42 |
-0.33% |
|
Advancers |
2,018 |
63% |
|
Advancers |
1,401 |
49% |
|
S&P 500 |
+3.63 |
2,082.17 |
+0.17% |
|
Decliners |
1,096 |
34% |
|
Decliners |
1,395 |
48% |
|
Russell 2000 |
+0.58 |
1,202.44 |
+0.05% |
|
52 Wk Highs |
297 |
|
|
52 Wk Highs |
171 |
|
|
S&P 600 |
+2.86 |
693.59 |
+0.41% |
|
52 Wk Lows |
24 |
|
|
52 Wk Lows |
53 |
|
|
 |
Dow & S&P 500 Index Both Hit New Record Highs
Kenneth J. Gruneisen - Passed the CAN SLIM® Master's Exam
Stocks were mostly higher on Tuesday’s session. The Dow gained 65 points to close above 18,000 for the first time at a record level of 18,024. The S&P 500 rose 4 points to an all-time high of 2,082. The NASDAQ fell 16 points to 4,765 as biotech weighed on the index. Advancers led decliners by almost a 2-1 margin on the NYSE while the mix was nearly even on the Nasdaq exchange. The volume was reported lighter on the NYSE and on the Nasdaq exchange, down from Monday's totals. There were 120 high-ranked companies from the CANSLIM.net Leaders List that made new 52-week highs and appeared on the CANSLIM.net BreakOuts Page, up from the prior session total of 78 stocks. New 52-week highs expanded and outnumbered new 52-week lows on the NYSE and on the Nasdaq exchange. There gains for 4 of the 10 high-ranked companies currently on the Featured Stocks Page, a list that has recently been getting trimmed.
New highs for the Dow Jones Industrial Average and S&P 500 Index, coupled with more leadership, signaled that the market (M criteria) is back in a confirmed uptrend. Remember that new buying efforts should only be made in stocks meeting all fundamental and technical guidelines of the fact-based investment system.
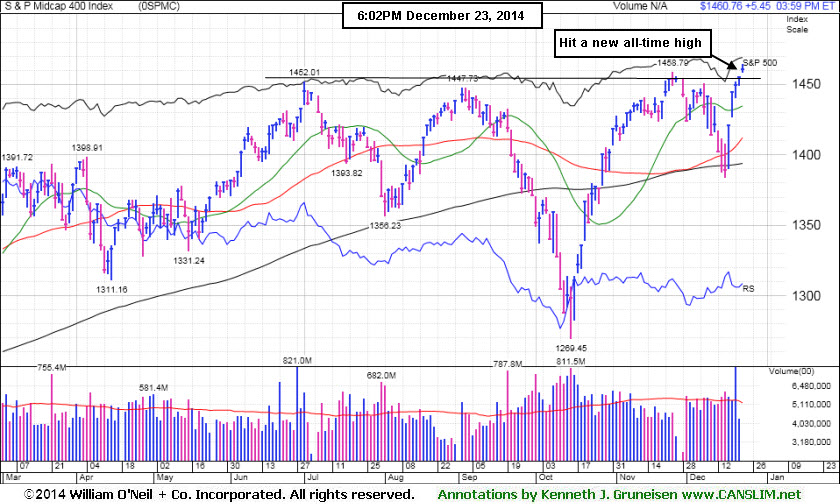
PICTURED: The S&P Mid-Cap 400 Index hit a new all-time high.
U.S. equities advanced following a positive revision to third-quarter GDP. The Commerce Department reported the economy grew at a 5% annualized rate for the period, up from its previous estimate of 3.9%. Updates on the consumer also provided a tailwind as personal spending increased +0.6% in November while sentiment remained at an eight-year high in December. Additional reports showed durable goods orders unexpectedly fell -0.7% and new home sales declined -1.6% last month.
Energy was the best performing sector on the session. Exxon (XOM +1.4%) rose as oil stemmed its recent slide. Chesapeake Energy (CHK +10.2%) rose after announcing a $1 billion share buyback. Walgreens (WAG +3%) rose as earnings beat estimates. Health care was the lone sector down, led lower by Celgene (CELG -6.5%).
Treasuries fell as the better-than-expected GDP report raised speculation for the Fed to raise interest rates. The latest $35 billion 5-year note auction drew below average demand. The benchmark 10-year decreased 29/32 to yield 2.26%. In commodities, NYMEX WTI crude gained +3.6% to $57.26/barrel. COMEX gold slipped -0.4% to $1,175.00/ounce.
Disciplined investors know that new buying efforts should only be made in stocks when all fundamental and technical guidelines are met. This should be done as the stock is breaking out of a sound base pattern. Historic studies have shown that odds are not as favorable for investors when buying stocks on pullbacks.
The Featured Stocks Page shows recent notes and Headline Links directing members to detailed analysis with data-packed graphs annotated by a Certified expert. See the Premium Member Homepage for archives to all prior pay reports published.
|
 Kenneth J. Gruneisen started out as a licensed stockbroker in August 1987, a couple of months prior to the historic stock market crash that took the Dow Jones Industrial Average down -22.6% in a single day. He has published daily fact-based fundamental and technical analysis on high-ranked stocks online for two decades. Through FACTBASEDINVESTING.COM, Kenneth provides educational articles, news, market commentary, and other information regarding proven investment systems that work in good times and bad.
Comments contained in the body of this report are technical opinions only and are not necessarily those of Gruneisen Growth Corp. The material herein has been obtained from sources believed to be reliable and accurate, however, its accuracy and completeness cannot be guaranteed. Our firm, employees, and customers may effect transactions, including transactions contrary to any recommendation herein, or have positions in the securities mentioned herein or options with respect thereto. Any recommendation contained in this report may not be suitable for all investors and it is not to be deemed an offer or solicitation on our part with respect to the purchase or sale of any securities. |
|
 |
Financial, Energy, and Retail Groups Rose
Kenneth J. Gruneisen - Passed the CAN SLIM® Master's Exam
Financial shares helped the major averages on Tuesday as the Bank Index ($BKX +1.08%) and the Broker/Dealer Index ($XBD +1.19%) both rose more than +1%. The Retail Index ($RLX +0.44%) also was a positive influence and gains from energy-related shares gave the Integrated Oil Index ($XOI +1.37%) and the Oil Services Index ($OSX +0.49%) a boost. Meanwhile, the Biotechnology Index ($BTK -4.37%) led the tech sector's retreat and the Semiconductor Index ($SOX -0.20%) and Networking Index ($NWX -0.12%) both edged lower. The Gold & Silver Index ($XAU -0.83%) also ended lower.
Charts courtesy www.stockcharts.com
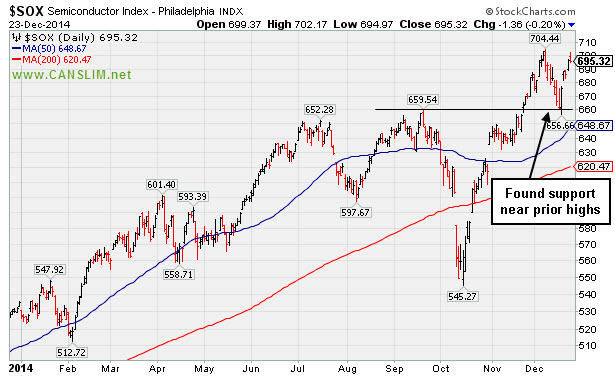
PICTURED: The Semiconductor Index ($SOX -0.20%) found support near prior highs during its recent consolidation.
| Oil Services |
$OSX |
214.89 |
+1.04 |
+0.49% |
-23.53% |
| Integrated Oil |
$XOI |
1,376.51 |
+18.60 |
+1.37% |
-8.42% |
| Semiconductor |
$SOX |
695.32 |
-1.36 |
-0.20% |
+29.96% |
| Networking |
$NWX |
363.10 |
-0.45 |
-0.12% |
+12.09% |
| Broker/Dealer |
$XBD |
186.97 |
+2.19 |
+1.19% |
+16.45% |
| Retail |
$RLX |
1,025.47 |
+4.53 |
+0.44% |
+9.12% |
| Gold & Silver |
$XAU |
64.82 |
-0.54 |
-0.83% |
-22.97% |
| Bank |
$BKX |
74.95 |
+0.80 |
+1.08% |
+8.22% |
| Biotech |
$BTK |
3,352.07 |
-153.04 |
-4.37% |
+43.84% |
|
|
|
 |
Recent Streak of Gains Lacked Volume Conviction
Kenneth J. Gruneisen - Passed the CAN SLIM® Master's Exam
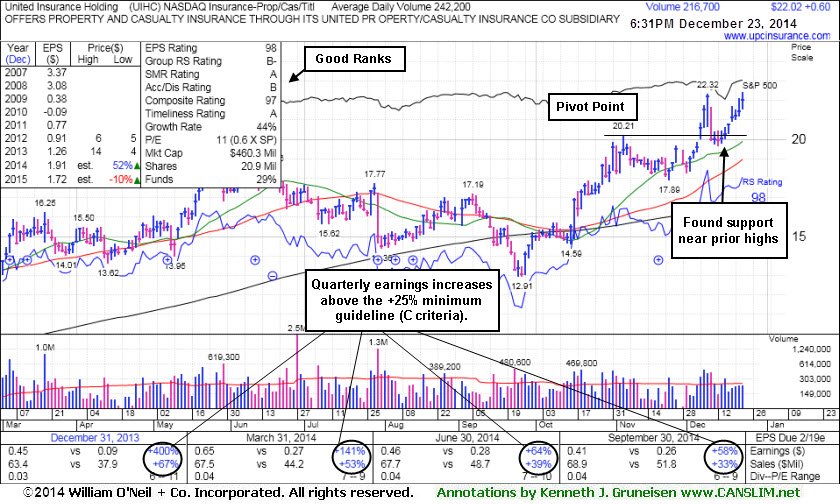
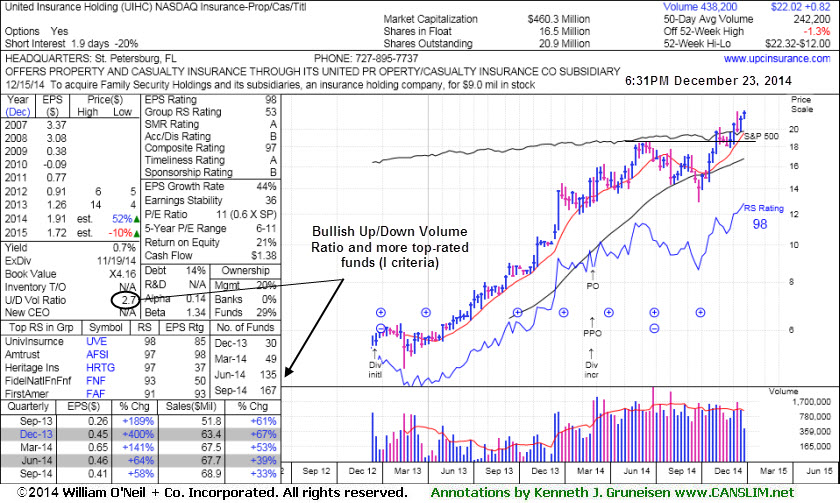
United Insurance Holding (UIHC +$0.60 or +2.80% to $22.02) rose above its "max buy" level as it posted a 6th consecutive gain and its color code was changed to green. Disciplined investors avoid chasing stocks more than +5% above prior highs and always limit losses by selling any stock that falls more than -7% from its purchase price.
UIHC found support near prior highs in the $20 area during its consolidation since last shown in this FSU section on 12/05/14 with annotated graphs under the headline, "Technical Breakout Indicative of Institutional Demand". It was highlighted in yellow with pivot point cited based on its 11/05/14 high plus 10 cents in the 12/05/14 mid-day report (read here). Heavy volume behind gains for new highs was considered a sign of meaningful institutional buying demand. Recent gains lacked great volume conviction.
It reported earnings +58% on +33% sales revenues for the Sep '14 quarter, its 5th consecutive quarterly comparison above the +25% minimum guideline (C criteria). Annual earnings (A criteria) have been strong. It completed a new Public Offering on 2/27/14. The number of top-rated funds owning its shares rose from 30 in Dec '13 to 167 in Sep '14, and its current Up/Down Volume Ratio of 2.7 is also a reassuring sign is shares have been under accumulation over the past 50 days.
|
|
|
Color Codes Explained :
Y - Better candidates highlighted by our
staff of experts.
G - Previously featured
in past reports as yellow but may no longer be buyable under the
guidelines.
***Last / Change / Volume data in this table is the closing quote data***
Symbol/Exchange
Company Name
Industry Group |
PRICE |
CHANGE
(%Change) |
Day High |
Volume
(% DAV)
(% 50 day avg vol) |
52 Wk Hi
% From Hi |
Featured
Date |
Price
Featured |
Pivot Featured |
|
Max Buy |
ACT
-
NYSE
Actavis plc
Medical-Generic Drugs
|
$255.88
|
-5.78
-2.21% |
$263.20
|
2,616,799
81.27% of 50 DAV
50 DAV is 3,220,000
|
$272.75
-6.19%
|
6/20/2014
|
$216.53
|
PP = $230.87
|
|
MB = $242.41
|
Most Recent Note - 12/22/2014 6:07:58 PM
G - Pulled back on lighter volume today following 3 consecutive gains on higher volume. Extended from prior highs in the $249 area defining near-term support.
>>> FEATURED STOCK ARTICLE : Consolidating After Rally on Acquisition Plans - 12/12/2014
View all notes |
Set NEW NOTE alert |
CANSLIM.net Company Profile |
SEC
News |
Chart |
Request a new note
C
A N
S L
I M


|
AFSI
-
NASDAQ
Amtrust Financial Svcs
INSURANCE - Property and; Casualty Insurance
|
$54.26
|
+0.36
0.67% |
$54.47
|
619,670
56.28% of 50 DAV
50 DAV is 1,101,000
|
$59.31
-8.51%
|
10/17/2014
|
$45.24
|
PP = $46.02
|
|
MB = $48.32
|
Most Recent Note - 12/22/2014 12:50:16 PM
G - Retreating for a 3rd consecutive loss with ever-increasing volume. Extended from any sound base. Prior highs in the $53 area define initial support above its 50 DMA line ($51.22).
>>> FEATURED STOCK ARTICLE : Extended From Sound Base Pattern Identified Earlier - 12/10/2014
View all notes |
Set NEW NOTE alert |
CANSLIM.net Company Profile |
SEC
News |
Chart |
Request a new note
C
A N
S L
I M
|
ALXN
-
NASDAQ
Alexion Pharmaceuticals
DRUGS - Drug Manufacturers - Other
|
$178.87
|
-9.28
-4.93% |
$189.89
|
2,353,981
206.13% of 50 DAV
50 DAV is 1,142,000
|
$203.30
-12.02%
|
10/23/2014
|
$184.01
|
PP = $185.53
|
|
MB = $194.81
|
 Most Recent Note - 12/23/2014 12:13:53 PM
G - Slumping back below its 50 DMA line today. The recent low ($176.01 on 12/17/14) defines the next important support level. It faces resistance due to overhead supply up through $203. Disciplined investors limit losses by selling if any stock falls more than -7% from their purchase price.
>>> FEATURED STOCK ARTICLE : Recent 50-Day Moving Average Violation Triggered Sell Signal - 12/17/2014
View all notes |
Set NEW NOTE alert |
CANSLIM.net Company Profile |
SEC
News |
Chart |
Request a new note
C
A N
S L
I M
|
BIDU
-
NASDAQ
Baidu Inc Ads
INTERNET - Internet Information Providers
|
$233.16
|
-1.44
-0.61% |
$236.78
|
1,686,431
47.35% of 50 DAV
50 DAV is 3,562,000
|
$251.99
-7.47%
|
10/30/2014
|
$234.08
|
PP = $231.51
|
|
MB = $243.09
|
Most Recent Note - 12/23/2014 7:02:49 PM
Y - Color code is changed to yellow while quietly consolidating. Recent lows in the $217-218 area define important near-term support following its quiet rebound above its 50 DMA line.
>>> FEATURED STOCK ARTICLE : Rebound Above 50-Day Moving Average Helped Technical Stance - 12/19/2014
View all notes |
Set NEW NOTE alert |
CANSLIM.net Company Profile |
SEC
News |
Chart |
Request a new note
C
A N
S L
I M
|
EPAM
-
NYSE
Epam Systems Inc
COMPUTER SOFTWARE and SERVICES - Information Technology Service
|
$48.51
|
+0.40
0.83% |
$48.97
|
279,682
61.88% of 50 DAV
50 DAV is 452,000
|
$52.89
-8.28%
|
10/23/2014
|
$45.21
|
PP = $46.09
|
|
MB = $48.39
|
Most Recent Note - 12/22/2014 6:10:59 PM
G - Consolidating just above its 50 DMA line. Prior highs in the $46 area acted as support last week. Subsequent losses below recent lows would raise concerns and trigger a more worrisome technical sell signal.
>>> FEATURED STOCK ARTICLE : Violated 50-Day Moving Average Triggering Technical Sell Signal - 12/16/2014
View all notes |
Set NEW NOTE alert |
CANSLIM.net Company Profile |
SEC
News |
Chart |
Request a new note
C
A N
S L
I M
|
Symbol/Exchange
Company Name
Industry Group |
PRICE |
CHANGE
(%Change) |
Day High |
Volume
(% DAV)
(% 50 day avg vol) |
52 Wk Hi
% From Hi |
Featured
Date |
Price
Featured |
Pivot Featured |
|
Max Buy |
FB
-
NASDAQ
Facebook Inc Cl A
INTERNET
|
$80.61
|
-0.84
-1.03% |
$82.17
|
19,854,964
57.09% of 50 DAV
50 DAV is 34,780,000
|
$81.89
-1.56%
|
12/22/2014
|
$81.79
|
PP = $81.26
|
|
MB = $85.32
|
Most Recent Note - 12/22/2014 6:04:56 PM
Y - A new pivot point was cited based on its 10/28/14 high plus 10 cents. It hit a new high with today's 4th consecutive gain and no resistance remains due to overhead supply. Volume-driven gains are needed to clinch a proper technical buy signal. See the latest FSU analysis for more details and new annotated graphs.
>>> FEATURED STOCK ARTICLE : Gains for New Highs Backed By Lighter Volume - 12/22/2014
View all notes |
Set NEW NOTE alert |
CANSLIM.net Company Profile |
SEC
News |
Chart |
Request a new note
C
A N
S L
I M
|
ILMN
-
NASDAQ
Illumina Inc
DRUGS - Biotechnology
|
$183.50
|
-5.93
-3.13% |
$189.99
|
1,064,095
85.61% of 50 DAV
50 DAV is 1,243,000
|
$197.37
-7.03%
|
10/22/2014
|
$188.77
|
PP = $182.27
|
|
MB = $191.38
|
Most Recent Note - 12/23/2014 6:54:59 PM
G - Ended below its 50 DMA line ($184.61) and near the session low with today's loss on below average volume. Only a prompt rebound above the 50 DMA line would help its outlook improve. Meanwhile it faces some resistance due to overhead supply up through $197.
>>> FEATURED STOCK ARTICLE : Violation of 50-Day Average Triggered Technical Sell Signal - 12/15/2014
View all notes |
Set NEW NOTE alert |
CANSLIM.net Company Profile |
SEC
News |
Chart |
Request a new note
C
A N
S L
I M
|
PANW
-
NYSE
Palo Alto Networks
Computer Sftwr-Security
|
$125.22
|
-0.50
-0.40% |
$126.90
|
847,212
48.36% of 50 DAV
50 DAV is 1,752,000
|
$128.00
-2.17%
|
7/30/2014
|
$84.21
|
PP = $85.88
|
|
MB = $90.17
|
Most Recent Note - 12/23/2014 6:59:08 PM
G - Pulled back today on lighter volume following 4 consecutive gains. It has not formed a sound base. The 50 DMA line defines near-term support to watch below recent lows.
>>> FEATURED STOCK ARTICLE : Latest Consolidation Was Not a Base of Sufficient Length - 12/18/2014
View all notes |
Set NEW NOTE alert |
CANSLIM.net Company Profile |
SEC
News |
Chart |
Request a new note
C
A N
S L
I M
|
RH
-
NYSE
Restoration Hardware Hld
RETAIL - Home Furnishing Stores
|
$97.13
|
+1.18
1.23% |
$98.22
|
567,453
57.84% of 50 DAV
50 DAV is 981,000
|
$100.66
-3.51%
|
12/11/2014
|
$98.66
|
PP = $94.60
|
|
MB = $99.33
|
Most Recent Note - 12/23/2014 7:01:03 PM
Y - Color code is changed to yellow while quietly consolidating below its "max buy" level. Subsequent losses leading to a close below its old high close ($93.05 on 6/30/14) would completely negate the recent breakout and raise concerns.
>>> FEATURED STOCK ARTICLE : Close in Lower Third of Intra-day Range Indicates Disributional Pressure - 12/11/2014
View all notes |
Set NEW NOTE alert |
CANSLIM.net Company Profile |
SEC
News |
Chart |
Request a new note
C
A N
S L
I M
|
UIHC
-
NASDAQ
United Insurance Holding
Insurance-Prop/Cas/Titl
|
$22.02
|
+0.60
2.80% |
$22.41
|
216,752
89.57% of 50 DAV
50 DAV is 242,000
|
$22.32
-1.34%
|
12/5/2014
|
$20.64
|
PP = $20.31
|
|
MB = $21.33
|
Most Recent Note - 12/23/2014 6:52:10 PM
G - Rose further above its "max buy" level as it posted a 7th consecutive gain. Disciplined investors avoid chasing stocks more than +5% above prior highs and always limit losses by selling any stock that falls more than -7% from its purchase price. See the latest FSU analysis for more details and new annotated graphs.
>>> FEATURED STOCK ARTICLE : Recent Streak of Gains Lacked Volume Conviction - 12/23/2014
View all notes |
Set NEW NOTE alert |
CANSLIM.net Company Profile |
SEC
News |
Chart |
Request a new note
C
A N
S L
I M
|
Symbol/Exchange
Company Name
Industry Group |
PRICE |
CHANGE
(%Change) |
Day High |
Volume
(% DAV)
(% 50 day avg vol) |
52 Wk Hi
% From Hi |
Featured
Date |
Price
Featured |
Pivot Featured |
|
Max Buy |
|
|
|
THESE ARE NOT BUY RECOMMENDATIONS!
Comments contained in the body of this report are technical
opinions only. The material herein has been obtained
from sources believed to be reliable and accurate, however,
its accuracy and completeness cannot be guaranteed.
This site is not an investment advisor, hence it does
not endorse or recommend any securities or other investments.
Any recommendation contained in this report may not
be suitable for all investors and it is not to be deemed
an offer or solicitation on our part with respect to
the purchase or sale of any securities. All trademarks,
service marks and trade names appearing in this report
are the property of their respective owners, and are
likewise used for identification purposes only.
This report is a service available
only to active Paid Premium Members.
You may opt-out of receiving report notifications
at any time. Questions or comments may be submitted
by writing to Premium Membership Services 665 S.E. 10 Street, Suite 201 Deerfield Beach, FL 33441-5634 or by calling 1-800-965-8307
or 954-785-1121.
|
|
|

