You are not logged in.
This means you
CAN ONLY VIEW reports that were published prior to Monday, April 14, 2025.
You
MUST UPGRADE YOUR MEMBERSHIP if you want to see any current reports.
AFTER MARKET UPDATE - MONDAY, DECEMBER 23RD, 2013
Previous After Market Report Next After Market Report >>>
|
|
|
|
DOW |
+73.47 |
16,294.61 |
+0.45% |
|
Volume |
598,198,640 |
-69% |
|
Volume |
1,662,930,590 |
-42% |
|
NASDAQ |
+44.16 |
4,148.90 |
+1.08% |
|
Advancers |
2,184 |
69% |
|
Advancers |
1,904 |
71% |
|
S&P 500 |
+9.67 |
1,827.99 |
+0.53% |
|
Decliners |
891 |
28% |
|
Decliners |
722 |
27% |
|
Russell 2000 |
+10.75 |
1,157.22 |
+0.94% |
|
52 Wk Highs |
340 |
|
|
52 Wk Highs |
329 |
|
|
S&P 600 |
+5.56 |
662.97 |
+0.85% |
|
52 Wk Lows |
36 |
|
|
52 Wk Lows |
19 |
|
|
 |
Major Averages Rose With Lighter Volume Into New High Territory
Kenneth J. Gruneisen - Passed the CAN SLIM® Master's Exam
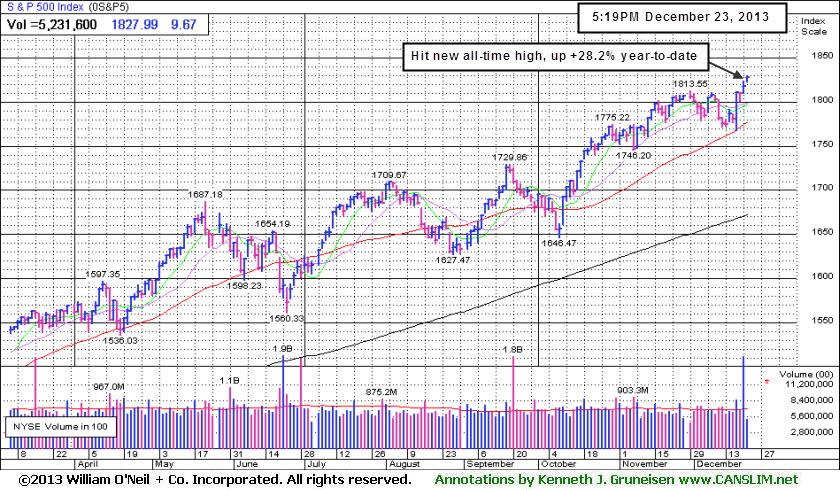
On Monday's session the Dow climbed 73 points to an all-time high of 16,294. The S&P 500 gained 10 points to a new record at 1,827. The NASDAQ advanced to its best level in 13 years, adding 44 points to close at 4,148. The volume totals were much lighter on the NYSE and on the Nasdaq exchange, down from Friday's high totals which were inflated by options expirations. Breadth was positive as advancers led decliners by more than 2-1 on the NYSE and on the Nasdaq exchange. There were 135 high-ranked companies from the CANSLIM.net Leaders List that made new 52-week highs and appeared on the CANSLIM.net BreakOuts Page, up from a total of 108 stocks on the prior session. The list of stocks hitting new 52-week highs expanded and easily outnumbered new lows on the Nasdaq exchange and on the NYSE. There were gains for 15 of the 19 high-ranked companies currently included on the Featured Stocks Page.
The major averages finished firmly in positive territory amid optimism on the economy. Over the weekend, the International Monetary Fund said it would raise its U.S. growth forecast for next year citing the recent budget deal in Washington and the Fed’s decision to taper its asset purchases. The market’s gain was also attributed to reports that showed personal spending rose in November to a five month high and consumer confidence increased in December.
Eight of 10 sectors were up on Monday's session. Technology and telecom were the best performing groups. Shares of Apple Inc (AAPL +3.84%) rose after reaching a deal to sell its iPhone through China Mobile Ltd (CHL +1.63%). Facebook Inc (FB +4.81%) on its first trading day as a member of the S&P 500. Telecom also paced the market higher with Verizon Communications Inc (VZ +1.04%) rising. Utilities and consumer staples were the worst performing sectors as Edison International (EIX -0.94%) and Hershey Co (HSY -0.77%) edged lower.
Treasuries declined with the 10-year note down 10/32 to yield 2.93%.
The Market (M criteria) rally has continued producing sufficient leadership (stocks hitting new highs) and the ongoing uptrend remains intact. New buying efforts should always be selective. The CANSLIM.net Featured Stocks Page shows the most action-worthy candidates and their latest notes and a Headline Link directs members to the latest detailed analysis with data-packed graphs annotated by a Certified expert along with links to additional resources. The Premium Member Homepage includes "dynamic archives" to all prior pay reports published. Watch for an announcement via email concerning the next WEBCAST.
PICTURED: The S&P 500 Index rallied to a new 2013 high, up +28.2% year-to-date.
|
 Kenneth J. Gruneisen started out as a licensed stockbroker in August 1987, a couple of months prior to the historic stock market crash that took the Dow Jones Industrial Average down -22.6% in a single day. He has published daily fact-based fundamental and technical analysis on high-ranked stocks online for two decades. Through FACTBASEDINVESTING.COM, Kenneth provides educational articles, news, market commentary, and other information regarding proven investment systems that work in good times and bad.
Comments contained in the body of this report are technical opinions only and are not necessarily those of Gruneisen Growth Corp. The material herein has been obtained from sources believed to be reliable and accurate, however, its accuracy and completeness cannot be guaranteed. Our firm, employees, and customers may effect transactions, including transactions contrary to any recommendation herein, or have positions in the securities mentioned herein or options with respect thereto. Any recommendation contained in this report may not be suitable for all investors and it is not to be deemed an offer or solicitation on our part with respect to the purchase or sale of any securities. |
|
 |
Financial, Tech, and Retail Groups Underpinned Rally
Kenneth J. Gruneisen - Passed the CAN SLIM® Master's Exam
Financial shares were a positive influence on the major averages as the Bank Index ($BKX +0.89%) and the Broker/Dealer Index ($XBD +0.94%) posted gains. The Retail Index ($RLX +0.42%) also had a positive bias and the tech sector saw unanimous gains from the Networking Index ($NWX +0.58%), Semiconductor Index ($SOX +0.87%), and the Biotechnology Index ($BTK +2.33%) Energy-related shares were mixed as the Oil Services Index ($OSX -0.53%) edged higher and the Integrated Oil Index ($XOI +0.32%) finished with a small loss. The Gold & Silver Index ($XAU +0.07%) finished flat.
Charts courtesy www.stockcharts.com
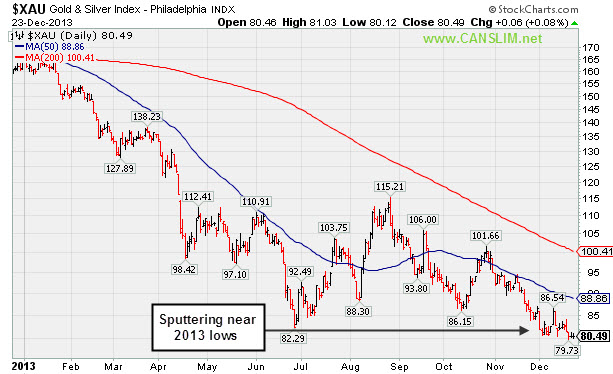
PICTURED: The Gold & Silver Index ($XAU +0.07%) finished flat. This defensive "safe haven" group is sputtering near 2013 lows and has clearly been underperforming growth-oriented groups.
| Oil Services |
$OSX |
274.74 |
-1.47 |
-0.53% |
+24.79% |
| Integrated Oil |
$XOI |
1,470.06 |
+4.65 |
+0.32% |
+18.38% |
| Semiconductor |
$SOX |
526.65 |
+4.56 |
+0.87% |
+37.13% |
| Networking |
$NWX |
315.52 |
+1.83 |
+0.58% |
+39.27% |
| Broker/Dealer |
$XBD |
159.29 |
+1.49 |
+0.94% |
+68.86% |
| Retail |
$RLX |
935.84 |
+3.96 |
+0.42% |
+43.30% |
| Gold & Silver |
$XAU |
80.49 |
+0.06 |
+0.07% |
-51.39% |
| Bank |
$BKX |
68.96 |
+0.61 |
+0.89% |
+34.48% |
| Biotech |
$BTK |
2,341.77 |
+53.22 |
+2.33% |
+51.37% |
|
|
|
 |
No Overhead Supply Remains Following Volume-Driven Breakout
Kenneth J. Gruneisen - Passed the CAN SLIM® Master's Exam
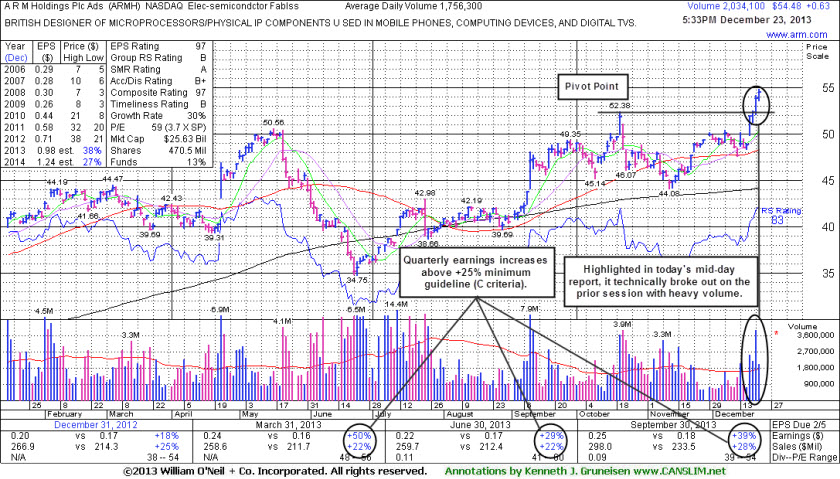
A R M Holdings Plc Ads (ARMH +$0.63 or +1.17% to $54.48) was highlighted in yellow in the earlier mid-day report (read here) with pivot point cited based on its 10/21/13 high plus 10 cents. It hit a new 52-week high with above average volume behind today's 5th consecutive gain. Technically, it broke out with a volume-driven gain on the prior session. Disciplined investors avoid chasing stocks extended more than +5% above their prior high or pivot point, and they always limit losses be selling if any stock falls more than -7% from their purchase price.
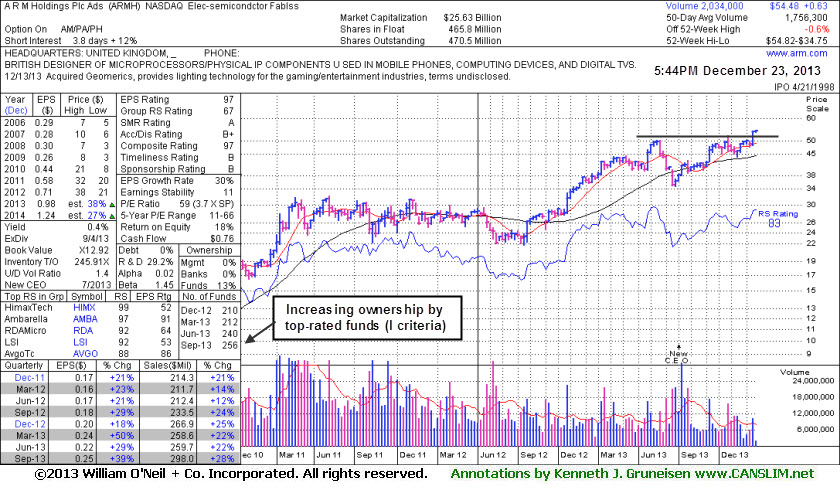
This high-ranked UK-based Electronics - Semiconductor firm reported earnings +39% on +28% sales in the Sep '13 quarter, marking 3 consecutive quarterly comparisons with an earnings increase above the +25% minimum earnings guideline (C criteria). It followed a downturn in FY '09 earnings with strong annual earnings increases (A criteria). It has a large supply of 470 million shares outstanding, however the number of top-rated funds owning its shares rose from 206 in Sep '12 to 256 in Sep '13, a reassuring sign concerning the I criteria.
|
|
|
Color Codes Explained :
Y - Better candidates highlighted by our
staff of experts.
G - Previously featured
in past reports as yellow but may no longer be buyable under the
guidelines.
***Last / Change / Volume data in this table is the closing quote data***
Symbol/Exchange
Company Name
Industry Group |
PRICE |
CHANGE
(%Change) |
Day High |
Volume
(% DAV)
(% 50 day avg vol) |
52 Wk Hi
% From Hi |
Featured
Date |
Price
Featured |
Pivot Featured |
|
Max Buy |
ARMH
-
NASDAQ
A R M Holdings Plc Ads
ELECTRONICS - Semiconductor - Specialized
|
$54.48
|
+0.63
1.17% |
$54.82
|
2,036,293
115.94% of 50 DAV
50 DAV is 1,756,300
|
$54.10
0.70%
|
12/23/2013
|
$54.59
|
PP = $52.48
|
|
MB = $55.10
|
 Most Recent Note - 12/23/2013 5:56:35 PM
Y - Finished strong today after highlighted in yellow with pivot point cited based on its 10/21/13 high plus 10 cents in the mid-day breakouts report (read here). Hit a new 52-week high with its 5th consecutive gain, and it technically broke out with a volume-driven gain on the prior session. This high-ranked UK-based Electronics - Semiconductor firm reported earnings +39% on +28% sales in the Sep '13 quarter, marking 3 consecutive quarterly comparisons with an earnings increase above the +25% minimum earnings guideline (C criteria). It followed a downturn in FY '09 earnings with strong annual earnings increases (A criteria). The number of top-rated funds owning its shares rose from 206 in Sep '12 to 256 in Sep '13, a reassuring sign concerning the I criteria. It has a large supply of 470 million shares outstanding. See the latest FSU analysis for more details and new annotated daily and weekly graphs.
>>> FEATURED STOCK ARTICLE : No Overhead Supply Remains Following Volume-Driven Breakout - 12/23/2013
View all notes |
Set NEW NOTE alert |
CANSLIM.net Company Profile |
SEC
News |
Chart |
Request a new note
C
A N
S L
I M


|
CELG
-
NASDAQ
Celgene Corp
DRUGS - Drug Manufacturers - Major
|
$168.35
|
+0.87
0.52% |
$169.70
|
1,748,042
62.19% of 50 DAV
50 DAV is 2,810,700
|
$173.80
-3.14%
|
9/12/2013
|
$149.50
|
PP = $150.02
|
|
MB = $157.52
|
Most Recent Note - 12/18/2013 1:48:58 PM
G - Undercutting prior highs in the $161 area while slumping near its 50 DMA line ($157.11 now) as it retreats from all-time highs with today's 6th consecutive loss. More damaging losses violating the 50 DMA line would raise greater concerns.
>>> FEATURED STOCK ARTICLE : Cooling Volume Totals While Hovering Near Highs - 12/4/2013
View all notes |
Set NEW NOTE alert |
CANSLIM.net Company Profile |
SEC
News |
Chart |
Request a new note
C
A N
S L
I M
|
EGOV
-
NASDAQ
N I C Inc
INTERNET - Internet Software and Services
|
$24.00
|
+0.00
0.00% |
$24.19
|
307,561
105.11% of 50 DAV
50 DAV is 292,600
|
$25.99
-7.66%
|
12/20/2013
|
$24.00
|
PP = $26.09
|
|
MB = $27.39
|
Most Recent Note - 12/20/2013 5:31:04 PM
Y - Volume-driven gain today helped it rebound above its 50 DMA line improving its technical stance. Color code is changed to yellow with new pivot point cited based on its 10/21/13 high plus 10 cents. Subsequent gains above the pivot with sufficient volume may trigger a new (or add-on) technical buy signal.
>>> FEATURED STOCK ARTICLE : Finding Support Near 50-Day Average During Distributional Pressure - 11/25/2013
View all notes |
Set NEW NOTE alert |
CANSLIM.net Company Profile |
SEC
News |
Chart |
Request a new note
C
A N
S L
I M
|
EQM
-
NYSE
E Q T Midstream Partners
ENERGY - Oil and Gas Pipelines
|
$57.95
|
+1.95
3.48% |
$58.49
|
176,541
133.14% of 50 DAV
50 DAV is 132,600
|
$56.41
2.73%
|
12/12/2013
|
$53.17
|
PP = $56.51
|
|
MB = $59.34
|
Most Recent Note - 12/23/2013 3:55:19 PM
Y - Gapped up today while rallying to a new 52-week high with today's 4th consecutive gain. A gain above the pivot point backed by at least +40% above average volume is needed to trigger a proper technical buy signal.
>>> FEATURED STOCK ARTICLE : Finding Support Near 50-Day Moving Average While Perched Near Highs - 12/13/2013
View all notes |
Set NEW NOTE alert |
CANSLIM.net Company Profile |
SEC
News |
Chart |
Request a new note
C
A N
S L
I M
|
FB
-
NASDAQ
Facebook Inc Cl A
INTERNET
|
$57.77
|
+2.65
4.81% |
$58.32
|
98,138,914
129.89% of 50 DAV
50 DAV is 75,557,800
|
$55.89
3.36%
|
12/12/2013
|
$51.40
|
PP = $54.93
|
|
MB = $57.68
|
Most Recent Note - 12/23/2013 1:19:34 PM
G - Rising beyond its "max buy" level today yet without great volume conviction behind its gain, and its color code is changed to green. Formed a 9-week cup shaped base without a handle. Last week it announced an offering of more than 27 Million new shares and a total of nearly 43 Million existing shares are also being offered by certain selling stockholders including Mark Zuckerberg. Such offerings often are a short-term hindrance to price progress.
>>> FEATURED STOCK ARTICLE : Well Known Social Media Firm on Watch List While Still Base Building - 12/12/2013
View all notes |
Set NEW NOTE alert |
CANSLIM.net Company Profile |
SEC
News |
Chart |
Request a new note
C
A N
S L
I M
|
Symbol/Exchange
Company Name
Industry Group |
PRICE |
CHANGE
(%Change) |
Day High |
Volume
(% DAV)
(% 50 day avg vol) |
52 Wk Hi
% From Hi |
Featured
Date |
Price
Featured |
Pivot Featured |
|
Max Buy |
FLT
-
NYSE
Fleetcor Technologies
DIVERSIFIED SERVICES - Business/Management Services
|
$118.62
|
+0.75
0.64% |
$119.06
|
710,007
86.70% of 50 DAV
50 DAV is 818,900
|
$123.96
-4.31%
|
8/19/2013
|
$99.01
|
PP = $100.97
|
|
MB = $106.02
|
Most Recent Note - 12/17/2013 5:14:48 PM
G - Enduring recent distributional pressure while consolidating above its 50 DMA line. A subsequent violation of that important near-term support level may trigger a technical sell signal. See the latest FSU analysis for more details and new annotated daily and weekly graphs.
>>> FEATURED STOCK ARTICLE : Enduring Distributional Pressure While Extended From Sound Base - 12/17/2013
View all notes |
Set NEW NOTE alert |
CANSLIM.net Company Profile |
SEC
News |
Chart |
Request a new note
C
A N
S L
I M
|
GNRC
-
NYSE
Generac Hldgs Inc
CONSUMER DURABLES - Electronic Equipment
|
$56.11
|
+0.04
0.07% |
$56.66
|
572,984
71.41% of 50 DAV
50 DAV is 802,400
|
$56.39
-0.50%
|
11/26/2013
|
$53.02
|
PP = $52.42
|
|
MB = $55.04
|
Most Recent Note - 12/20/2013 5:34:34 PM
G - Hit another new 52-week high and rose above its "max buy" level with today's considerable gain backed by +44% above average volume, and its color code is changed to green. Prior highs in the $52 area define initial support to watch on pullbacks.
>>> FEATURED STOCK ARTICLE : Following Latest Breakout Prior Highs Define Support - 11/29/2013
View all notes |
Set NEW NOTE alert |
CANSLIM.net Company Profile |
SEC
News |
Chart |
Request a new note
C
A N
S L
I M
|
HLF
-
NYSE
Herbalife Ltd
DRUGS - Nutrition and Weight Management
|
$80.81
|
+0.20
0.25% |
$81.49
|
1,611,654
59.79% of 50 DAV
50 DAV is 2,695,600
|
$81.75
-1.15%
|
11/22/2013
|
$72.21
|
PP = $75.04
|
|
MB = $78.79
|
Most Recent Note - 12/19/2013 1:06:23 PM
G - Hitting another new 52-week high with today's 4th consecutive volume-driven gain, rallying with no resistance due to overhead supply.. Color code is changed to green after rising beyond its "max buy" level.
>>> FEATURED STOCK ARTICLE : Perched Near Highs Following Rebound - 11/22/2013
View all notes |
Set NEW NOTE alert |
CANSLIM.net Company Profile |
SEC
News |
Chart |
Request a new note
C
A N
S L
I M
|
JAZZ
-
NASDAQ
Jazz Pharmaceuticals Plc
DRUGS - Biotechnology
|
$125.41
|
+1.50
1.21% |
$125.70
|
699,545
92.58% of 50 DAV
50 DAV is 755,600
|
$126.84
-1.13%
|
9/30/2013
|
$93.20
|
PP = $89.10
|
|
MB = $93.56
|
Most Recent Note - 12/20/2013 12:23:16 PM
G - Extended from any sound base, it is off the session's earlier highs after gapping up for a new 52-week high with heavy volume behind its considerable gain. Reported news it will buy Gentium Spa (GENT) for $1 Billion.
>>> FEATURED STOCK ARTICLE : Technically Extended Stock May Be a Dangerous Chase - 12/10/2013
View all notes |
Set NEW NOTE alert |
CANSLIM.net Company Profile |
SEC
News |
Chart |
Request a new note
C
A N
S L
I M
|
KORS
-
NYSE
Michael Kors Hldgs Ltd
RETAIL - Apparel Stores
|
$80.80
|
-3.08
-3.67% |
$84.00
|
10,262,647
218.47% of 50 DAV
50 DAV is 4,697,600
|
$84.58
-4.47%
|
8/6/2013
|
$69.66
|
PP = $66.28
|
|
MB = $69.59
|
Most Recent Note - 12/23/2013 12:37:12 PM
G - Retreating from its 52-week high with above average volume behind today's loss. Testing support to watch at its 50 DMA line. Did not form a recent base of sufficient length.
>>> FEATURED STOCK ARTICLE : Consolidation Too Brief To Note New Pivot - 12/6/2013
View all notes |
Set NEW NOTE alert |
CANSLIM.net Company Profile |
SEC
News |
Chart |
Request a new note
C
A N
S L
I M
|
Symbol/Exchange
Company Name
Industry Group |
PRICE |
CHANGE
(%Change) |
Day High |
Volume
(% DAV)
(% 50 day avg vol) |
52 Wk Hi
% From Hi |
Featured
Date |
Price
Featured |
Pivot Featured |
|
Max Buy |
MRLN
-
NASDAQ
Marlin Business Services
DIVERSIFIED SERVICES - Rental and Leasing Services
|
$25.75
|
-0.14
-0.54% |
$26.70
|
36,596
148.76% of 50 DAV
50 DAV is 24,600
|
$28.64
-10.09%
|
12/19/2013
|
$26.69
|
PP = $28.74
|
|
MB = $30.18
|
Most Recent Note - 12/20/2013 5:36:32 PM
Y - Posted another gain today with above average volume. Volume-driven gains above the pivot point are needed to trigger a proper new technical buy signal. See the latest FSU analysis for more details and annotated daily and weekly graphs.
>>> FEATURED STOCK ARTICLE : Finished Weak While Enduring Distributional Pressure - 12/19/2013
View all notes |
Set NEW NOTE alert |
CANSLIM.net Company Profile |
SEC
News |
Chart |
Request a new note
C
A N
S L
I M
|
PCLN
-
NASDAQ
Priceline.Com Inc
INTERNET - Internet Software and Services
|
$1,187.25
|
-3.70
-0.31% |
$1,194.47
|
512,512
84.94% of 50 DAV
50 DAV is 603,400
|
$1,198.75
-0.96%
|
12/18/2013
|
$1,156.20
|
PP = $1,198.85
|
|
MB = $1,258.79
|
Most Recent Note - 12/18/2013 2:03:06 PM
Y - Formed an advanced "3-week tight" base, albeit a riskier "late-stage" set-up, and its color code is changed to yellow with new pivot point based on its 11/29/13 high plus 10 cents. Subsequent volume-driven gains above the pivot point may trigger a new (or add-on) technical buy signal. It 50 DMA line defines important support to watch on pullbacks.
>>> FEATURED STOCK ARTICLE : Extended From Any Sound Base Pattern - 12/3/2013
View all notes |
Set NEW NOTE alert |
CANSLIM.net Company Profile |
SEC
News |
Chart |
Request a new note
C
A N
S L
I M
|
SFUN
-
NYSE
Soufun Hldgs Ltd Ads A
INTERNET - Internet Information Providers
|
$80.65
|
+3.42
4.43% |
$82.33
|
878,782
65.16% of 50 DAV
50 DAV is 1,348,600
|
$77.94
3.48%
|
10/17/2013
|
$58.02
|
PP = $53.87
|
|
MB = $56.56
|
Most Recent Note - 12/23/2013 3:57:22 PM
G - Volume is below average behind today's considerable gain for new all-time highs. Held its ground stubbornly and wedged higher since last noted on 12/17/13 with caution - "It is extended from any sound base pattern yet may produce more climactic gains. Prior highs and its 50 DMA line coincide in the $59 area defining important support to watch."
>>> FEATURED STOCK ARTICLE : Extended From Base Yet May Produce More Climactic Gains - 12/9/2013
View all notes |
Set NEW NOTE alert |
CANSLIM.net Company Profile |
SEC
News |
Chart |
Request a new note
C
A N
S L
I M
|
SILC
-
NASDAQ
Silicom Ltd
COMPUTER HARDWARE - Networking andamp; Communication Dev
|
$44.68
|
+1.41
3.26% |
$44.90
|
56,784
136.83% of 50 DAV
50 DAV is 41,500
|
$46.15
-3.19%
|
12/23/2013
|
$44.62
|
PP = $46.25
|
|
MB = $48.56
|
Most Recent Note - 12/23/2013 5:20:17 PM
Y - Finished strong after highlighted in yellow with pivot point cited based on its 11/12/13 high plus 10 cents in the earlier mid-day report (read here). This Israeli manufacturer of Computer - Networking devices has rebounded from below its 50 DMA line and is rallying toward its 52-week high. Today's 6th consecutive gain leaves it with little resistance remaining due to overhead supply. Subsequent volume-driven gains above the pivot point may trigger a technical buy signal. Recently reported earnings +49% on +49% sales revenues for the Sep '13, continuing its streak of strong quarterly earnings increases satisfying the C criteria. After a downturn in FY '08 and '09 earnings its annual earnings (A criteria) history has shown strong and steady growth. Its small supply (S criteria) of only 3.93 million shares in the public float can contribute to greater price volatility.
There are no Featured Stock Updates™ available for this stock at this time. You may request one by clicking the Request a New Note link below
View all notes |
Set NEW NOTE alert |
CANSLIM.net Company Profile |
SEC
News |
Chart |
Request a new note
C
A N
S L
I M
|
SSNC
-
NASDAQ
S S & C Technologies
COMPUTER SOFTWARE and SERVICES - Application Software
|
$42.45
|
+0.25
0.59% |
$42.64
|
182,293
60.64% of 50 DAV
50 DAV is 300,600
|
$43.80
-3.08%
|
10/22/2013
|
$39.17
|
PP = $40.04
|
|
MB = $42.04
|
Most Recent Note - 12/23/2013 1:23:30 PM
G - Found prompt support near its 50 DMA line but it has not formed a sound new base. Recent low ($38.85 on 12/13/13) defines important near-term support to watch below its 50 DMA line.
>>> FEATURED STOCK ARTICLE : Found Prompt Support After Damaging Losses Raised Concerns - 12/16/2013
View all notes |
Set NEW NOTE alert |
CANSLIM.net Company Profile |
SEC
News |
Chart |
Request a new note
C
A N
S L
I M
|
Symbol/Exchange
Company Name
Industry Group |
PRICE |
CHANGE
(%Change) |
Day High |
Volume
(% DAV)
(% 50 day avg vol) |
52 Wk Hi
% From Hi |
Featured
Date |
Price
Featured |
Pivot Featured |
|
Max Buy |
SSYS
-
NASDAQ
Stratasys Ltd
COMPUTER HARDWARE - Computer Peripherals
|
$131.27
|
+5.40
4.29% |
$132.38
|
1,165,050
99.53% of 50 DAV
50 DAV is 1,170,500
|
$134.00
-2.04%
|
10/11/2013
|
$102.94
|
PP = $105.38
|
|
MB = $110.65
|
Most Recent Note - 12/23/2013 1:20:58 PM
G - Challenging its 52-week high with today's 5th consecutive gain, rallying from support at its 50 DMA line. Previously noted with caution - "Reported earnings +13% on +153% sales revenues, below the +25% minimum earnings guideline (C criteria) raising fundamental concerns."
>>> FEATURED STOCK ARTICLE : Rallying From Support at 50-Day Moving Average Line - 12/20/2013
View all notes |
Set NEW NOTE alert |
CANSLIM.net Company Profile |
SEC
News |
Chart |
Request a new note
C
A N
S L
I M
|
ULTI
-
NASDAQ
Ultimate Software Group
INTERNET - Internet Software and Services
|
$151.59
|
+0.17
0.11% |
$152.70
|
143,539
96.72% of 50 DAV
50 DAV is 148,400
|
$162.88
-6.93%
|
10/16/2013
|
$142.95
|
PP = $151.18
|
|
MB = $158.74
|
Most Recent Note - 12/20/2013 5:27:04 PM
G - Rallied near its 50 DMA line today with a volume-driven gain. That short-term average may act as resistance, while a rebound above its 50 DMA line is needed to help its technical stance.
>>> FEATURED STOCK ARTICLE : Consolidating Above 50 DMA Line and Prior Highs Defining Support - 11/21/2013
View all notes |
Set NEW NOTE alert |
CANSLIM.net Company Profile |
SEC
News |
Chart |
Request a new note
C
A N
S L
I M
|
VRX
-
NYSE
Valeant Pharmaceuticals
DRUGS - Drug Manufacturers - Other
|
$112.62
|
+0.62
0.55% |
$113.22
|
634,638
59.23% of 50 DAV
50 DAV is 1,071,500
|
$115.40
-2.40%
|
9/11/2013
|
$100.26
|
PP = $105.50
|
|
MB = $110.78
|
Most Recent Note - 12/23/2013 1:25:21 PM
G - Consolidating above its 50 DMA line and only -3.0% off its 52-week high. Recent lows in the $102 area define near-term support where a violation may trigger a technical sell signal. Resilient after earnings +24% on +74% sales revenues for the Sep '13 quarter came in a notch below the +25% minimum guideline (C criteria).
>>> FEATURED STOCK ARTICLE : Rebounding With Volume Backed Gains But Fundamental Concerns Remain - 12/18/2013
View all notes |
Set NEW NOTE alert |
CANSLIM.net Company Profile |
SEC
News |
Chart |
Request a new note
C
A N
S L
I M
|
YNDX
-
NASDAQ
Yandex N V Class A
INTERNET - Internet Information Providers
|
$41.85
|
+1.56
3.87% |
$42.94
|
3,946,454
149.24% of 50 DAV
50 DAV is 2,644,400
|
$42.00
-0.36%
|
11/27/2013
|
$39.61
|
PP = $42.10
|
|
MB = $44.21
|
Most Recent Note - 12/23/2013 1:09:43 PM
Y - Color code is changed to yellow while rallying above the previously cited pivot point and hitting a new 52-week high with today's 8th consecutive gain. Found prompt support at its 50 DMA line recently. At least +40% above average volume should be behind gains above the pivot point to trigger a proper new technical buy signal.
>>> FEATURED STOCK ARTICLE : Forming New Base Pattern With Little Resistance Remaining - 11/27/2013
View all notes |
Set NEW NOTE alert |
CANSLIM.net Company Profile |
SEC
News |
Chart |
Request a new note
C
A N
S L
I M
|
|
|
|
THESE ARE NOT BUY RECOMMENDATIONS!
Comments contained in the body of this report are technical
opinions only. The material herein has been obtained
from sources believed to be reliable and accurate, however,
its accuracy and completeness cannot be guaranteed.
This site is not an investment advisor, hence it does
not endorse or recommend any securities or other investments.
Any recommendation contained in this report may not
be suitable for all investors and it is not to be deemed
an offer or solicitation on our part with respect to
the purchase or sale of any securities. All trademarks,
service marks and trade names appearing in this report
are the property of their respective owners, and are
likewise used for identification purposes only.
This report is a service available
only to active Paid Premium Members.
You may opt-out of receiving report notifications
at any time. Questions or comments may be submitted
by writing to Premium Membership Services 665 S.E. 10 Street, Suite 201 Deerfield Beach, FL 33441-5634 or by calling 1-800-965-8307
or 954-785-1121.
|
|
|

