You are not logged in.
This means you
CAN ONLY VIEW reports that were published prior to Monday, April 14, 2025.
You
MUST UPGRADE YOUR MEMBERSHIP if you want to see any current reports.
AFTER MARKET UPDATE - WEDNESDAY, DECEMBER 23RD, 2009
Previous After Market Report Next After Market Report >>>
|
|
|
|
DOW |
+1.51 |
10,466.44 |
+0.01% |
|
Volume |
785,913,200 |
-18% |
|
Volume |
1,620,338,760 |
-9% |
|
NASDAQ |
+16.97 |
2,269.64 |
+0.75% |
|
Advancers |
2,152 |
69% |
|
Advancers |
1,854 |
65% |
|
S&P 500 |
+2.57 |
1,120.59 |
+0.23% |
|
Decliners |
857 |
27% |
|
Decliners |
870 |
30% |
|
Russell 2000 |
+7.38 |
630.98 |
+1.18% |
|
52 Wk Highs |
368 |
|
|
52 Wk Highs |
200 |
|
|
S&P 600 |
+3.83 |
335.68 |
+1.15% |
|
52 Wk Lows |
2 |
|
|
52 Wk Lows |
8 |
|
|
 |
Tech Strength Helps Nasdaq and Small-Cap Indices Lead Big Caps
Adam Sarhan, Contributing Writer,
The major averages closed higher Wednesday as investors digested a flurry of mixed economic data. Volume, an important indicator of institutional sponsorship, was lighter than Tuesday's levels, again revealing the lack of appetite for accumulating shares from very large and influential institutional investors. Advancers led decliners by nearly a 3-to-1 ratio on the NYSE and by over a 2-to-1 ratio on the Nasdaq exchange. There were 63 high-ranked companies from the CANSLIM.net Leaders List that made a new 52-week high and appeared on the CANSLIM.net BreakOuts Page, higher from the total of 52 issues that appeared on the prior session. New 52-week highs solidly outnumbered new 52-week lows on the NYSE and on the Nasdaq exchange, while new lows were in the single digits on both exchanges.
At 7:00AM EST, the Mortgage Bankers' Association (MBA) said its purchase application index fell -11.6% while its refinance index fell -10.1%, both below consensus. On a more positive note, the report showed that long term mortgage rates remain extremely low with 30-year loans averaging +4.92%. At 10:00AM EST, the Commerce Department said new home sales plunged -11% in November to a 355,000 annual rate which fell short of estimates. Furthermore, the report included downward revisions of 42,000 in the prior two months. New home sales measure the number of newly constructed homes with a committed sale during the prior month.
Elsewhere, personal income in November rose by +0.4%, following a rise of +0.3% in October. This was just below the Street's estimate of a +0.5% gain. The wages and salaries component of the report rose +0.3% after a +0.1% increase in October. The report showed that inflation eased last month. The headline PCE price inflation component fell to +0.2% from +0.3% in October. Core PCE inflation was unchanged in November, down from a +0.2% increase in October.
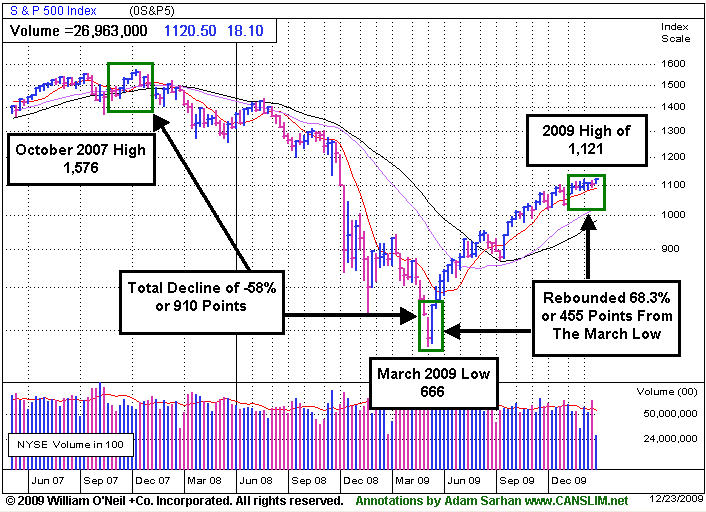
Looking at the market, the Dow Jones Industrial Average and benchmark S&P 500 Index both closed near their respective resistance levels as they've quietly consolidated their recent gains in lighter pre-holiday volume. Meanwhile, the tech-heavy Nasdaq Composite Index continues to lead its peers as it managed to hit another 2009 high on Wednesday. Remember that the S&P 500 Index plunged -58% from its all time high in October 2007 of 1,576 to its March 2009 low of 666. Since then, the market has rebounded over +65% but, still the S&P 500 Index remains -29% below its all-time high of 1,576. In addition, the index has retraced nearly -50% (455 points) of its decline (910 points) which is a popular Fibonacci level used by many technical analysts. Normally, markets rebound approximately 50% before resuming their prior trend (which would be down in this case). Longstanding readers of this column know that we do not predict the future. Instead, we remain open to any possible scenario that may unfold and interpret what we see happening by remaining objective and carefully analyzing the tape (price and volume) each day.
PICTURED: The S&P 500 Index has rebounded +68% from its March low, but is still -28% below its October 2007 high.
|
|
|
 |
Gold & Silver Index Rallies From Upward Trendline
Kenneth J. Gruneisen - Passed the CAN SLIM® Master's Exam
The Bank Index ($BKX -1.13%) had a negative influence while the Retail Index ($RLX +0.53%) and Broker/Dealer Index ($XBD +0.63%) posted modest gains. The tech sector also traded with a positive bias, and gains from the Internet Index ($IIX +1.63%), Networking Index ($NWX +0.82%), Biotechnology Index ($BTK +0.50%), and Semiconductor Index ($SOX +0.18%) helped the tech-heavy Nasdaq Composite Index and the small-cap indices rally for better gains than the big-caps and blue chips. Energy-related shares were on the rise and the Oil Services Index ($OSX +1.54%) and Integrated Oil Index ($XOI +0.50%) posted gains. The Healthcare Index ($HMO -0.03%) ended flat.
Charts courtesy www.stockcharts.com
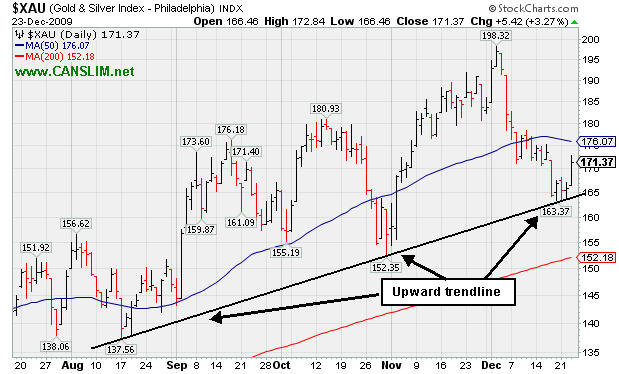
PICTURED: The Gold & Silver Index ($XAU +3.27%) posted a standout gain while rallying back toward its 50-day moving average line. The upward trendline connecting its August, November, an December chart lows is the next important support level. Technically, a violation of the trendline would raise more serious concerns for those who are bullish on gold and gold-related shares.
| Oil Services |
$OSX |
196.89 |
+2.98 |
+1.54% |
+62.20% |
| Healthcare |
$HMO |
1,520.20 |
-0.51 |
-0.03% |
+58.32% |
| Integrated Oil |
$XOI |
1,070.81 |
+5.38 |
+0.50% |
+9.30% |
| Semiconductor |
$SOX |
355.37 |
+0.65 |
+0.18% |
+67.49% |
| Networking |
$NWX |
230.86 |
+1.88 |
+0.82% |
+60.44% |
| Internet |
$IIX |
235.05 |
+3.77 |
+1.63% |
+75.71% |
| Broker/Dealer |
$XBD |
115.97 |
+0.73 |
+0.63% |
+49.70% |
| Retail |
$RLX |
417.95 |
+2.19 |
+0.53% |
+49.66% |
| Gold & Silver |
$XAU |
171.37 |
+5.42 |
+3.27% |
+38.37% |
| Bank |
$BKX |
42.87 |
-0.49 |
-1.13% |
-3.27% |
| Biotech |
$BTK |
938.82 |
+4.70 |
+0.50% |
+45.07% |
|
|
|
 |
Tight Consolidation After Considerable Gains
Kenneth J. Gruneisen - Passed the CAN SLIM® Master's Exam
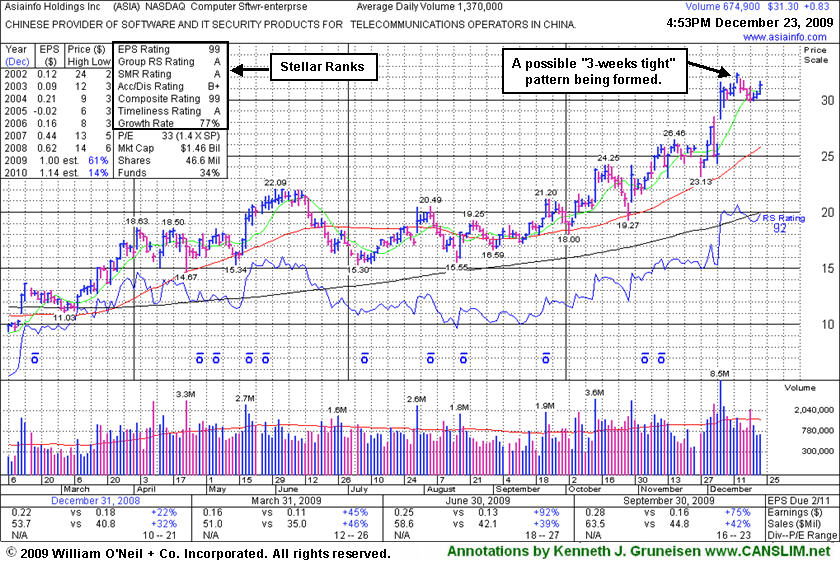
AsiaInfo Holdings, Inc. (ASIA +$0.83 or +2.72% to $31.30) posted a gain today on light volume for its second highest close ever. It is extended from its prior base after its considerable gap up gain on 12/07/09 with almost 8 times average volume. Its tight consolidation could be a possible "3-weeks tight" pattern currently in the making, but time is still needed, and a subsequent breakout with heavy volume is also needed to confirm a new technical buy signal. Meanwhile, its 50-day moving average (DMA) line and prior chart highs in the $26 area are an important support level to watch on pullbacks.
ASIA was featured 10/14/09 in the mid-day report (read here) as it gapped up for a new 52-week high with 5 times average volume, triggering a technical buy signal by blasting above its pivot point. It has traded up as much as +68.13% since first featured in the August 2009 CANSLIM.net News (read here).
|
|
|
Color Codes Explained :
Y - Better candidates highlighted by our
staff of experts.
G - Previously featured
in past reports as yellow but may no longer be buyable under the
guidelines.
***Last / Change / Volume quote data in this table corresponds with the timestamp on the note***
Symbol/Exchange
Company Name
Industry Group |
Last |
Chg. |
Vol
% DAV |
Date Featured |
Price Featured |
Latest Pivot Point
Featured |
Status |
| Latest Max Buy Price |
ARST
-
|
$26.24
|
+0.30
|
188,654
34% DAV
552,800
|
9/1/2009
(Date
Featured) |
$19.91
(Price
Featured) |
PP = $27.20 |
Y |
| MB = $28.56 |
Most Recent Note - 12/23/2009 4:39:05 PM
Y - Small gain today with light volume. Its rebound last week above its 50 DMA line helped its outlook improve, and it has been basing for 6 weeks. Color code was changed to yellow with new pivot point and max buy levels noted. ARST was first featured in yellow at $19.91 in the 9/01/09 mid-day report with an annotated daily graph (read here).
>>> The latest Featured Stock Update with an annotated graph appeared on 12/16/2009. click here.
|
|
C
A
S
I |
News |
Chart |
SEC
View all notes Alert
me of new notes
Company
Profile
|
ASIA
-
|
$31.30
|
+0.83
|
675,623
49% DAV
1,370,000
|
10/14/2009
(Date
Featured) |
$23.05
(Price
Featured) |
PP = $22.19 |
G |
| MB = $23.30 |
Most Recent Note - 12/23/2009 4:40:21 PM
G - Gain today for its second highest close ever. Extended from its prior base after its considerable gap up gain on 12/07/09 with almost 8 times average volume. Traded up as much as +68.13% since first featured in the August 2009 CANSLIM.net News (read here).
>>> The latest Featured Stock Update with an annotated graph appeared on 12/23/2009. click here.
|
|
C
A
S
I |
News |
Chart |
SEC
View all notes Alert
me of new notes
Company
Profile
|
BIDU
- NASDAQ
Baidu Inc Ads
INTERNET - Internet Information Providers
|
$414.20
|
+15.39
|
1,356,677
72% DAV
1,893,000
|
9/8/2009
(Date
Featured) |
$351.80
(Price
Featured) |
PP = $440.00 |
G |
| MB = $462.00 |
Most Recent Note - 12/23/2009 4:43:29 PM
G - Gain today on lighter volume ended a 4-day losing streak, but it remains below its 50 DMA line. Weakness has raised concerns, and its color code was changed to green. It would need to rally above its 50 DMA for its outlook to improve, and it needs to rise above its latest pivot point with at least +50% above average volume to trigger a new buy signal. Technically, it has built a sloppy base over 8 weeks. Since quietly rallying to new highs in November it has stalled. BIDU traded up as much as +23% from its price when featured in yellow in the 9/08/09 Mid-Day BreakOuts Report (read here).
>>> The latest Featured Stock Update with an annotated graph appeared on 12/21/2009. click here.
|
|
C
A
S
I |
News |
Chart |
SEC
View all notes Alert
me of new notes
Company
Profile
|
CAAS
- NASDAQ
China Automotive Systems
AUTOMOTIVE - Auto Parts
|
$18.58
|
+2.16
|
1,836,849
282% DAV
651,100
|
11/30/2009
(Date
Featured) |
$18.84
(Price
Featured) |
PP = $17.62 |
G |
| MB = $18.50 |
Most Recent Note - 12/23/2009 4:45:52 PM
G - Positively reversed after a gap down today led to a pullback near its 50 DMA line, then it rebounded above its pivot point for a solid gain on almost 3 times average volume. Technical action has recently been indicative of distributional pressure. It is showing a sign of support near its short-term average now, but the Chinese maker of power steering systems has negated most of its bullish action since featured in the 11/30/09 mid-day report (read here).
>>> The latest Featured Stock Update with an annotated graph appeared on 12/11/2009. click here.
|
|
C
A
S
I |
News |
Chart |
SEC
View all notes Alert
me of new notes
Company
Profile
|
CACC
- NASDAQ
Credit Acceptance Corp
FINANCIAL SERVICES - Credit Services
|
$42.05
|
+0.82
|
24,224
61% DAV
39,400
|
9/29/2009
(Date
Featured) |
$33.48
(Price
Featured) |
PP = $37.10 |
G |
| MB = $38.96 |
Most Recent Note - 12/23/2009 4:46:53 PM
G - Hit a new all-time high today with a light volume gain. Prior chart highs in the $35-37 area are an important support level to watch now. The Finance - Consumer/Commercial Loans firm has maintained a great track record of annual and quarterly sales revenues and earnings increases. It was featured on 9/29/09 in yellow in the mid-day report (read here).
>>> The latest Featured Stock Update with an annotated graph appeared on 12/22/2009. click here.
|
|
C
A
S
I |
News |
Chart |
SEC
View all notes Alert
me of new notes
Company
Profile
|
CRM
- NYSE
Salesforce.com Inc
INTERNET - Internet Software & Services
|
$72.60
|
+1.30
|
1,857,538
113% DAV
1,640,700
|
12/18/2009
(Date
Featured) |
$67.32
(Price
Featured) |
PP = $67.82 |
G |
| MB = $71.21 |
Most Recent Note - 12/23/2009 4:48:55 PM
G - Posted a 4th consecutive gain today and new 2009 high, extended from its prior base. Last week it rose from a 5-week flat base above important support at its 50 DMA line. Its 12/18/09 gain with more than +50% above average volume above its prior highs triggered a technical buy signal.
>>> The latest Featured Stock Update with an annotated graph appeared on 12/18/2009. click here.
|
|
C
A
S
I |
News |
Chart |
SEC
View all notes Alert
me of new notes
Company
Profile
|
CTRP
- NASDAQ
Ctrip.com Intl Ltd Adr
LEISURE - Resorts & Casinos
|
$72.59
|
+1.70
|
733,203
66% DAV
1,119,300
|
12/1/2009
(Date
Featured) |
$75.38
(Price
Featured) |
PP = $73.91 |
G |
| MB = $77.61 |
Most Recent Note - 12/23/2009 4:50:09 PM
G - Gain today on light volume. This week's slump under its pivot point raised more concerns while falling toward its 50 DMA line - its next important chart support level. Color code was changed to green based on the deterioration more than -7% below its latest pivot point. Featured on 12/01/09 in yellow in the mid-day report (read here). Fundamentally, its sales revenues and earnings increases have shown acceleration in the 3 most recent quarterly comparisons and rose above the +25% guideline. Based on weak technical action it was dropped from the Featured Stocks list on 6/10/08, when it closed at $49.84, yet it has rebounded very impressively from subsequent lows in the $16 area.
>>> The latest Featured Stock Update with an annotated graph appeared on 12/14/2009. click here.
|
|
C
A
S
I |
News |
Chart |
SEC
View all notes Alert
me of new notes
Company
Profile
|
HEAT
-
|
$14.69
|
+0.31
|
933,154
99% DAV
943,300
|
11/17/2009
(Date
Featured) |
$12.00
(Price
Featured) |
PP = $12.61 |
G |
| MB = $13.24 |
Most Recent Note - 12/23/2009 4:51:17 PM
G - Gain today with average volume halted a streak of 5 consecutive losses since reaching its 52-week high. It is still extended from its prior base after 3 weekly gains on above average volume in the prior 4 weeks. The investment system rules say a stock should be held a minimum of 8 weeks after rising more than +20% in the first 2-3 weeks from being bought. First featured in yellow in the 11/17/09 mid-day report (read here) when technically rising from a "double bottom" base, reaching a new all-time high.
>>> The latest Featured Stock Update with an annotated graph appeared on 12/15/2009. click here.
|
|
C
A
S
I |
News |
Chart |
SEC
View all notes Alert
me of new notes
Company
Profile
|
LFT
-
|
$37.05
|
+0.48
|
196,015
44% DAV
445,300
|
11/17/2009
(Date
Featured) |
$31.77
(Price
Featured) |
PP = $33.04 |
G |
| MB = $34.69 |
Most Recent Note - 12/23/2009 4:52:14 PM
G - Quietly consolidating near all-time highs. Extended from a sound buy point now after recently rising from a choppy 14-week base. Its 50 DMA line coincides with prior chart highs in the $32 area are an initial support level to watch. A proposed offering of additional shares on 11/16/09 seems well received by the market. Its fundamentals remain strong.
>>> The latest Featured Stock Update with an annotated graph appeared on 12/17/2009. click here.
|
|
C
A
S
I |
News |
Chart |
SEC
View all notes Alert
me of new notes
Company
Profile
|
|
|
|
THESE ARE NOT BUY RECOMMENDATIONS!
Comments contained in the body of this report are technical
opinions only. The material herein has been obtained
from sources believed to be reliable and accurate, however,
its accuracy and completeness cannot be guaranteed.
This site is not an investment advisor, hence it does
not endorse or recommend any securities or other investments.
Any recommendation contained in this report may not
be suitable for all investors and it is not to be deemed
an offer or solicitation on our part with respect to
the purchase or sale of any securities. All trademarks,
service marks and trade names appearing in this report
are the property of their respective owners, and are
likewise used for identification purposes only.
This report is a service available
only to active Paid Premium Members.
You may opt-out of receiving report notifications
at any time. Questions or comments may be submitted
by writing to Premium Membership Services 665 S.E. 10 Street, Suite 201 Deerfield Beach, FL 33441-5634 or by calling 1-800-965-8307
or 954-785-1121.
|
|
|


