You are not logged in.
This means you
CAN ONLY VIEW reports that were published prior to Monday, April 14, 2025.
You
MUST UPGRADE YOUR MEMBERSHIP if you want to see any current reports.
AFTER MARKET UPDATE - TUESDAY, DECEMBER 22ND, 2009
Previous After Market Report Next After Market Report >>>
|
|
|
|
DOW |
+50.79 |
10,464.93 |
+0.49% |
|
Volume |
955,478,700 |
-6% |
|
Volume |
1,787,732,050 |
-3% |
|
NASDAQ |
+15.01 |
2,252.67 |
+0.67% |
|
Advancers |
1,893 |
60% |
|
Advancers |
1,660 |
58% |
|
S&P 500 |
+3.97 |
1,118.02 |
+0.36% |
|
Decliners |
1,119 |
36% |
|
Decliners |
1,052 |
37% |
|
Russell 2000 |
+5.00 |
623.60 |
+0.81% |
|
52 Wk Highs |
282 |
|
|
52 Wk Highs |
174 |
|
|
S&P 600 |
+2.68 |
331.85 |
+0.81% |
|
52 Wk Lows |
6 |
|
|
52 Wk Lows |
19 |
|
|
 |
Stocks Rise Again On Quieter Volume Totals
Adam Sarhan, Contributing Writer,
Stocks in the US closed higher after the latest round of economic data was released. Volume, an important indicator of institutional sponsorship, was lower than Monday's levels, revealing a lack of appetite for accumulating shares from very large and influential institutional investors. Advancers led decliners by nearly a 2-to-1 ratio on the NYSE and by a 3-to-2 ratio on the Nasdaq exchange. There were 52 high-ranked companies from the CANSLIM.net Leaders List that made a new 52-week high and appeared on the CANSLIM.net BreakOuts Page, higher from the total of 43 issues that appeared on the prior session. New 52-week highs solidly outnumbered new 52-week lows on the NYSE and on the Nasdaq exchange.
Before Tuesday's opening bell, the Commerce Department said third quarter GDP rose by +2.2% which was lower than prior estimates and led many to question the health of the ongoing recovery. The report showed that companies curbed spending and cut inventories due to lackluster demand. At 10:00AM EST, the National Association of Realtors said existing home sales jumped +7.4% to a 6.54 million annual rate. The report was the highest in more than two years and led many to question whether or not the ailing housing market has finally bottomed.
Continuing the recent trend, stocks and the US dollar both advanced. However, other dollar denominated assets (i.e. many commodities) edged lower. Stocks are decoupled from the US dollar, but investors cannot be sure if this is the beginning of a new trend or if this is a brief anomaly which, after the New Year, will pass.
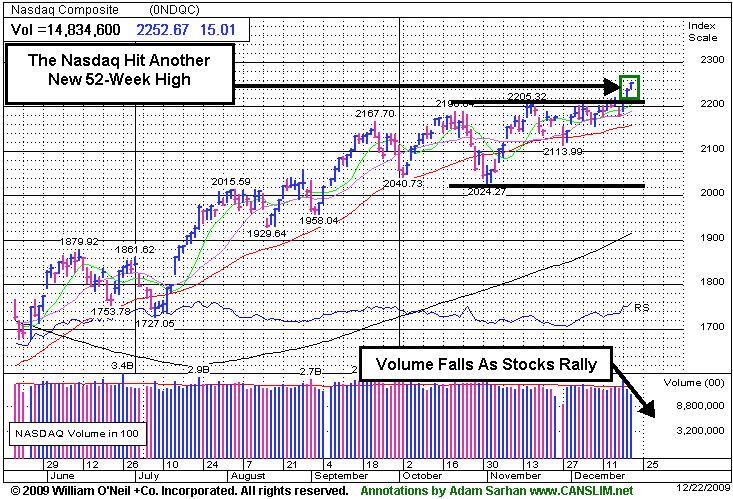
Bloomberg.com reported that the Street expects 2010 earnings to grow +24% which follows a -12% decline in 2009. The survey also showed that first quarter earnings are expected to grow +28% when compared to the same period in 2009. The Dow Jones Industrial Average and the benchmark S&P 500 Index both closed below their respective resistance levels on this shortened holiday week. Elsewhere, the tech-heavy Nasdaq Composite hit another fresh 2009 high as investors continue to flock to tech stocks for potential growth.
PICTURED: The Nasdaq Composite Index hit another 2009 high, yet volume waned behind its latest gain.
|
|
|
 |
Biotech Index's Gain Made It A Standout Today
Kenneth J. Gruneisen - Passed the CAN SLIM® Master's Exam
The Bank Index ($BKX +0.12%) edged higher, and the Broker/Dealer Index ($XBD +1.17%) and Retail Index ($RLX +0.43%) helped the major averages trade with a modestly positive bias on Tuesday. The Biotechnology Index ($BTK +1.73%) led the tech sector while the Semiconductor Index ($SOX +0.59%) and Networking Index ($NWX +0.82%) posted modest gains, but the Internet Index ($IIX +0.04%) ended just above unchanged for the day. Defensive areas had a quiet session as the Oil Services Index ($OSX -0.29%) and Integrated Oil Index ($XOI +0.52%) finished mixed and little changed, meanwhile the Gold & Silver Index ($XAU +0.31%) and Healthcare Index ($HMO +0.14%) posted small gains.
Charts courtesy www.stockcharts.com
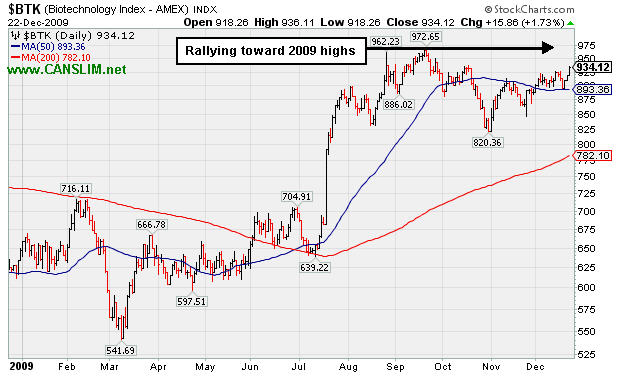
PICTURED: The Biotechnology Index ($BTK +1.73%) is rallying back toward its 2009 highs after recently consolidating above its 50-day moving average (DMA) line.
| Oil Services |
$OSX |
193.91 |
-0.57 |
-0.29% |
+59.74% |
| Healthcare |
$HMO |
1,520.71 |
+2.20 |
+0.14% |
+58.38% |
| Integrated Oil |
$XOI |
1,065.43 |
+5.53 |
+0.52% |
+8.75% |
| Semiconductor |
$SOX |
354.72 |
+2.07 |
+0.59% |
+67.19% |
| Networking |
$NWX |
228.98 |
+1.86 |
+0.82% |
+59.14% |
| Internet |
$IIX |
231.28 |
+0.09 |
+0.04% |
+72.89% |
| Broker/Dealer |
$XBD |
115.24 |
+1.33 |
+1.17% |
+48.75% |
| Retail |
$RLX |
415.76 |
+1.80 |
+0.43% |
+48.88% |
| Gold & Silver |
$XAU |
165.95 |
+0.52 |
+0.31% |
+33.99% |
| Bank |
$BKX |
43.36 |
+0.05 |
+0.12% |
-2.17% |
| Biotech |
$BTK |
934.12 |
+15.86 |
+1.73% |
+44.34% |
|
|
|
 |
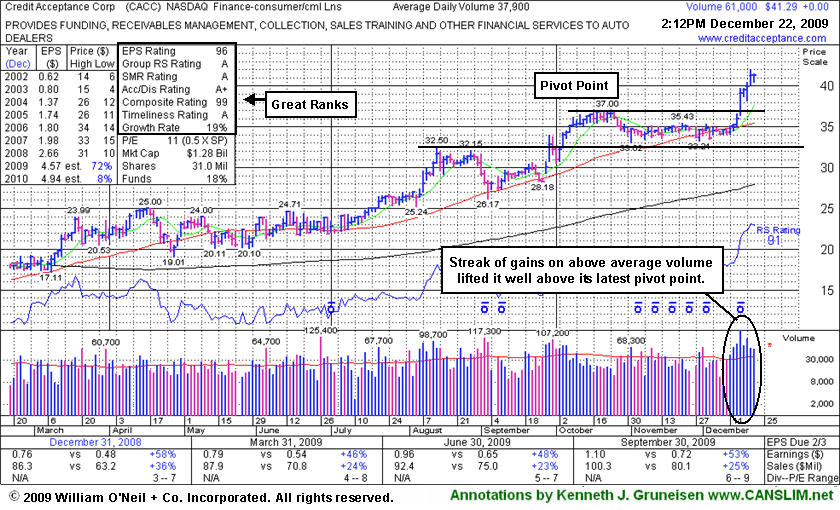
Streak Of 7 Straight Gains Has Stock Extended From Ideal Buy Point
Kenneth J. Gruneisen - Passed the CAN SLIM® Master's Exam
Credit Acceptance Corp (CACC -$0.05 or -0.15% to $41.24) saw its winning streak into new all-time high territory end today with a small loss after 7 consecutive gains. Prior chart highs in the $35-37 area are an important support level to watch now, but weakness would raise more serious concerns if volume expands behind damaging losses that lead to it slumping back into its prior base. The Finance - Consumer/Commercial Loans firm has maintained a great track record of annual and quarterly sales revenues and earnings increases that satisfy the C and A criteria of the investment system. It was previously noted while showing some resilience near its important short-term average line while enduring some recent distributional pressure.
Disciplined investors avoid chasing extended stocks that have risen more than +5% above their prior chart high or pivot point. If they miss the ideal window of opportunity, patience may allow investors to accumulate shares on light volume pullbacks, or when another new base forms and a new buy signal is triggered. Investors can then "force feed" their winners by adding to already profitable positions whenever additional buys can be made within the proper parameters. According to the investment system rules, averaging down should never be done. The high-ranked leader's 9/29/09 breakout gain was backed by more than 2 times average volume. Since first featured it has also risen above its 2006-2007 highs ($33-34) to new all-time highs, which is a very reassuring sign of strength. CACC was featured in yellow in the 9/29/09 mid-day report (read here).
|
|
|
Color Codes Explained :
Y - Better candidates highlighted by our
staff of experts.
G - Previously featured
in past reports as yellow but may no longer be buyable under the
guidelines.
***Last / Change / Volume quote data in this table corresponds with the timestamp on the note***
Symbol/Exchange
Company Name
Industry Group |
Last |
Chg. |
Vol
% DAV |
Date Featured |
Price Featured |
Latest Pivot Point
Featured |
Status |
| Latest Max Buy Price |
ARST
-
|
$25.94
|
-0.37
|
213,778
38% DAV
561,700
|
9/1/2009
(Date
Featured) |
$19.91
(Price
Featured) |
PP = $27.20 |
Y |
| MB = $28.56 |
Most Recent Note - 12/22/2009 4:25:24 PM
Y - Small loss today with light volume after an 8-day winning streak. Its rebound last week above its 50 DMA line helped its outlook improve, and it has been basing for 6 weeks. Color code is changed to yellow with new pivot point and max buy levels noted. ARST was first featured in yellow at $19.91 in the 9/01/09 mid-day report with an annotated daily graph (read here).
>>> The latest Featured Stock Update with an annotated graph appeared on 12/16/2009. click here.
|
|
C
A
S
I |
News |
Chart |
SEC
View all notes Alert
me of new notes
Company
Profile
|
ASIA
-
|
$30.47
|
+0.31
|
639,332
47% DAV
1,368,800
|
10/14/2009
(Date
Featured) |
$23.05
(Price
Featured) |
PP = $22.19 |
G |
| MB = $23.30 |
Most Recent Note - 12/22/2009 4:29:21 PM
G - Holding its ground, extended from its prior base after its considerable gap up gain on 12/07/09 with almost 8 times average volume. Traded up as much as +68.13% since first featured in the August 2009 CANSLIM.net News (read here).
>>> The latest Featured Stock Update with an annotated graph appeared on 12/7/2009. click here.
|
|
C
A
S
I |
News |
Chart |
SEC
View all notes Alert
me of new notes
Company
Profile
|
BIDU
- NASDAQ
Baidu Inc Ads
INTERNET - Internet Information Providers
|
$398.81
|
-8.57
|
1,672,342
87% DAV
1,914,800
|
9/8/2009
(Date
Featured) |
$351.80
(Price
Featured) |
PP = $440.00 |
G |
| MB = $462.00 |
Most Recent Note - 12/22/2009 4:31:13 PM
G - Loss today on higher (near average) volume led to further deterioration below its 50 DMA line. Weakness has raised concerns, and its color code was changed to green. It would need to rally above its latest pivot point to trigger a new buy signal. Technically, it has built a sloppy base over 8 weeks. Since quietly rallying to new highs in November it has stalled. BIDU traded up as much as +23% from its price when featured in yellow in the 9/08/09 Mid-Day BreakOuts Report (read here).
>>> The latest Featured Stock Update with an annotated graph appeared on 12/21/2009. click here.
|
|
C
A
S
I |
News |
Chart |
SEC
View all notes Alert
me of new notes
Company
Profile
|
CAAS
- NASDAQ
China Automotive Systems
AUTOMOTIVE - Auto Parts
|
$16.42
|
-1.45
|
1,514,735
241% DAV
628,500
|
11/30/2009
(Date
Featured) |
$18.84
(Price
Featured) |
PP = $17.62 |
G |
| MB = $18.50 |
Most Recent Note - 12/22/2009 4:33:14 PM
G - Gapped down today and closed near its session low, undercutting its pivot point and raising concerns with a 4th consecutive loss on ever-increasing and above average volume - technical action indicative of distributional pressure. Negative reversals recently raised concerns while it was extended from a sound base under the investment system rules. The Chinese maker of power steering systems was rising from an advanced "3-weeks tight" type of chart pattern as it showed up in yellow in the 11/30/09 mid-day report (read here). Recent quarters show accelerating sales revenues and earnings increases, and it has a good annual earnings history.
>>> The latest Featured Stock Update with an annotated graph appeared on 12/11/2009. click here.
|
|
C
A
S
I |
News |
Chart |
SEC
View all notes Alert
me of new notes
Company
Profile
|
CACC
- NASDAQ
Credit Acceptance Corp
FINANCIAL SERVICES - Credit Services
|
$41.23
|
-0.06
|
97,499
257% DAV
37,900
|
9/29/2009
(Date
Featured) |
$33.48
(Price
Featured) |
PP = $37.10 |
G |
| MB = $38.96 |
Most Recent Note - 12/22/2009 4:34:58 PM
G - Winning streak to new all-time highs ended with a small loss today after 7 consecutive gains. Prior chart highs in the $35-37 area are an important support level to watch now. The Finance - Consumer/Commercial Loans firm has maintained a great track record of annual and quarterly sales revenues and earnings increases. It was featured on 9/29/09 in yellow in the mid-day report (read here).
>>> The latest Featured Stock Update with an annotated graph appeared on 12/22/2009. click here.
|
|
C
A
S
I |
News |
Chart |
SEC
View all notes Alert
me of new notes
Company
Profile
|
CRM
- NYSE
Salesforce.com Inc
INTERNET - Internet Software & Services
|
$71.30
|
+1.58
|
2,569,885
159% DAV
1,620,500
|
12/18/2009
(Date
Featured) |
$67.32
(Price
Featured) |
PP = $67.82 |
G |
| MB = $71.21 |
Most Recent Note - 12/22/2009 4:36:44 PM
G - Today's gain was its 3rd consecutive gain with above average volume for a new 2009 high, rising more than +5% above its latest pivot point. Color code was changed to green. Last week it rose from a 5-week flat base above important support at its 50 DMA line. Its 12/18/09 gain with more than +50% above average volume above its prior highs triggered a technical buy signal.
>>> The latest Featured Stock Update with an annotated graph appeared on 12/18/2009. click here.
|
|
C
A
S
I |
News |
Chart |
SEC
View all notes Alert
me of new notes
Company
Profile
|
CTRP
- NASDAQ
Ctrip.com Intl Ltd Adr
LEISURE - Resorts & Casinos
|
$70.89
|
-2.42
|
1,827,223
166% DAV
1,099,900
|
12/1/2009
(Date
Featured) |
$75.38
(Price
Featured) |
PP = $73.91 |
G |
| MB = $77.61 |
Most Recent Note - 12/22/2009 4:37:48 PM
G - Considerable loss today on above average volume, sinking under its pivot point and raising more concerns while falling toward its 50 DMA line - its next important chart support level. Color code was changed to green based on the deterioration more than -7% below its latest pivot point. Featured on 12/01/09 in yellow in the mid-day report (read here). Fundamentally, its sales revenues and earnings increases have shown acceleration in the 3 most recent quarterly comparisons and rose above the +25% guideline. Based on weak technical action it was dropped from the Featured Stocks list on 6/10/08, when it closed at $49.84, yet it has rebounded very impressively from subsequent lows in the $16 area.
>>> The latest Featured Stock Update with an annotated graph appeared on 12/14/2009. click here.
|
|
C
A
S
I |
News |
Chart |
SEC
View all notes Alert
me of new notes
Company
Profile
|
HEAT
-
|
$14.38
|
-0.77
|
1,451,746
158% DAV
921,400
|
11/17/2009
(Date
Featured) |
$12.00
(Price
Featured) |
PP = $12.61 |
G |
| MB = $13.24 |
Most Recent Note - 12/22/2009 4:38:53 PM
G - Loss today with higher than average volume was its 5th consecutive loss since reaching its 52-week high. It is still a bit extended from its prior base after 3 weekly gains on above average volume in the prior 4 weeks. The investment system rules say a stock should be held a minimum of 8 weeks after rising more than +20% in the first 2-3 weeks from being bought. First featured in yellow in the 11/17/09 mid-day report (read here) when technically rising from a "double bottom" base, reaching a new all-time high.
>>> The latest Featured Stock Update with an annotated graph appeared on 12/15/2009. click here.
|
|
C
A
S
I |
News |
Chart |
SEC
View all notes Alert
me of new notes
Company
Profile
|
LFT
-
|
$36.57
|
-0.93
|
477,070
106% DAV
450,500
|
11/17/2009
(Date
Featured) |
$31.77
(Price
Featured) |
PP = $33.04 |
G |
| MB = $34.69 |
Most Recent Note - 12/22/2009 4:43:09 PM
G - Loss today, closing near the session low with higher volume (near average) after briefly touching a new all-time high on the prior session. Extended from a sound buy point now after recently rising from a choppy 14-week base. Its 50 DMA line coincides with prior chart highs in the $32 area are an initial support level to watch. A proposed offering of additional shares on 11/16/09 seems well received by the market. Its fundamentals remain strong.
>>> The latest Featured Stock Update with an annotated graph appeared on 12/17/2009. click here.
|
|
C
A
S
I |
News |
Chart |
SEC
View all notes Alert
me of new notes
Company
Profile
|
|
|
|
THESE ARE NOT BUY RECOMMENDATIONS!
Comments contained in the body of this report are technical
opinions only. The material herein has been obtained
from sources believed to be reliable and accurate, however,
its accuracy and completeness cannot be guaranteed.
This site is not an investment advisor, hence it does
not endorse or recommend any securities or other investments.
Any recommendation contained in this report may not
be suitable for all investors and it is not to be deemed
an offer or solicitation on our part with respect to
the purchase or sale of any securities. All trademarks,
service marks and trade names appearing in this report
are the property of their respective owners, and are
likewise used for identification purposes only.
This report is a service available
only to active Paid Premium Members.
You may opt-out of receiving report notifications
at any time. Questions or comments may be submitted
by writing to Premium Membership Services 665 S.E. 10 Street, Suite 201 Deerfield Beach, FL 33441-5634 or by calling 1-800-965-8307
or 954-785-1121.
|
|
|


