You are not logged in.
This means you
CAN ONLY VIEW reports that were published prior to Monday, April 14, 2025.
You
MUST UPGRADE YOUR MEMBERSHIP if you want to see any current reports.
AFTER MARKET UPDATE - MONDAY, DECEMBER 21ST, 2009
Previous After Market Report Next After Market Report >>>
|
|
|
|
DOW |
+85.25 |
10,414.14 |
+0.83% |
|
Volume |
1,012,511,020 |
-68% |
|
Volume |
1,847,500,520 |
-44% |
|
NASDAQ |
+25.97 |
2,237.66 |
+1.17% |
|
Advancers |
2,187 |
70% |
|
Advancers |
1,837 |
64% |
|
S&P 500 |
+11.58 |
1,114.05 |
+1.05% |
|
Decliners |
848 |
27% |
|
Decliners |
930 |
32% |
|
Russell 2000 |
+8.03 |
618.60 |
+1.32% |
|
52 Wk Highs |
289 |
|
|
52 Wk Highs |
140 |
|
|
S&P 600 |
+4.60 |
329.17 |
+1.42% |
|
52 Wk Lows |
3 |
|
|
52 Wk Lows |
17 |
|
|
 |
Major Averages Climb Higher On Lighter Volume
Adam Sarhan, Contributing Writer,
The major averages rallied on Monday as the latest round of mergers and acquisitions were announced. As expected, volume, an important indicator of institutional sponsorship, was lower than Friday's levels due to quadruple witching. Advancers led decliners by over a 2-to-1 ratio on the NYSE and by nearly a 2-to-1 ratio on the Nasdaq exchange. There were 43 high-ranked companies from the CANSLIM.net Leaders List that made a new 52-week high and appeared on the CANSLIM.net BreakOuts Page, up from the total of 26 issues that appeared on the prior session. New 52-week highs solidly outnumbered new 52-week lows on the NYSE and on the Nasdaq exchange.
It was encouraging to see the major averages rally even as the US dollar advanced. Since early December, the US dollar has steadily advanced but the major averages have managed to hold their own and move sideways to slighter higher during that period. However, other dollar denominated assets were not as fortunate: gold tumbled nearly -11% from its 2009 high and crude oil slid nearly -15% from its 2009 high. This led many investors to ponder whether US equities may begin decoupling from the greenback. If that were to occur, then both asset classes (stocks and the dollar) would move in the same direction which would be an important shift.
In recent quarters, US companies are paying the largest premiums on record as M&A activity increases. Many analysts believe that this is a sign that executives are growing more bullish about earnings and the economy even after the biggest 8-month rally for the Standard & Poor's 500 Index in 73 years! Analysts believe that mergers may surge +35% in 2010 and +23% in 2011 as credit begins to flow again. The data, compiled by Sanford C. Bernstein, is based on M&A's that occurred since 1980. Their research incorporates growth in GDP, corporate earnings and commercial loan volume. That said, the S&P 500 Index's price to earnings (P/E) ratio is just over 22.2 times its companies’ profits over the past 12 months and is expected to fall to 11.6 when measured against analysts' 2011 forecast. Of course, the actual results could be different next year but all things being equal, suggests more M&A news is on the horizon.
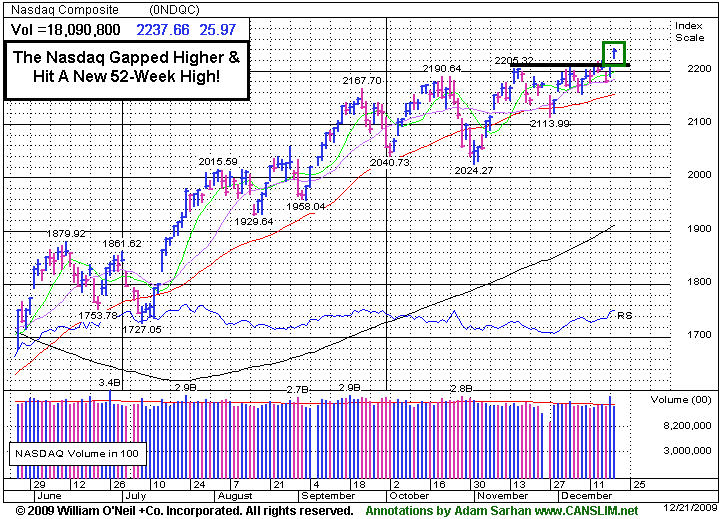
It was very encouraging to see the Nasdaq Composite Index break out of its current trading range and hit a new 2009 high on Monday. It was also very encouraging to see the Philly Semiconductor Index (SOX) gap higher and hit a fresh 2009 high as well. Meanwhile,the Dow Jones Industrial Average and S&P 500 closed just below 10,500 and 1,120, their respective resistance levels. Apple Inc. (AAPL +1.43%) closed above its 6-week downward trendline and its 50-day moving average which are both healthy signs and bode well for this 42-week long rally.
PICTURED: The Nasdaq Composite Index gapped higher and hit a fresh 2009 high.
|
|
|
 |
Healthcare Group Showing Great Strength
Kenneth J. Gruneisen - Passed the CAN SLIM® Master's Exam
The Gold & Silver Index ($XAU -0.96%) was a laggard while most groups rise on Monday. Among the many groups that were on the rise, the Broker/Dealer Index ($XBD +0.73%), Bank Index ($BKX +1.52%), and Retail Index ($RLX +1.69%) had a positive influence on the major averages. The tech sector had a positive bias too, with the Semiconductor Index ($SOX +2.27%), Networking Index ($NWX +0.92%), Internet Index ($IIX +1.03%), and Biotechnology Index ($BTK +1.05%) posting unanimous gains. Energy shares also traded up, boosting the Oil Services Index ($OSX +1.27%) and the Integrated Oil Index ($XOI +1.53%).
Charts courtesy www.stockcharts.com
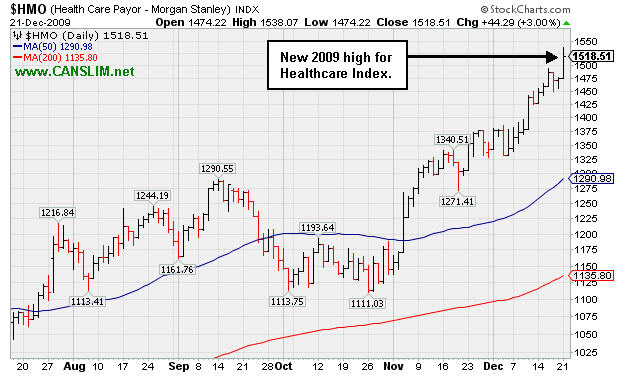
PICTURED: The Healthcare Index ($HMO +3.00%) was a standout gainer as it rose to a new 2009 high.
| Oil Services |
$OSX |
194.48 |
+2.43 |
+1.27% |
+60.21% |
| Healthcare |
$HMO |
1,518.51 |
+44.29 |
+3.00% |
+58.15% |
| Integrated Oil |
$XOI |
1,059.90 |
+15.93 |
+1.53% |
+8.19% |
| Semiconductor |
$SOX |
352.65 |
+7.82 |
+2.27% |
+66.21% |
| Networking |
$NWX |
227.12 |
+2.08 |
+0.92% |
+57.84% |
| Internet |
$IIX |
231.19 |
+2.35 |
+1.03% |
+72.83% |
| Broker/Dealer |
$XBD |
113.91 |
+0.82 |
+0.73% |
+47.04% |
| Retail |
$RLX |
413.96 |
+6.88 |
+1.69% |
+48.23% |
| Gold & Silver |
$XAU |
165.43 |
-1.61 |
-0.96% |
+33.57% |
| Bank |
$BKX |
43.31 |
+0.65 |
+1.52% |
-2.28% |
| Biotech |
$BTK |
918.26 |
+9.50 |
+1.05% |
+41.89% |
|
|
|
 |
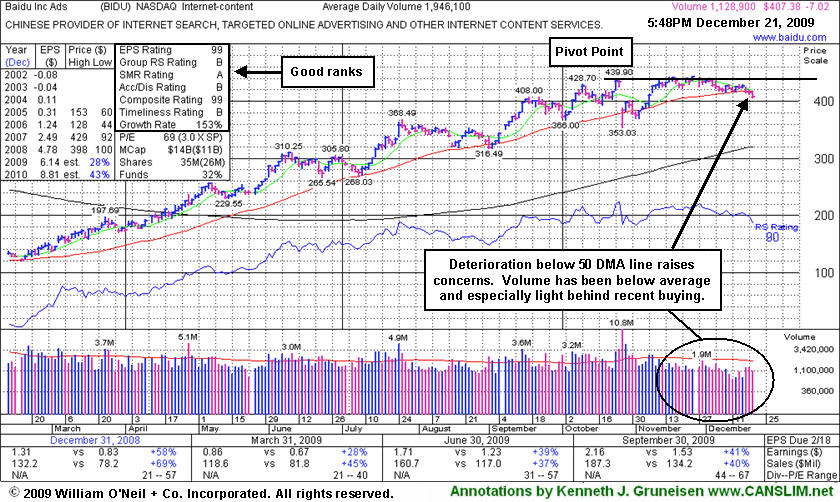
Slump Below 50-Day Moving Average Hurting Outlook
Kenneth J. Gruneisen - Passed the CAN SLIM® Master's Exam
Baidu.com, Inc. (BIDU -$7.02 or -1.72% to $407.38) suffered a 3rd consecutive loss today on light volume, leading to further deterioration below its 50-day moving average (DMA) line. The weakness, and its lack of upward progress, is raising concerns and hurting its outlook. Its color code was changed to green as it slumped from near its pivot point. It would need to rally above its latest pivot point to trigger a new buy signal. Technically, it has built a sloppy base over 8 weeks. Since quietly rallying to new highs in November it has stalled.
This Chinese provider of Internet search and content services could continue base-building for a longer period. Patience is important because without convincing gains leading to a fresh breakout there is little assurance it is capable of sustaining a meaningful rally higher. Even a powerful breakout might be risky to trade after its 4-fold ascent this year, its recent action could be "late-stage" and more failure prone.
BIDU proved resilient near its 50 DMA line after its 10/27/09 gap down, and it was a sign of great institutional support, making a stand near its important short-term average line. Technically it traded a little bit above the prior chart high of $439.90 following the considerable gap down on earnings news, as it clawed its way to new all-time highs on lighter than average volume, leaving questions as to how much appetite the large investors had for accumulating a greater ownership interest. It is reassuring, however, that the number of top-rated funds owning BIDU's shares rose from 103 in Dec '08 to 169 in Sep '09, solid evidence its shares were being accumulated by the institutional (I criteria) crowd.
BIDU traded up as much as +23% from its price when featured in yellow in the 9/08/09 Mid-Day BreakOuts Report (read here). In this FSU section on 9/21/09 we summarized more extensive prior coverage this currently Featured Stock has received (read here).
|
|
|
Color Codes Explained :
Y - Better candidates highlighted by our
staff of experts.
G - Previously featured
in past reports as yellow but may no longer be buyable under the
guidelines.
***Last / Change / Volume quote data in this table corresponds with the timestamp on the note***
Symbol/Exchange
Company Name
Industry Group |
Last |
Chg. |
Vol
% DAV |
Date Featured |
Price Featured |
Latest Pivot Point
Featured |
Status |
| Latest Max Buy Price |
ARST
-
|
$26.31
|
+0.28
|
393,648
70% DAV
562,500
|
9/1/2009
(Date
Featured) |
$19.91
(Price
Featured) |
PP = $20.90 |
G |
| MB = $21.95 |
Most Recent Note - 12/21/2009 5:49:28 PM
G - Ended at its second highest close ever today with light volume behind its 8th consecutive gain. Its rebound last week above its 50 DMA line helped its outlook improve. Deterioration below its recent chart lows ($22.15) would raise more serious concerns. ARST was first featured in yellow at $19.91 in the 9/01/09 mid-day report with an annotated daily graph (read here).
>>> The latest Featured Stock Update with an annotated graph appeared on 12/16/2009. click here.
|
|
C
A
S
I |
News |
Chart |
SEC
View all notes Alert
me of new notes
Company
Profile
|
ASIA
-
|
$30.16
|
+0.10
|
1,040,135
77% DAV
1,353,800
|
10/14/2009
(Date
Featured) |
$23.05
(Price
Featured) |
PP = $22.19 |
G |
| MB = $23.30 |
Most Recent Note - 12/21/2009 5:50:52 PM
G - Held its ground today after 4 consecutive losses since reaching a new 52-week high. It is extended from any sound base after its considerable gap up gain on 12/07/09 with almost 8 times average volume. Featured 10/14/09 in the mid-day report (read here) as it gapped up for a new 52-week high with 5 times average volume, triggering a technical buy signal by blasting above its pivot point. First featured in the August 2009 CANSLIM.net News (read here).
>>> The latest Featured Stock Update with an annotated graph appeared on 12/7/2009. click here.
|
|
C
A
S
I |
News |
Chart |
SEC
View all notes Alert
me of new notes
Company
Profile
|
BIDU
- NASDAQ
Baidu Inc Ads
INTERNET - Internet Information Providers
|
$407.38
|
-7.02
|
1,134,038
58% DAV
1,946,100
|
9/8/2009
(Date
Featured) |
$351.80
(Price
Featured) |
PP = $440.00 |
G |
| MB = $462.00 |
Most Recent Note - 12/21/2009 6:00:04 PM
G - Loss today on light volume led to further deterioration below its 50 DMA line, raising concerns. Color code was changed to green. It would need to rally above its latest pivot point to trigger a new buy signal. Technically, it has built a sloppy base over 8 weeks. Since quietly rallying to new highs in November it has stalled. BIDU traded up as much as +23% from its price when featured in yellow in the 9/08/09 Mid-Day BreakOuts Report (read here).
>>> The latest Featured Stock Update with an annotated graph appeared on 12/21/2009. click here.
|
|
C
A
S
I |
News |
Chart |
SEC
View all notes Alert
me of new notes
Company
Profile
|
CAAS
- NASDAQ
China Automotive Systems
AUTOMOTIVE - Auto Parts
|
$17.87
|
-1.14
|
895,941
141% DAV
633,200
|
11/30/2009
(Date
Featured) |
$18.84
(Price
Featured) |
PP = $17.62 |
G |
| MB = $18.50 |
Most Recent Note - 12/21/2009 6:03:08 PM
G - Down for a 2nd consecutive session with above average volume as distributional pressure led to a close back under its "max buy" level today. Negative reversals recently raised concerns while it was extended from a sound base under the investment system rules. The Chinese maker of power steering systems was rising from an advanced "3-weeks tight" type of chart pattern as it showed up in yellow in the 11/30/09 mid-day report (read here). Recent quarters show accelerating sales revenues and earnings increases, and it has a good annual earnings history.
>>> The latest Featured Stock Update with an annotated graph appeared on 12/11/2009. click here.
|
|
C
A
S
I |
News |
Chart |
SEC
View all notes Alert
me of new notes
Company
Profile
|
CACC
- NASDAQ
Credit Acceptance Corp
FINANCIAL SERVICES - Credit Services
|
$41.29
|
+1.40
|
64,867
173% DAV
37,500
|
9/29/2009
(Date
Featured) |
$33.48
(Price
Featured) |
PP = $37.10 |
G |
| MB = $38.96 |
Most Recent Note - 12/21/2009 6:05:34 PM
G - Hit another new high today as it rallied with above average volume behind a 7th consecutive gain. Considerable gain on 12/16/09 with almost 6 times average volume triggered a technical buy signal, and color code was changed to green as it got too extended from a sound base. An article in the paper on 12/14 discussed its thin trading and that it can lead to great volatility (read here). Recent chart lows in the $33 area are an important support level to watch now. The Finance - Consumer/Commercial Loans firm has maintained a great track record of annual and quarterly sales revenues and earnings increases. It was featured on 9/29/09 in yellow in the mid-day report (read here
>>> The latest Featured Stock Update with an annotated graph appeared on 12/10/2009. click here.
|
|
C
A
S
I |
News |
Chart |
SEC
View all notes Alert
me of new notes
Company
Profile
|
CRM
- NYSE
Salesforce.com Inc
INTERNET - Internet Software & Services
|
$69.72
|
+1.84
|
2,168,455
136% DAV
1,600,300
|
12/18/2009
(Date
Featured) |
$67.32
(Price
Featured) |
PP = $67.82 |
Y |
| MB = $71.21 |
Most Recent Note - 12/21/2009 6:10:31 PM
Y - Gain today with above average volume for a new 2009 high. Last week it rose from a 5-week flat base above important support at its 50 DMA line. Its 12/18/09 gain with more than +50% above average volume above its prior highs triggered a technical buy signal.
>>> The latest Featured Stock Update with an annotated graph appeared on 12/18/2009. click here.
|
|
C
A
S
I |
News |
Chart |
SEC
View all notes Alert
me of new notes
Company
Profile
|
CTRP
- NASDAQ
Ctrip.com Intl Ltd Adr
LEISURE - Resorts & Casinos
|
$73.31
|
-1.14
|
536,255
49% DAV
1,096,700
|
12/1/2009
(Date
Featured) |
$75.38
(Price
Featured) |
PP = $73.91 |
Y |
| MB = $77.61 |
Most Recent Note - 12/21/2009 6:13:42 PM
Y - Small loss today on light volume, closing below its pivot point, raising some concerns. Featured on 12/01/09 in yellow in the mid-day report (read here). Fundamentally, its sales revenues and earnings increases have shown acceleration in the 3 most recent quarterly comparisons and rose above the +25% guideline. Based on weak technical action it was dropped from the Featured Stocks list on 6/10/08, when it closed at $49.84, yet it has rebounded very impressively from subsequent lows in the $16 area.
>>> The latest Featured Stock Update with an annotated graph appeared on 12/14/2009. click here.
|
|
C
A
S
I |
News |
Chart |
SEC
View all notes Alert
me of new notes
Company
Profile
|
HEAT
-
|
$15.15
|
-0.43
|
897,289
99% DAV
909,700
|
11/17/2009
(Date
Featured) |
$12.00
(Price
Featured) |
PP = $12.61 |
G |
| MB = $13.24 |
Most Recent Note - 12/21/2009 6:14:40 PM
G - Fourth consecutive loss today on near average volume. Consolidating near its 52-week high, extended from its prior base after 3 weekly gains on above average volume in the past 4 weeks. The investment system rules say a stock should be held a minimum of 8 weeks after rising more than +20% in the first 2-3 weeks from being bought. First featured in yellow in the 11/17/09 mid-day report (read here) when technically rising from a "double bottom" base, reaching a new all-time high.
>>> The latest Featured Stock Update with an annotated graph appeared on 12/15/2009. click here.
|
|
C
A
S
I |
News |
Chart |
SEC
View all notes Alert
me of new notes
Company
Profile
|
LFT
-
|
$37.50
|
+0.36
|
225,817
50% DAV
451,000
|
11/17/2009
(Date
Featured) |
$31.77
(Price
Featured) |
PP = $33.04 |
G |
| MB = $34.69 |
Most Recent Note - 12/21/2009 6:24:59 PM
G - Closed in the lower third of its intra-day range today after briefly touching a new all-time high. Extended after recently rising from a choppy 14-week base. Prior chart highs in the $31 area are an initial support level to watch. A proposed offering of additional shares on 11/16/09 seems well received by the market. Its fundamentals remain strong.
>>> The latest Featured Stock Update with an annotated graph appeared on 12/17/2009. click here.
|
|
C
A
S
I |
News |
Chart |
SEC
View all notes Alert
me of new notes
Company
Profile
|
|
|
|
THESE ARE NOT BUY RECOMMENDATIONS!
Comments contained in the body of this report are technical
opinions only. The material herein has been obtained
from sources believed to be reliable and accurate, however,
its accuracy and completeness cannot be guaranteed.
This site is not an investment advisor, hence it does
not endorse or recommend any securities or other investments.
Any recommendation contained in this report may not
be suitable for all investors and it is not to be deemed
an offer or solicitation on our part with respect to
the purchase or sale of any securities. All trademarks,
service marks and trade names appearing in this report
are the property of their respective owners, and are
likewise used for identification purposes only.
This report is a service available
only to active Paid Premium Members.
You may opt-out of receiving report notifications
at any time. Questions or comments may be submitted
by writing to Premium Membership Services 665 S.E. 10 Street, Suite 201 Deerfield Beach, FL 33441-5634 or by calling 1-800-965-8307
or 954-785-1121.
|
|
|


