You are not logged in.
This means you
CAN ONLY VIEW reports that were published prior to Monday, April 14, 2025.
You
MUST UPGRADE YOUR MEMBERSHIP if you want to see any current reports.
AFTER MARKET UPDATE - FRIDAY, DECEMBER 20TH, 2013
Previous After Market Report Next After Market Report >>>
|
|
|
|
DOW |
+42.00 |
16,221.08 |
+0.26% |
|
Volume |
1,951,405,810 |
+184% |
|
Volume |
2,869,140,900 |
+70% |
|
NASDAQ |
+46.61 |
4,104.74 |
+1.15% |
|
Advancers |
2,329 |
74% |
|
Advancers |
1,906 |
71% |
|
S&P 500 |
+8.72 |
1,818.32 |
+0.48% |
|
Decliners |
741 |
23% |
|
Decliners |
723 |
27% |
|
Russell 2000 |
+21.02 |
1,146.47 |
+1.87% |
|
52 Wk Highs |
269 |
|
|
52 Wk Highs |
236 |
|
|
S&P 600 |
+11.72 |
657.41 |
+1.82% |
|
52 Wk Lows |
39 |
|
|
52 Wk Lows |
24 |
|
|
 |
Major Averages Rallied With Greater Volume Conviction
Kenneth J. Gruneisen - Passed the CAN SLIM® Master's Exam
With Friday's advance, the Dow was up +3% for week. The S&P 500 rose +2.4% and the NASDAQ gained +2.6%. The volume totals were much higher on the NYSE and on the Nasdaq exchange, inflated by options expirations. Breadth was positive as advancers led decliners by 3-1 on the NYSE and 13-5 on the Nasdaq exchange. There were 108 high-ranked companies from the CANSLIM.net Leaders List that made new 52-week highs and appeared on the CANSLIM.net BreakOuts Page, solidly up from a total of 62 stocks on the prior session. The list of stocks hitting new 52-week highs expanded and easily outnumbered new lows on the Nasdaq exchange and on the NYSE. There were gains for 15 of the 17 high-ranked companies currently included on the Featured Stocks Page.
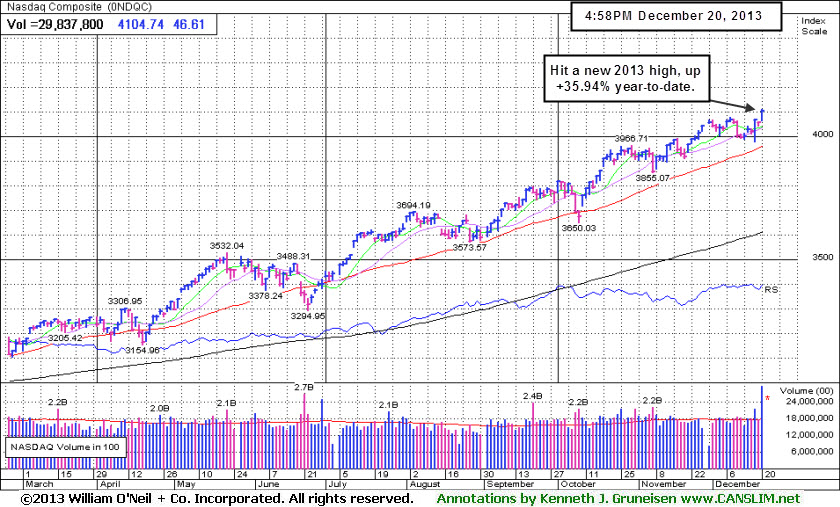
The Dow climbed 42 points to close at a record level of 16,221. The S&P 500 hit a new all-time high, rising 9 points to 1,818. The NASDAQ rallied 47 points to end the week at 4,104. The major averages extended their weekly gains after a report showed the economy grew at a faster pace than previously estimated. Third quarter GDP was revised higher to 4.1%, which is the best level since the final three months of 2011.
Technology helped pace the gains Friday as Red Hat Inc (RHT +14.49%) surged after the company topped earnings estimates and raised its full-year forecast. Shares of Textron Inc (TXT +14.49%) surged following reports the maker of Cessna planes was close to a deal to acquire aircraft manufacturer Beechcraft. The utilities group also was one of the best performing sectors as NiSource Inc (NI +4.32%) and NextEra Energy Inc (NEE +1.30%) rose. Telecommunication stocks lagged behind as CenturyLink Inc (CTL -1.02%) fell.
Treasuries were higher at the long end of the yield curve. The 10-year note rose 11/32 to yield 2.89%. The price of the 30-year bond was up a point and 16/32 to yield 3.82%.
The Market (M criteria) rally has continued producing sufficient leadership (stocks hitting new highs) and the ongoing uptrend remains intact. New buying efforts should always be selective. The CANSLIM.net Featured Stocks Page shows the most action-worthy candidates and their latest notes and a Headline Link directs members to the latest detailed analysis with data-packed graphs annotated by a Certified expert along with links to additional resources. The Premium Member Homepage includes "dynamic archives" to all prior pay reports published. Watch for an announcement via email concerning the next WEBCAST.
PICTURED: The Nasdaq Composite Index rallied to a new 2013 high, up +35.94% year-to-date.
|
 Kenneth J. Gruneisen started out as a licensed stockbroker in August 1987, a couple of months prior to the historic stock market crash that took the Dow Jones Industrial Average down -22.6% in a single day. He has published daily fact-based fundamental and technical analysis on high-ranked stocks online for two decades. Through FACTBASEDINVESTING.COM, Kenneth provides educational articles, news, market commentary, and other information regarding proven investment systems that work in good times and bad.
Comments contained in the body of this report are technical opinions only and are not necessarily those of Gruneisen Growth Corp. The material herein has been obtained from sources believed to be reliable and accurate, however, its accuracy and completeness cannot be guaranteed. Our firm, employees, and customers may effect transactions, including transactions contrary to any recommendation herein, or have positions in the securities mentioned herein or options with respect thereto. Any recommendation contained in this report may not be suitable for all investors and it is not to be deemed an offer or solicitation on our part with respect to the purchase or sale of any securities. |
|
 |
Financial, Tech, and Energy-Related Groups Led Gainers
Kenneth J. Gruneisen - Passed the CAN SLIM® Master's Exam
The Broker/Dealer Index ($XBD +1.75%) was a positive influence on the major averages while the Bank Index ($BKX +0.44%) and Retail Index ($RLX +0.26%) posted smaller gains. The Networking Index ($NWX +1.39%) and the Biotechnology Index ($BTK +1.63%) led the tech sector higher while the Semiconductor Index ($SOX +0.83%) posted a smaller gain. The Oil Services Index ($OSX +0.97%) outpaced the Integrated Oil Index ($XOI +0.23%) as energy-related shares rose. The Gold & Silver Index ($XAU +0.02%) finished flat.
Charts courtesy www.stockcharts.com
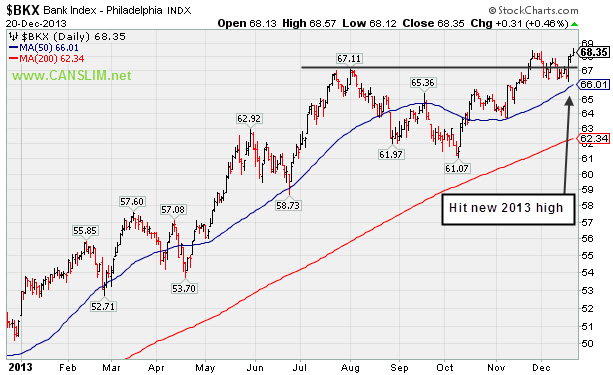
PICTURED: The Bank Index ($BKX +0.44%) hit new 2013 highs.
| Oil Services |
$OSX |
276.21 |
+2.66 |
+0.97% |
+25.46% |
| Integrated Oil |
$XOI |
1,465.41 |
+3.40 |
+0.23% |
+18.00% |
| Semiconductor |
$SOX |
522.09 |
+4.31 |
+0.83% |
+35.94% |
| Networking |
$NWX |
313.69 |
+4.31 |
+1.39% |
+38.47% |
| Broker/Dealer |
$XBD |
157.80 |
+2.72 |
+1.75% |
+67.28% |
| Retail |
$RLX |
931.88 |
+2.44 |
+0.26% |
+42.69% |
| Gold & Silver |
$XAU |
80.43 |
+0.02 |
+0.02% |
-51.43% |
| Bank |
$BKX |
68.34 |
+0.30 |
+0.44% |
+33.27% |
| Biotech |
$BTK |
2,288.55 |
+36.81 |
+1.63% |
+47.93% |
|
|
|
 |
Rallying From Support at 50-Day Moving Average Line
Kenneth J. Gruneisen - Passed the CAN SLIM® Master's Exam
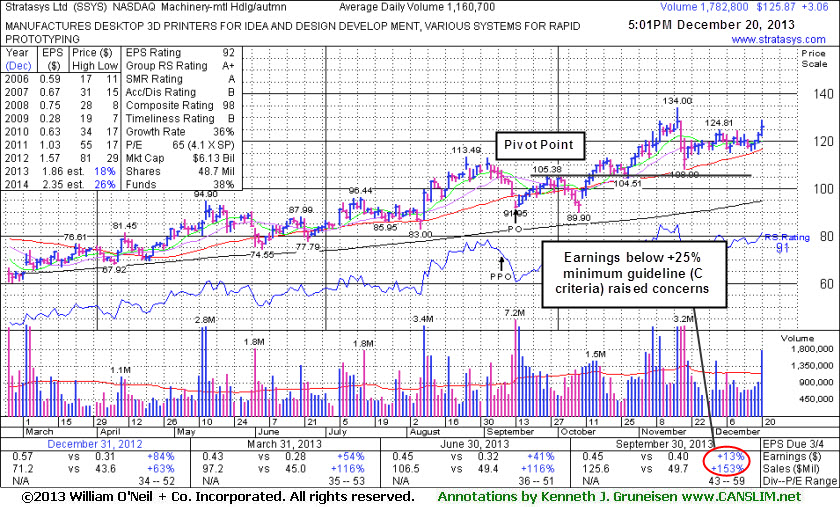
Stratasys Inc (SSYS +$3.06 or +2.49% to $125.87) posted a solid gain with above average volume. It recently has been consolidating above support at its 50-day moving average (DMA) line. More damaging losses would raise greater concerns and trigger worrisome technical sell signals. It remains noted with caution - "Reported earnings +13% on +153% sales revenues, below the +25% minimum earnings guideline (C criteria) raising fundamental concerns." While the fact-based system suggests that any new buying efforts in stocks should be based upon a combination of both fundamental and technical characteristics, sell decisions should be based upon only technical action and not due only to a fundamental disappointment which develops. Therefore, patient investors may give it an opportunity to possibly produce more climactic gains while being watching for technical sell signals.
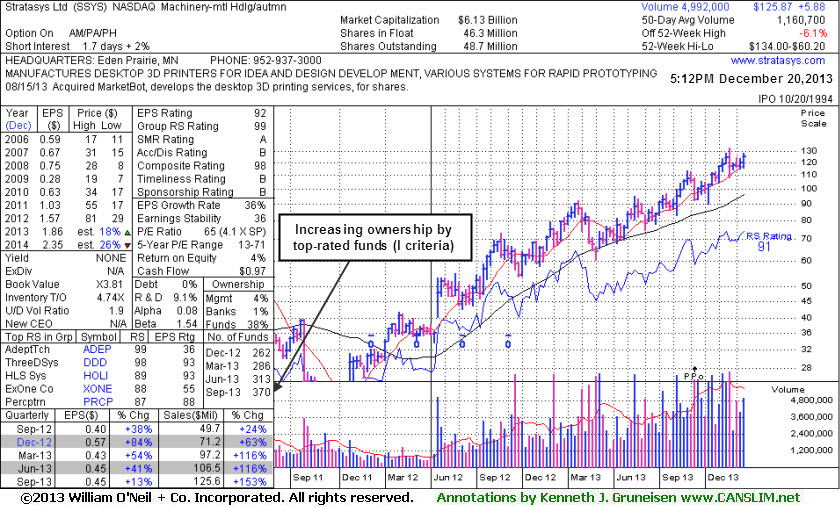
SSYS was last shown in this FSU section on 11/18/13 with annotated daily and weekly graphs under the headline, "Rallying For New Highs Despite Fundamental Flaw Raising Concern", getting extended from a sound base. It completed a new Public Offering on 9/13/13. When it proposed a new Public Offering on 9/09/13 while perched near all-time highs it was noted - "Such offerings can often be a short-term hindrance to upward price progress, however underwriters often help companies attract greater institutional ownership interest in the process." Ownership by top-rated funds rose from 246 in Sep '12 to 351 in Sep '13, a reassuring sign concerning the I criteria (see annotated weekly graph below). However, its Return-on-Equity is now at 4%, below the 17% minimum guideline.
|
|
|
Color Codes Explained :
Y - Better candidates highlighted by our
staff of experts.
G - Previously featured
in past reports as yellow but may no longer be buyable under the
guidelines.
***Last / Change / Volume data in this table is the closing quote data***
Symbol/Exchange
Company Name
Industry Group |
PRICE |
CHANGE
(%Change) |
Day High |
Volume
(% DAV)
(% 50 day avg vol) |
52 Wk Hi
% From Hi |
Featured
Date |
Price
Featured |
Pivot Featured |
|
Max Buy |
CELG
-
NASDAQ
Celgene Corp
DRUGS - Drug Manufacturers - Major
|
$167.48
|
+3.46
2.11% |
$168.00
|
3,375,343
120.68% of 50 DAV
50 DAV is 2,797,000
|
$173.80
-3.64%
|
9/12/2013
|
$149.50
|
PP = $150.02
|
|
MB = $157.52
|
Most Recent Note - 12/18/2013 1:48:58 PM
G - Undercutting prior highs in the $161 area while slumping near its 50 DMA line ($157.11 now) as it retreats from all-time highs with today's 6th consecutive loss. More damaging losses violating the 50 DMA line would raise greater concerns.
>>> FEATURED STOCK ARTICLE : Cooling Volume Totals While Hovering Near Highs - 12/4/2013
View all notes |
Set NEW NOTE alert |
CANSLIM.net Company Profile |
SEC
News |
Chart |
Request a new note
C
A N
S L
I M


|
EGOV
-
NASDAQ
N I C Inc
INTERNET - Internet Software and Services
|
$24.00
|
+0.89
3.85% |
$24.21
|
681,545
242.28% of 50 DAV
50 DAV is 281,300
|
$25.99
-7.66%
|
12/20/2013
|
$24.00
|
PP = $26.09
|
|
MB = $27.39
|
 Most Recent Note - 12/20/2013 5:31:04 PM
Y - Volume-driven gain today helped it rebound above its 50 DMA line improving its technical stance. Color code is changed to yellow with new pivot point cited based on its 10/21/13 high plus 10 cents. Subsequent gains above the pivot with sufficient volume may trigger a new (or add-on) technical buy signal.
>>> FEATURED STOCK ARTICLE : Finding Support Near 50-Day Average During Distributional Pressure - 11/25/2013
View all notes |
Set NEW NOTE alert |
CANSLIM.net Company Profile |
SEC
News |
Chart |
Request a new note
C
A N
S L
I M
|
EQM
-
NYSE
E Q T Midstream Partners
ENERGY - Oil and Gas Pipelines
|
$56.00
|
+1.00
1.82% |
$56.37
|
183,456
140.47% of 50 DAV
50 DAV is 130,600
|
$56.41
-0.73%
|
12/12/2013
|
$53.17
|
PP = $56.51
|
|
MB = $59.34
|
Most Recent Note - 12/20/2013 5:32:36 PM
Y - Challenged its 52-week high with today's gain backed by +40% above average volume. Subsequent volume-driven gains for new highs are needed to trigger a proper technical buy signal.
>>> FEATURED STOCK ARTICLE : Finding Support Near 50-Day Moving Average While Perched Near Highs - 12/13/2013
View all notes |
Set NEW NOTE alert |
CANSLIM.net Company Profile |
SEC
News |
Chart |
Request a new note
C
A N
S L
I M
|
FB
-
NASDAQ
Facebook Inc Cl A
INTERNET
|
$55.12
|
+0.07
0.13% |
$55.15
|
146,178,277
200.91% of 50 DAV
50 DAV is 72,756,800
|
$55.18
-0.11%
|
12/12/2013
|
$51.40
|
PP = $54.93
|
|
MB = $57.68
|
Most Recent Note - 12/19/2013 2:27:16 PM
Y - Pulling back today after wedging to new highs without great volume conviction behind recent gains. Formed a 9-week cup shaped base without a handle. Announced an offering of more than 27 Million new shares and a total of nearly 43 Million existing shares are also being offered by certain selling stockholders including Mark Zuckerberg. Such offerings often are a short-term hindrance to price progress. As of the close of trading on December 20, 2013 the stock will become a component of the S&P 500 Index. FB was highlighted in yellow with pivot point cited based on its 10/18/13 high plus 10 cents in the 12/12/13 mid-day report (read here). Subsequent volume-driven gains above the pivot point are needed to trigger a proper technical buy signal.
>>> FEATURED STOCK ARTICLE : Well Known Social Media Firm on Watch List While Still Base Building - 12/12/2013
View all notes |
Set NEW NOTE alert |
CANSLIM.net Company Profile |
SEC
News |
Chart |
Request a new note
C
A N
S L
I M
|
FLT
-
NYSE
Fleetcor Technologies
DIVERSIFIED SERVICES - Business/Management Services
|
$117.87
|
+0.81
0.69% |
$119.02
|
828,341
101.00% of 50 DAV
50 DAV is 820,100
|
$123.96
-4.91%
|
8/19/2013
|
$99.01
|
PP = $100.97
|
|
MB = $106.02
|
Most Recent Note - 12/17/2013 5:14:48 PM
G - Enduring recent distributional pressure while consolidating above its 50 DMA line. A subsequent violation of that important near-term support level may trigger a technical sell signal. See the latest FSU analysis for more details and new annotated daily and weekly graphs.
>>> FEATURED STOCK ARTICLE : Enduring Distributional Pressure While Extended From Sound Base - 12/17/2013
View all notes |
Set NEW NOTE alert |
CANSLIM.net Company Profile |
SEC
News |
Chart |
Request a new note
C
A N
S L
I M
|
Symbol/Exchange
Company Name
Industry Group |
PRICE |
CHANGE
(%Change) |
Day High |
Volume
(% DAV)
(% 50 day avg vol) |
52 Wk Hi
% From Hi |
Featured
Date |
Price
Featured |
Pivot Featured |
|
Max Buy |
GNRC
-
NYSE
Generac Hldgs Inc
CONSUMER DURABLES - Electronic Equipment
|
$56.07
|
+1.56
2.86% |
$56.39
|
1,151,828
144.36% of 50 DAV
50 DAV is 797,900
|
$55.00
1.95%
|
11/26/2013
|
$53.02
|
PP = $52.42
|
|
MB = $55.04
|
Most Recent Note - 12/20/2013 5:34:34 PM
G - Hit another new 52-week high and rose above its "max buy" level with today's considerable gain backed by +44% above average volume, and its color code is changed to green. Prior highs in the $52 area define initial support to watch on pullbacks.
>>> FEATURED STOCK ARTICLE : Following Latest Breakout Prior Highs Define Support - 11/29/2013
View all notes |
Set NEW NOTE alert |
CANSLIM.net Company Profile |
SEC
News |
Chart |
Request a new note
C
A N
S L
I M
|
HLF
-
NYSE
Herbalife Ltd
DRUGS - Nutrition and Weight Management
|
$80.61
|
+1.03
1.29% |
$81.75
|
3,480,182
129.64% of 50 DAV
50 DAV is 2,684,400
|
$79.95
0.83%
|
11/22/2013
|
$72.21
|
PP = $75.04
|
|
MB = $78.79
|
Most Recent Note - 12/19/2013 1:06:23 PM
G - Hitting another new 52-week high with today's 4th consecutive volume-driven gain, rallying with no resistance due to overhead supply.. Color code is changed to green after rising beyond its "max buy" level.
>>> FEATURED STOCK ARTICLE : Perched Near Highs Following Rebound - 11/22/2013
View all notes |
Set NEW NOTE alert |
CANSLIM.net Company Profile |
SEC
News |
Chart |
Request a new note
C
A N
S L
I M
|
JAZZ
-
NASDAQ
Jazz Pharmaceuticals Plc
DRUGS - Biotechnology
|
$123.91
|
+9.19
8.01% |
$126.84
|
2,104,653
291.22% of 50 DAV
50 DAV is 722,700
|
$121.15
2.28%
|
9/30/2013
|
$93.20
|
PP = $89.10
|
|
MB = $93.56
|
Most Recent Note - 12/20/2013 12:23:16 PM
G - Extended from any sound base, it is off the session's earlier highs after gapping up for a new 52-week high with heavy volume behind its considerable gain. Reported news it will buy Gentium Spa (GENT) for $1 Billion.
>>> FEATURED STOCK ARTICLE : Technically Extended Stock May Be a Dangerous Chase - 12/10/2013
View all notes |
Set NEW NOTE alert |
CANSLIM.net Company Profile |
SEC
News |
Chart |
Request a new note
C
A N
S L
I M
|
KORS
-
NYSE
Michael Kors Hldgs Ltd
RETAIL - Apparel Stores
|
$83.88
|
-0.04
-0.05% |
$84.40
|
8,913,766
194.78% of 50 DAV
50 DAV is 4,576,400
|
$84.58
-0.83%
|
8/6/2013
|
$69.66
|
PP = $66.28
|
|
MB = $69.59
|
Most Recent Note - 12/18/2013 1:57:20 PM
G - Hovering at its 52-week high today and volume totals have been cooling in recent weeks. Did not form a base of sufficient length yet found support at prior highs in the $78 area and stayed above its 50 DMA line during the latest consolidation.
>>> FEATURED STOCK ARTICLE : Consolidation Too Brief To Note New Pivot - 12/6/2013
View all notes |
Set NEW NOTE alert |
CANSLIM.net Company Profile |
SEC
News |
Chart |
Request a new note
C
A N
S L
I M
|
MRLN
-
NASDAQ
Marlin Business Services
DIVERSIFIED SERVICES - Rental and Leasing Services
|
$25.89
|
+0.33
1.29% |
$26.40
|
68,415
293.63% of 50 DAV
50 DAV is 23,300
|
$28.64
-9.60%
|
12/19/2013
|
$26.69
|
PP = $28.74
|
|
MB = $30.18
|
Most Recent Note - 12/20/2013 5:36:32 PM
Y - Posted another gain today with above average volume. Volume-driven gains above the pivot point are needed to trigger a proper new technical buy signal. See the latest FSU analysis for more details and annotated daily and weekly graphs.
>>> FEATURED STOCK ARTICLE : Finished Weak While Enduring Distributional Pressure - 12/19/2013
View all notes |
Set NEW NOTE alert |
CANSLIM.net Company Profile |
SEC
News |
Chart |
Request a new note
C
A N
S L
I M
|
Symbol/Exchange
Company Name
Industry Group |
PRICE |
CHANGE
(%Change) |
Day High |
Volume
(% DAV)
(% 50 day avg vol) |
52 Wk Hi
% From Hi |
Featured
Date |
Price
Featured |
Pivot Featured |
|
Max Buy |
PCLN
-
NASDAQ
Priceline.Com Inc
INTERNET - Internet Software and Services
|
$1,190.95
|
-0.62
-0.05% |
$1,196.69
|
725,117
120.25% of 50 DAV
50 DAV is 603,000
|
$1,198.75
-0.65%
|
12/18/2013
|
$1,156.20
|
PP = $1,198.85
|
|
MB = $1,258.79
|
Most Recent Note - 12/18/2013 2:03:06 PM
Y - Formed an advanced "3-week tight" base, albeit a riskier "late-stage" set-up, and its color code is changed to yellow with new pivot point based on its 11/29/13 high plus 10 cents. Subsequent volume-driven gains above the pivot point may trigger a new (or add-on) technical buy signal. It 50 DMA line defines important support to watch on pullbacks.
>>> FEATURED STOCK ARTICLE : Extended From Any Sound Base Pattern - 12/3/2013
View all notes |
Set NEW NOTE alert |
CANSLIM.net Company Profile |
SEC
News |
Chart |
Request a new note
C
A N
S L
I M
|
SFUN
-
NYSE
Soufun Hldgs Ltd Ads A
INTERNET - Internet Information Providers
|
$77.23
|
+1.22
1.61% |
$77.94
|
703,974
51.58% of 50 DAV
50 DAV is 1,364,900
|
$77.45
-0.28%
|
10/17/2013
|
$58.02
|
PP = $53.87
|
|
MB = $56.56
|
Most Recent Note - 12/17/2013 4:04:42 PM
G - Volume was higher but still below average behind today's gain for a second-best close while challenging its all-time high hit last week. It is extended from any sound base pattern yet may produce more climactic gains. Prior highs and its 50 DMA line coincide in the $59 area defining important support to watch.
>>> FEATURED STOCK ARTICLE : Extended From Base Yet May Produce More Climactic Gains - 12/9/2013
View all notes |
Set NEW NOTE alert |
CANSLIM.net Company Profile |
SEC
News |
Chart |
Request a new note
C
A N
S L
I M
|
SSNC
-
NASDAQ
S S & C Technologies
COMPUTER SOFTWARE and SERVICES - Application Software
|
$42.20
|
+0.99
2.40% |
$42.33
|
344,030
115.45% of 50 DAV
50 DAV is 298,000
|
$43.80
-3.65%
|
10/22/2013
|
$39.17
|
PP = $40.04
|
|
MB = $42.04
|
Most Recent Note - 12/16/2013 5:33:12 PM
G - Today's gain helped it rebound above its 50 DMA line helping its technical stance and outlook improve. See the latest FSU analysis for more details and new annotated daily and weekly graphs.
>>> FEATURED STOCK ARTICLE : Found Prompt Support After Damaging Losses Raised Concerns - 12/16/2013
View all notes |
Set NEW NOTE alert |
CANSLIM.net Company Profile |
SEC
News |
Chart |
Request a new note
C
A N
S L
I M
|
SSYS
-
NASDAQ
Stratasys Ltd
COMPUTER HARDWARE - Computer Peripherals
|
$125.87
|
+3.06
2.49% |
$128.92
|
1,727,569
148.84% of 50 DAV
50 DAV is 1,160,700
|
$134.00
-6.07%
|
10/11/2013
|
$102.94
|
PP = $105.38
|
|
MB = $110.65
|
Most Recent Note - 12/20/2013 5:38:12 PM
G - Posted a gain with above average volume today, rallying from support at its 50 DMA line. See the latest FSU analysis for more details and new annotated daily and weekly graphs. Previously noted with caution - "Reported earnings +13% on +153% sales revenues, below the +25% minimum earnings guideline (C criteria) raising fundamental concerns."
>>> FEATURED STOCK ARTICLE : Rallying From Support at 50-Day Moving Average Line - 12/20/2013
View all notes |
Set NEW NOTE alert |
CANSLIM.net Company Profile |
SEC
News |
Chart |
Request a new note
C
A N
S L
I M
|
ULTI
-
NASDAQ
Ultimate Software Group
INTERNET - Internet Software and Services
|
$151.42
|
+4.29
2.92% |
$153.19
|
297,982
205.22% of 50 DAV
50 DAV is 145,200
|
$162.88
-7.04%
|
10/16/2013
|
$142.95
|
PP = $151.18
|
|
MB = $158.74
|
Most Recent Note - 12/20/2013 5:27:04 PM
G - Rallied near its 50 DMA line today with a volume-driven gain. That short-term average may act as resistance, while a rebound above its 50 DMA line is needed to help its technical stance.
>>> FEATURED STOCK ARTICLE : Consolidating Above 50 DMA Line and Prior Highs Defining Support - 11/21/2013
View all notes |
Set NEW NOTE alert |
CANSLIM.net Company Profile |
SEC
News |
Chart |
Request a new note
C
A N
S L
I M
|
Symbol/Exchange
Company Name
Industry Group |
PRICE |
CHANGE
(%Change) |
Day High |
Volume
(% DAV)
(% 50 day avg vol) |
52 Wk Hi
% From Hi |
Featured
Date |
Price
Featured |
Pivot Featured |
|
Max Buy |
VRX
-
NYSE
Valeant Pharmaceuticals
DRUGS - Drug Manufacturers - Other
|
$112.00
|
+0.10
0.09% |
$112.17
|
1,051,149
98.44% of 50 DAV
50 DAV is 1,067,800
|
$115.40
-2.94%
|
9/11/2013
|
$100.26
|
PP = $105.50
|
|
MB = $110.78
|
Most Recent Note - 12/16/2013 3:42:59 PM
G - Rallying above its 50 DMA line with above average volume behind today's considerable gain, helping its technical stance improve. Recent lows in the $102 area define near-term support where a violation may trigger a technical sell signal. It has been resilient after it reported earnings +24% on +74% sales revenues for the Sep '13 quarter, a notch below the +25% minimum guideline (C criteria).
>>> FEATURED STOCK ARTICLE : Rebounding With Volume Backed Gains But Fundamental Concerns Remain - 12/18/2013
View all notes |
Set NEW NOTE alert |
CANSLIM.net Company Profile |
SEC
News |
Chart |
Request a new note
C
A N
S L
I M
|
YNDX
-
NASDAQ
Yandex N V Class A
INTERNET - Internet Information Providers
|
$40.29
|
+0.61
1.54% |
$40.40
|
2,399,565
89.91% of 50 DAV
50 DAV is 2,669,000
|
$42.00
-4.07%
|
11/27/2013
|
$39.61
|
PP = $42.10
|
|
MB = $44.21
|
Most Recent Note - 12/18/2013 2:07:09 PM
G - Consolidating near its 50 DMA line, stubbornly holding its ground after the damaging 12/11/13 loss raised concerns. Recently noted with caution- "Challenged its 52-week high recently but did not produce the required volume-driven gains above the pivot point to trigger a proper new technical buy signal."
>>> FEATURED STOCK ARTICLE : Forming New Base Pattern With Little Resistance Remaining - 11/27/2013
View all notes |
Set NEW NOTE alert |
CANSLIM.net Company Profile |
SEC
News |
Chart |
Request a new note
C
A N
S L
I M
|
|
|
|
THESE ARE NOT BUY RECOMMENDATIONS!
Comments contained in the body of this report are technical
opinions only. The material herein has been obtained
from sources believed to be reliable and accurate, however,
its accuracy and completeness cannot be guaranteed.
This site is not an investment advisor, hence it does
not endorse or recommend any securities or other investments.
Any recommendation contained in this report may not
be suitable for all investors and it is not to be deemed
an offer or solicitation on our part with respect to
the purchase or sale of any securities. All trademarks,
service marks and trade names appearing in this report
are the property of their respective owners, and are
likewise used for identification purposes only.
This report is a service available
only to active Paid Premium Members.
You may opt-out of receiving report notifications
at any time. Questions or comments may be submitted
by writing to Premium Membership Services 665 S.E. 10 Street, Suite 201 Deerfield Beach, FL 33441-5634 or by calling 1-800-965-8307
or 954-785-1121.
|
|
|

