***Last / Change / Volume data in this table is the closing quote data***
Symbol/Exchange
Company Name
Industry Group |
PRICE |
CHANGE
(%Change) |
Day High |
Volume
(% DAV)
(% 50 day avg vol) |
52 Wk Hi
% From Hi |
Featured
Date |
Price
Featured |
Pivot Featured |
|
Max Buy |
ABV
-
NYSE
Comp De Bebidas Adr
FOOD and BEVERAGE - Beverages - Brewers
|
$146.05
|
+1.04
0.72% |
$147.92
|
436,122
71.03% of 50 DAV
50 DAV is 614,000
|
$146.62
-0.39%
|
12/10/2010
|
$139.87
|
PP = $145.46
|
|
MB = $152.73
|
Most Recent Note - 12/17/2010 5:16:07 PM
Y - Small gap down today with below average volume, yet still perched near its all-time high. As previously noted - "A gain into new high territory with great volume conviction may trigger a new (or add-on) buy signal. Recent lows in the $133 area define important chart support to watch."
>>> The latest Featured Stock Update with an annotated graph appeared on 12/3/2010. Click here.
View all notes |
Alert me of new notes |
CANSLIM.net Company Profile |
SEC |
Zacks Reports |
StockTalk |
News |
Chart |
Request a new note
C
A N
S L
I M


|
ARUN
-
NASDAQ
Aruba Networks Inc
COMPUTER HARDWARE - Networking andamp; Communication Dev
|
$22.49
|
+0.16
0.72% |
$22.87
|
1,751,723
66.63% of 50 DAV
50 DAV is 2,629,200
|
$24.28
-7.37%
|
8/30/2010
|
$18.12
|
PP = $18.51
|
|
MB = $19.44
|
Most Recent Note - 12/17/2010 5:17:30 PM
G - Perched -8% off its 52-week high, consolidating near its 50 DMA line and an upward trendline. See the latest FSU analysis for more details and an annotated graph.
>>> The latest Featured Stock Update with an annotated graph appeared on 12/14/2010. Click here.
View all notes |
Alert me of new notes |
CANSLIM.net Company Profile |
SEC |
Zacks Reports |
StockTalk |
News |
Chart |
Request a new note
C
A N
S L
I M
|
BIDU
-
NASDAQ
Baidu Inc Ads
INTERNET - Internet Information Providers
|
$98.79
|
+0.05
0.05% |
$99.20
|
13,374,469
120.73% of 50 DAV
50 DAV is 11,077,600
|
$115.04
-14.13%
|
12/10/2010
|
$108.00
|
PP = $115.14
|
|
MB = $120.90
|
 Most Recent Note - 12/20/2010 4:38:02 PM
G - Finished near the session high with a small gain on higher volume after a positive reversal today. Last week's violations of its 50 DMA line and prior low ($103.11 on 11/16/10) triggering technical sell signals.
>>> The latest Featured Stock Update with an annotated graph appeared on 11/30/2010. Click here.
View all notes |
Alert me of new notes |
CANSLIM.net Company Profile |
SEC |
Zacks Reports |
StockTalk |
News |
Chart |
Request a new note
C
A N
S L
I M
|
CACC
-
NASDAQ
Credit Acceptance Corp
FINANCIAL SERVICES - Credit Services
|
$61.34
|
-0.47
-0.76% |
$61.85
|
11,636
52.18% of 50 DAV
50 DAV is 22,300
|
$63.45
-3.32%
|
11/22/2010
|
$59.97
|
PP = $62.00
|
|
MB = $65.10
|
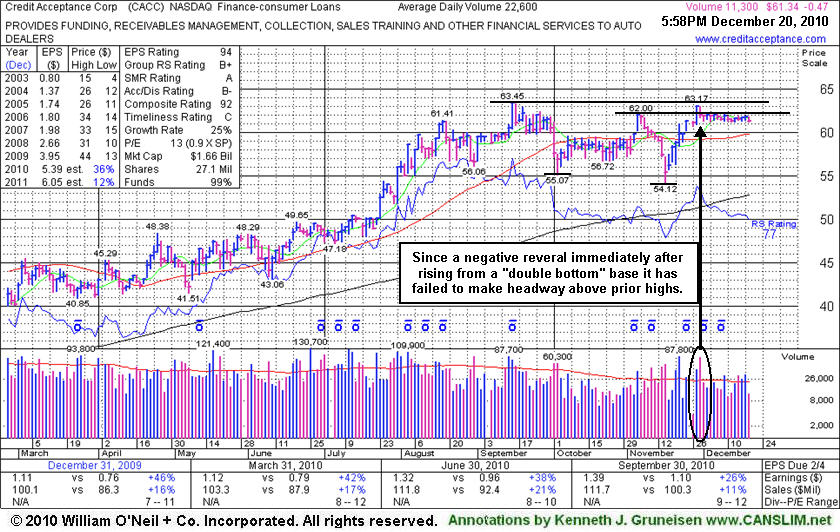
Most Recent Note - 12/20/2010 6:17:50 PM
Y - Still hovering in a very tight range only -3.3% off its 52-week high. See the latest FSU analysis for details and an annotated graph..
>>> The latest Featured Stock Update with an annotated graph appeared on 12/20/2010. Click here.
View all notes |
Alert me of new notes |
CANSLIM.net Company Profile |
SEC |
Zacks Reports |
StockTalk |
News |
Chart |
Request a new note
C
A N
S L
I M
|
CIS
-
NYSE
Camelot Info Systems Ads
COMPUTER SOFTWARE andamp; SERVICES - Information Technology Service
|
$24.11
|
+1.71
7.63% |
$24.30
|
688,107
181.51% of 50 DAV
50 DAV is 379,100
|
$24.89
-3.13%
|
11/26/2010
|
$18.93
|
PP = $19.72
|
|
MB = $20.71
|
Most Recent Note - 12/20/2010 3:10:00 PM
G - Volume is above average behind a second consecutive considerable gain and today it is poised for its second best close ever. After damaging distribution days and a Secondary Offering it found support near prior highs in the $19.50 area.
>>> The latest Featured Stock Update with an annotated graph appeared on 11/26/2010. Click here.
View all notes |
Alert me of new notes |
CANSLIM.net Company Profile |
SEC |
Zacks Reports |
StockTalk |
News |
Chart |
Request a new note
C
A N
S L
I M
|
Symbol/Exchange
Company Name
Industry Group |
PRICE |
CHANGE
(%Change) |
Day High |
Volume
(% DAV)
(% 50 day avg vol) |
52 Wk Hi
% From Hi |
Featured
Date |
Price
Featured |
Pivot Featured |
|
Max Buy |
CMG
-
NYSE
Chipotle Mexican Grill
LEISURE - Restaurants
|
$236.10
|
-1.92
-0.81% |
$240.40
|
685,018
64.64% of 50 DAV
50 DAV is 1,059,700
|
$262.78
-10.15%
|
9/1/2010
|
$158.31
|
PP = $155.52
|
|
MB = $163.30
|
Most Recent Note - 12/17/2010 7:37:38 PM
Y - Color code is changed to yellow after its pulllback to its 10-week moving average, but a new pivot point is not cited as it has not formed a sound new base. See the latest FSU section analysis for details and an annotated graph.
>>> The latest Featured Stock Update with an annotated graph appeared on 12/17/2010. Click here.
View all notes |
Alert me of new notes |
CANSLIM.net Company Profile |
SEC |
Zacks Reports |
StockTalk |
News |
Chart |
Request a new note
C
A N
S L
I M
|
DECK
-
NASDAQ
Deckers Outdoor Corp
CONSUMER NON-DURABLES - Textile - Apparel Footwear
|
$86.46
|
+0.64
0.75% |
$87.88
|
2,083,221
114.51% of 50 DAV
50 DAV is 1,819,300
|
$85.94
0.61%
|
10/27/2010
|
$54.16
|
PP = $54.86
|
|
MB = $57.60
|
Most Recent Note - 12/17/2010 5:38:31 PM
G - Gapped up today, hit a new all-time high and closed near the session high with a solid gain backed by +43% above average volume. Its consolidation was a bit short to be considered a "3-weeks tight" type pattern, so its color code remains green and a new pivot point was not cited. See the latest FSU analysis for details and an annotated graph.
>>> The latest Featured Stock Update with an annotated graph appeared on 12/16/2010. Click here.
View all notes |
Alert me of new notes |
CANSLIM.net Company Profile |
SEC |
Zacks Reports |
StockTalk |
News |
Chart |
Request a new note
C
A N
S L
I M
|
EZCH
-
NASDAQ
Ezchip Semiconductor Ltd
ELECTRONICS - Semiconductor - Specialized
|
$28.27
|
+0.46
1.65% |
$28.48
|
251,128
87.35% of 50 DAV
50 DAV is 287,500
|
$29.73
-4.91%
|
12/2/2010
|
$27.53
|
PP = $26.00
|
|
MB = $27.30
|
Most Recent Note - 12/17/2010 5:40:21 PM
G - This week it spent some time dipping under its "max buy" level while consolidating above prior chart highs in the $26 area that define an important technical support level to watch.
>>> The latest Featured Stock Update with an annotated graph appeared on 12/2/2010. Click here.
View all notes |
Alert me of new notes |
CANSLIM.net Company Profile |
SEC |
Zacks Reports |
StockTalk |
News |
Chart |
Request a new note
C
A N
S L
I M
|
EZPW
-
NASDAQ
Ezcorp Inc Cl A
SPECIALTY RETAIL - Specialty Retail, Other
|
$27.31
|
-0.62
-2.22% |
$28.09
|
541,518
162.28% of 50 DAV
50 DAV is 333,700
|
$28.27
-3.40%
|
11/5/2010
|
$24.02
|
PP = $23.85
|
|
MB = $25.04
|
Most Recent Note - 12/20/2010 12:30:46 PM
G - Hovering near its 52-week high today after finishing last week at a new high close. Stubbornly holding its ground after recent volume-driven gains, extended from a sound base pattern. Its 50 DMA line defines important support
>>> The latest Featured Stock Update with an annotated graph appeared on 11/6/2010. Click here.
View all notes |
Alert me of new notes |
CANSLIM.net Company Profile |
SEC |
Zacks Reports |
StockTalk |
News |
Chart |
Request a new note
C
A N
S L
I M
|
FFIV
-
NASDAQ
F 5 Networks Inc
INTERNET - Internet Software and Services
|
$135.60
|
-0.41
-0.30% |
$136.99
|
2,089,382
69.46% of 50 DAV
50 DAV is 3,007,900
|
$143.75
-5.67%
|
6/16/2010
|
$74.50
|
PP = $74.10
|
|
MB = $77.81
|
Most Recent Note - 12/17/2010 5:43:11 PM
G - Gain today with heavier volume after halting its slide on the prior session. Repeatedly noted as extended from any sound base pattern. Its 50 DMA line defines chart support to watch.
>>> The latest Featured Stock Update with an annotated graph appeared on 11/15/2010. Click here.
View all notes |
Alert me of new notes |
CANSLIM.net Company Profile |
SEC |
Zacks Reports |
StockTalk |
News |
Chart |
Request a new note
C
A N
S L
I M
|
Symbol/Exchange
Company Name
Industry Group |
PRICE |
CHANGE
(%Change) |
Day High |
Volume
(% DAV)
(% 50 day avg vol) |
52 Wk Hi
% From Hi |
Featured
Date |
Price
Featured |
Pivot Featured |
|
Max Buy |
FOSL
-
NASDAQ
Fossil Inc
CONSUMER DURABLES - Recreational Goods, Other
|
$71.87
|
+0.55
0.77% |
$72.23
|
637,438
79.52% of 50 DAV
50 DAV is 801,600
|
$74.34
-3.32%
|
11/26/2010
|
$69.10
|
PP = $70.17
|
|
MB = $73.68
|
Most Recent Note - 12/17/2010 5:44:07 PM
Y - It has been consolidating above prior highs after a technical breakout on 12/02/10 from an advanced "3-weeks tight" pattern.
>>> The latest Featured Stock Update with an annotated graph appeared on 11/29/2010. Click here.
View all notes |
Alert me of new notes |
CANSLIM.net Company Profile |
SEC |
Zacks Reports |
StockTalk |
News |
Chart |
Request a new note
C
A N
S L
I M
|
HMSY
-
NASDAQ
H M S Holdings Corp
COMPUTER SOFTWARE and SERVICES - Healthcare Information Service
|
$65.68
|
+0.06
0.09% |
$66.56
|
156,927
77.96% of 50 DAV
50 DAV is 201,300
|
$67.01
-1.98%
|
11/19/2010
|
$61.89
|
PP = $63.01
|
|
MB = $66.16
|
Most Recent Note - 12/17/2010 5:45:51 PM
G - Rallied with higher volume today after a pullback near prior highs in the $62 that define initial chart support to watch above its 50 DMA line. Its Relative Strength rank has slumped to 74, below the 80+ guideline.
>>> The latest Featured Stock Update with an annotated graph appeared on 11/19/2010. Click here.
View all notes |
Alert me of new notes |
CANSLIM.net Company Profile |
SEC |
Zacks Reports |
StockTalk |
News |
Chart |
Request a new note
C
A N
S L
I M
|
HS
-
NYSE
Healthspring Inc
HEALTH SERVICES - Health Care Plans
|
$26.70
|
-0.20
-0.74% |
$27.02
|
423,317
75.82% of 50 DAV
50 DAV is 558,300
|
$29.80
-10.40%
|
8/27/2010
|
$19.91
|
PP = $19.75
|
|
MB = $20.74
|
Most Recent Note - 12/17/2010 5:50:17 PM
G - It rebounded to close near the session high today after an intra-day violation of its recent low ($26.47 on 11/29/10) raised greater concerns and triggered a more worrisome technical sell signal. Gains above its 50 DMA line are needed for its outlook to improve. Meanwhile its short-term average may act as resistance.
>>> The latest Featured Stock Update with an annotated graph appeared on 12/10/2010. Click here.
View all notes |
Alert me of new notes |
CANSLIM.net Company Profile |
SEC |
Zacks Reports |
StockTalk |
News |
Chart |
Request a new note
C
A N
S L
I M
|
JOBS
-
NASDAQ
Fifty One Job Inc Ads
DIVERSIFIED SERVICES - Staffing and; Outsourcing Service
|
$49.38
|
-0.51
-1.02% |
$51.27
|
274,746
141.18% of 50 DAV
50 DAV is 194,600
|
$55.50
-11.03%
|
10/13/2010
|
$42.07
|
PP = $40.60
|
|
MB = $42.63
|
Most Recent Note - 12/17/2010 5:55:00 PM
G - Posted a small gain today with heavy volume. Recently challenging its all-time high near $55 from 2004, it is extended from any sound base. Recently losses violated a steep upward trendline defining initial support to watch, yet it remains above its 50 DMA line.
>>> The latest Featured Stock Update with an annotated graph appeared on 11/16/2010. Click here.
View all notes |
Alert me of new notes |
CANSLIM.net Company Profile |
SEC |
Zacks Reports |
StockTalk |
News |
Chart |
Request a new note
C
A N
S L
I M
|
LULU
-
NASDAQ
Lululemon Athletica
MANUFACTURING - Textile Manufacturing
|
$73.17
|
-0.12
-0.16% |
$74.60
|
1,515,410
93.43% of 50 DAV
50 DAV is 1,621,900
|
$73.85
-0.92%
|
10/8/2010
|
$47.66
|
PP = $46.67
|
|
MB = $49.00
|
Most Recent Note - 12/17/2010 5:55:59 PM
G - Gain today for another new all-time high and a strong close. Since blasting above its 2007 high it has gotten very extended from any sound base.
>>> The latest Featured Stock Update with an annotated graph appeared on 12/1/2010. Click here.
View all notes |
Alert me of new notes |
CANSLIM.net Company Profile |
SEC |
Zacks Reports |
StockTalk |
News |
Chart |
Request a new note
C
A N
S L
I M
|
Symbol/Exchange
Company Name
Industry Group |
PRICE |
CHANGE
(%Change) |
Day High |
Volume
(% DAV)
(% 50 day avg vol) |
52 Wk Hi
% From Hi |
Featured
Date |
Price
Featured |
Pivot Featured |
|
Max Buy |
MWIV
-
NASDAQ
M W I Veterinary Supply
HEALTH SERVICES - Medical Instruments and; Supplies
|
$63.39
|
+0.40
0.64% |
$64.61
|
65,488
116.94% of 50 DAV
50 DAV is 56,000
|
$63.94
-0.86%
|
11/4/2010
|
$61.79
|
PP = $59.60
|
|
MB = $62.58
|
Most Recent Note - 12/17/2010 6:00:22 PM
G - A late afternoon surge today helped it rally to a new high close with twice its average volume, reconfirming bullish action it showed in recent weeks. Volume totals had been drying up since hitting its all-time high on 11/04/10. Color code is changed to green after closing above its old "max buy" level cited.
>>> The latest Featured Stock Update with an annotated graph appeared on 11/2/2010. Click here.
View all notes |
Alert me of new notes |
CANSLIM.net Company Profile |
SEC |
Zacks Reports |
StockTalk |
News |
Chart |
Request a new note
C
A N
S L
I M
|
NEOG
-
NASDAQ
Neogen Corp
DRUGS - Diagnostic Substances
|
$41.05
|
-0.53
-1.27% |
$41.96
|
73,269
97.95% of 50 DAV
50 DAV is 74,800
|
$41.86
-1.94%
|
9/1/2010
|
$30.79
|
PP = $30.49
|
|
MB = $32.01
|
Most Recent Note - 12/17/2010 6:01:22 PM
G - Gain today with heavier volume for a new all-time high close, extended from any sound base after steadily advancing. Its 50 DMA line has been a reliable support level.
>>> The latest Featured Stock Update with an annotated graph appeared on 12/6/2010. Click here.
View all notes |
Alert me of new notes |
CANSLIM.net Company Profile |
SEC |
Zacks Reports |
StockTalk |
News |
Chart |
Request a new note
C
A N
S L
I M
|
NFLX
-
NASDAQ
Netflix Inc
SPECIALTY RETAIL - Music and Video Stores
|
$178.05
|
-1.97
-1.09% |
$181.05
|
4,659,434
77.75% of 50 DAV
50 DAV is 5,992,900
|
$206.80
-13.90%
|
11/9/2010
|
$173.10
|
PP = $184.84
|
|
MB = $194.08
|
Most Recent Note - 12/17/2010 6:03:11 PM
G - Small loss on heavy volume today, yet staying above important support at its 50 DMA line. Concerns have been raised as it slumped under prior highs in the $184 area after recent negative reversals and distributional pressure, and it violated an upward trendline connecting its July - November lows.
>>> The latest Featured Stock Update with an annotated graph appeared on 11/24/2010. Click here.
View all notes |
Alert me of new notes |
CANSLIM.net Company Profile |
SEC |
Zacks Reports |
StockTalk |
News |
Chart |
Request a new note
C
A N
S L
I M
|
NTAP
-
NASDAQ
Netapp Inc
COMPUTER HARDWARE - Data Storage Devices
|
$55.35
|
+1.55
2.88% |
$55.49
|
5,069,920
76.74% of 50 DAV
50 DAV is 6,606,500
|
$57.96
-4.50%
|
9/8/2010
|
$46.98
|
PP = $44.99
|
|
MB = $47.24
|
Most Recent Note - 12/20/2010 3:13:43 PM
G - Gapped up today after an analyst upgrade, still consolidating above its 50 DMA line and working on a new base. Recent chart lows define support to watch below that important short-term average line.
>>> The latest Featured Stock Update with an annotated graph appeared on 11/3/2010. Click here.
View all notes |
Alert me of new notes |
CANSLIM.net Company Profile |
SEC |
Zacks Reports |
StockTalk |
News |
Chart |
Request a new note
C
A N
S L
I M
|
ORCL
-
NASDAQ
Oracle Corp
COMPUTER SOFTWARE and SERVICES - Application Software
|
$31.68
|
+0.21
0.68% |
$31.58
|
33,545,795
106.84% of 50 DAV
50 DAV is 31,398,800
|
$32.27
-1.84%
|
12/7/2010
|
$29.05
|
PP = $29.92
|
|
MB = $31.42
|
Most Recent Note - 12/20/2010 3:19:38 PM
G - Rising its "max buy" level and poised today for its best close of 2010. After its prior gain with volume nearly 3 times average its color code was changed to green. On 12/17/10 it gapped up after reporting earnings +31% on +47% sales revenues for the quarter ended November 30, 2010 versus the year ago period.
>>> The latest Featured Stock Update with an annotated graph appeared on 11/18/2010. Click here.
View all notes |
Alert me of new notes |
CANSLIM.net Company Profile |
SEC |
Zacks Reports |
StockTalk |
News |
Chart |
Request a new note
C
A N
S L
I M
|
Symbol/Exchange
Company Name
Industry Group |
PRICE |
CHANGE
(%Change) |
Day High |
Volume
(% DAV)
(% 50 day avg vol) |
52 Wk Hi
% From Hi |
Featured
Date |
Price
Featured |
Pivot Featured |
|
Max Buy |
PAY
-
NYSE
Verifone Systems Inc
COMPUTER HARDWARE - Transaction Automation Systems
|
$39.27
|
-0.84
-2.09% |
$40.64
|
1,224,575
84.44% of 50 DAV
50 DAV is 1,450,200
|
$41.47
-5.31%
|
11/29/2010
|
$33.96
|
PP = $36.04
|
|
MB = $37.84
|
Most Recent Note - 12/20/2010 4:31:46 PM
G - Closed near the session low with its 4th consecutive loss, consolidating -5.3% off its all-time high. Prior high in the $36 area defines initial chart support to watch above its 50 DMA line.
>>> The latest Featured Stock Update with an annotated graph appeared on 12/15/2010. Click here.
View all notes |
Alert me of new notes |
CANSLIM.net Company Profile |
SEC |
Zacks Reports |
StockTalk |
News |
Chart |
Request a new note
C
A N
S L
I M
|
RAX
-
NYSE
Rackspace Hosting Inc
INTERNET - Internet Software and; Services
|
$30.98
|
-0.76
-2.39% |
$32.00
|
1,739,943
83.34% of 50 DAV
50 DAV is 2,087,800
|
$32.69
-5.23%
|
9/21/2010
|
$22.84
|
PP = $23.61
|
|
MB = $24.79
|
Most Recent Note - 12/20/2010 3:24:51 PM
G - After a new high close, today's loss is erasing the prior session's gain. Hovering near its all-time high, no resistance remains due to overhead supply, but it is extended from any sound base.
>>> The latest Featured Stock Update with an annotated graph appeared on 11/17/2010. Click here.
View all notes |
Alert me of new notes |
CANSLIM.net Company Profile |
SEC |
Zacks Reports |
StockTalk |
News |
Chart |
Request a new note
C
A N
S L
I M
|
ROVI
-
NASDAQ
Rovi Corp
COMPUTER SOFTWARE andamp; SERVICES - Security Software andamp; Services
|
$57.04
|
-0.20
-0.35% |
$57.53
|
759,730
70.01% of 50 DAV
50 DAV is 1,085,100
|
$58.68
-2.79%
|
10/29/2010
|
$49.99
|
PP = $53.10
|
|
MB = $55.76
|
Most Recent Note - 12/17/2010 6:12:31 PM
G - Small loss today with heavy volume was a sign of distributional pressure. It is extended from its latest base after wedging to highs without great volume conviction. Prior chart highs and its 50 DMA line define important support to watch.
>>> The latest Featured Stock Update with an annotated graph appeared on 12/13/2010. Click here.
View all notes |
Alert me of new notes |
CANSLIM.net Company Profile |
SEC |
Zacks Reports |
StockTalk |
News |
Chart |
Request a new note
C
A N
S L
I M
|
SHOO
-
NASDAQ
Steven Madden Limited
CONSUMER NON-DURABLES - Textile - Apparel Footwear
|
$44.99
|
-0.06
-0.13% |
$45.64
|
274,025
73.27% of 50 DAV
50 DAV is 374,000
|
$47.69
-5.66%
|
11/23/2010
|
$44.61
|
PP = $44.95
|
|
MB = $47.20
|
Most Recent Note - 12/17/2010 6:13:29 PM
G - Held its ground after a considerable gain helped it rebound back above its old high closes this week, a sign of prompt support near its 50 DMA line again.
>>> The latest Featured Stock Update with an annotated graph appeared on 11/23/2010. Click here.
View all notes |
Alert me of new notes |
CANSLIM.net Company Profile |
SEC |
Zacks Reports |
StockTalk |
News |
Chart |
Request a new note
C
A N
S L
I M
|
SLW
-
NYSE
Silver Wheaton Corp
METALS and; MINING - Silver
|
$37.85
|
+1.15
3.13% |
$37.74
|
7,310,847
71.62% of 50 DAV
50 DAV is 10,207,600
|
$42.34
-10.60%
|
8/25/2010
|
$21.40
|
PP = $21.99
|
|
MB = $23.09
|
Most Recent Note - 12/20/2010 3:22:07 PM
G - Small gain today with light volume is following losses last week with above average volume which were noted as indicative distributional pressure. Repeatedly noted as extended from any sound base, consolidating after a negative reversal at an all-time high on 12/07/10. Prior chart highs in the $36-37 area define initial support well above its 50 DMA line.
>>> The latest Featured Stock Update with an annotated graph appeared on 12/8/2010. Click here.
View all notes |
Alert me of new notes |
CANSLIM.net Company Profile |
SEC |
Zacks Reports |
StockTalk |
News |
Chart |
Request a new note
C
A N
S L
I M
|
Symbol/Exchange
Company Name
Industry Group |
PRICE |
CHANGE
(%Change) |
Day High |
Volume
(% DAV)
(% 50 day avg vol) |
52 Wk Hi
% From Hi |
Featured
Date |
Price
Featured |
Pivot Featured |
|
Max Buy |
UA
-
NYSE
Under Armour Inc Cl A
CONSUMER NON-DURABLES - Textile - Apparel Clothing
|
$57.23
|
-0.05
-0.09% |
$58.42
|
494,577
67.19% of 50 DAV
50 DAV is 736,100
|
$60.14
-4.84%
|
9/9/2010
|
$39.99
|
PP = $40.10
|
|
MB = $42.11
|
Most Recent Note - 12/17/2010 6:22:43 PM
G - Gains on near average volume halted its slide after considerable losses with heavier volume this week were noted as distributional pressure. The high-ranked Apparel - Clothing firm was repeatedly noted as extended from any sound base and well above support at its 50 DMA line.
>>> The latest Featured Stock Update with an annotated graph appeared on 11/4/2010. Click here.
View all notes |
Alert me of new notes |
CANSLIM.net Company Profile |
SEC |
Zacks Reports |
StockTalk |
News |
Chart |
Request a new note
C
A N
S L
I M
|
ULTA
-
NASDAQ
Ulta Salon Cosm & Frag
SPECIALTY RETAIL - Specialty Retail, Other
|
$33.03
|
-0.12
-0.36% |
$33.80
|
615,109
117.07% of 50 DAV
50 DAV is 525,400
|
$37.24
-11.31%
|
9/3/2010
|
$26.36
|
PP = $25.89
|
|
MB = $27.18
|
Most Recent Note - 12/17/2010 6:24:13 PM
G - Down today on heavier volume, a sign of distributional pressure while slumping back toward its 50 DMA line which previously acted as support.
>>> The latest Featured Stock Update with an annotated graph appeared on 11/1/2010. Click here.
View all notes |
Alert me of new notes |
CANSLIM.net Company Profile |
SEC |
Zacks Reports |
StockTalk |
News |
Chart |
Request a new note
C
A N
S L
I M
|
VIT
-
NYSE
Vanceinfo Tech Inc Ads
COMPUTER SOFTWARE and SERVICES - Business Software and Services
|
$35.28
|
+0.37
1.06% |
$35.55
|
644,862
96.10% of 50 DAV
50 DAV is 671,000
|
$41.06
-14.08%
|
7/8/2010
|
$25.20
|
PP = $26.58
|
|
MB = $27.91
|
Most Recent Note - 12/17/2010 6:25:55 PM
G - Small gains with light volume followed damaging losses and it remains below its 50 DMA line. Endured worrisome distributional pressure and its Relative Strength has slumped since it completed a Public Offering on 11/23/10.
>>> The latest Featured Stock Update with an annotated graph appeared on 12/9/2010. Click here.
View all notes |
Alert me of new notes |
CANSLIM.net Company Profile |
SEC |
Zacks Reports |
StockTalk |
News |
Chart |
Request a new note
C
A N
S L
I M
|