You are not logged in.
This means you
CAN ONLY VIEW reports that were published prior to Monday, April 14, 2025.
You
MUST UPGRADE YOUR MEMBERSHIP if you want to see any current reports.
AFTER MARKET UPDATE - THURSDAY, DECEMBER 19TH, 2013
Previous After Market Report Next After Market Report >>>
|
|
|
|
DOW |
+11.11 |
16,179.08 |
+0.07% |
|
Volume |
687,888,650 |
-21% |
|
Volume |
1,684,068,300 |
-18% |
|
NASDAQ |
-11.93 |
4,058.13 |
-0.29% |
|
Advancers |
1,307 |
42% |
|
Advancers |
966 |
36% |
|
S&P 500 |
-1.05 |
1,809.60 |
-0.06% |
|
Decliners |
1,751 |
56% |
|
Decliners |
1,602 |
60% |
|
Russell 2000 |
-8.27 |
1,125.45 |
-0.73% |
|
52 Wk Highs |
160 |
|
|
52 Wk Highs |
130 |
|
|
S&P 600 |
-5.30 |
645.69 |
-0.81% |
|
52 Wk Lows |
87 |
|
|
52 Wk Lows |
23 |
|
|
 |
Major Averages Ended Mixed and Little Changed on Lighter Volume
Kenneth J. Gruneisen - Passed the CAN SLIM® Master's Exam
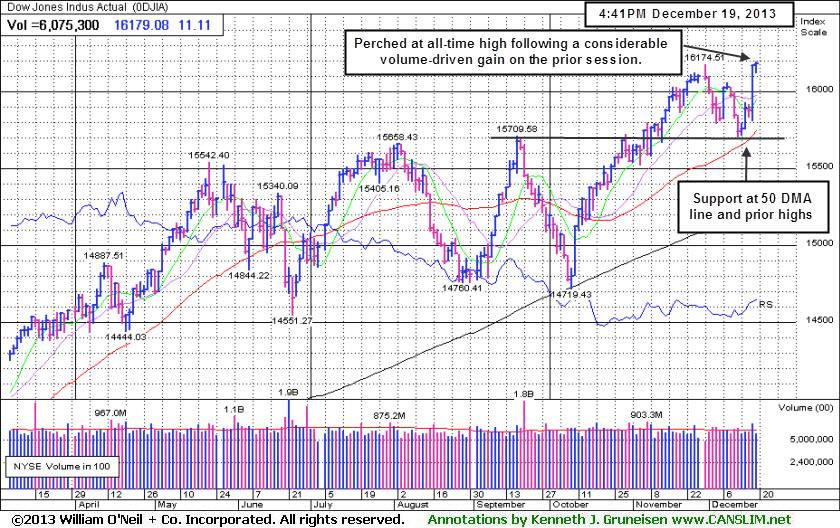
The major averages finished mixed and closed near their best levels of Thursday's session. The volume totals were lighter on the NYSE and on the Nasdaq exchange. Breadth was negative as decliners led advancers by 8-7 on the NYSE and 8-5 on the Nasdaq exchange. There were 62 high-ranked companies from the CANSLIM.net Leaders List that made new 52-week highs and appeared on the CANSLIM.net BreakOuts Page, down from a total of 70 stocks on the prior session. The list of stocks hitting new 52-week highs outnumbered new lows on the Nasdaq exchange and on the NYSE. There were gains for 7 of the 17 high-ranked companies currently included on the Featured Stocks Page.
The S&P 500 gave up just 1 point to 1,809 and the NASDAQ was lower by 11 points with the index closing at 4,058. Stocks were choppy throughout the session as investors took a breather following Wednesday’s rally. The latest economic data was largely disappointing with weekly jobless claims and November existing home sales falling short of estimates.
Sector action on the S&P was mixed. Tech stocks showed some strength following some better-than-anticipated corporate earnings. Oracle Corp (ORCL +5.78%) rose after the company reported results that topped analysts’ expectations. In other news, shares of Target Corp (TGT -2.2%) fell as the company confirmed that about 40 million customers' debit and credit card information may have been compromised between November 27th and December 15th.
Turning to fixed income markets, Treasuries were mixed along the curve. The benchmark 10-year note was down 11/32 to yield 2.93% and the 30-year bond gained 1/32 to yield 3.90%.
The Market (M criteria) rally has managed to overcome recent distributional pressure while still producing sufficient leadership (stocks hitting new highs) to maintain the ongoing uptrend. New buying efforts should always be selective. The CANSLIM.net Featured Stocks Page shows the most action-worthy candidates and their latest notes and a Headline Link directs members to the latest detailed analysis with data-packed graphs annotated by a Certified expert along with links to additional resources. The Premium Member Homepage includes "dynamic archives" to all prior pay reports published. Watch for an announcement via email concerning the next WEBCAST.
PICTURED: The Dow Jones Industrial Average gained 11 points to 16,179 after being down by as many 46 points earlier. The Blue Chip index rallied to new all-time highs from support at its 50-day moving average (DMA) line and prior highs while volume increased to well above average behind the prior session's big gain.
|
 Kenneth J. Gruneisen started out as a licensed stockbroker in August 1987, a couple of months prior to the historic stock market crash that took the Dow Jones Industrial Average down -22.6% in a single day. He has published daily fact-based fundamental and technical analysis on high-ranked stocks online for two decades. Through FACTBASEDINVESTING.COM, Kenneth provides educational articles, news, market commentary, and other information regarding proven investment systems that work in good times and bad.
Comments contained in the body of this report are technical opinions only and are not necessarily those of Gruneisen Growth Corp. The material herein has been obtained from sources believed to be reliable and accurate, however, its accuracy and completeness cannot be guaranteed. Our firm, employees, and customers may effect transactions, including transactions contrary to any recommendation herein, or have positions in the securities mentioned herein or options with respect thereto. Any recommendation contained in this report may not be suitable for all investors and it is not to be deemed an offer or solicitation on our part with respect to the purchase or sale of any securities. |
|
 |
Tech and Commodity-Linked Groups Pulled Back
Kenneth J. Gruneisen - Passed the CAN SLIM® Master's Exam
The Bank Index ($BKX +0.07%) held its ground while the Broker/Dealer Index ($XBD -0.57%) and the Retail Index ($RLX -0.28%) ended with small losses. The Semiconductor Index ($SOX -0.63%) led the tech sector's retreat while the Biotechnology Index ($BTK -0.22%) and Networking Index ($NWX -0.19%) edged lower. Commodity-linked groups lagged as the Gold & Silver Index ($XAU -1.45%) and the Oil Services Index ($OSX -0.85%) fell and the Integrated Oil Index ($XOI -0.02%) finished flat.
Charts courtesy www.stockcharts.com
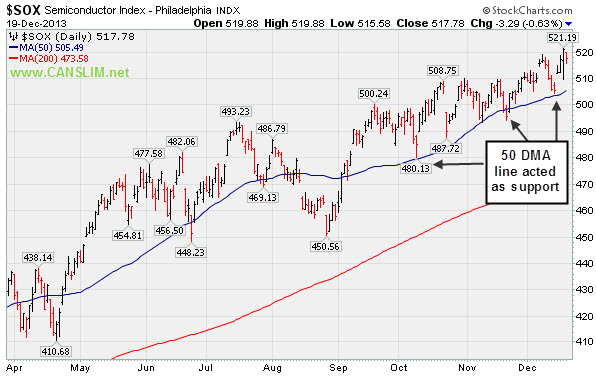
PICTURED: The Semiconductor Index ($SOX -0.63%) found support near its 50-day moving average (DMA) line in recent months.
| Oil Services |
$OSX |
273.55 |
-2.34 |
-0.85% |
+24.25% |
| Integrated Oil |
$XOI |
1,462.02 |
-0.31 |
-0.02% |
+17.73% |
| Semiconductor |
$SOX |
517.78 |
-3.29 |
-0.63% |
+34.82% |
| Networking |
$NWX |
309.38 |
-0.58 |
-0.19% |
+36.56% |
| Broker/Dealer |
$XBD |
155.08 |
-0.89 |
-0.57% |
+64.41% |
| Retail |
$RLX |
929.44 |
-2.57 |
-0.28% |
+42.32% |
| Gold & Silver |
$XAU |
80.41 |
-1.18 |
-1.45% |
-51.44% |
| Bank |
$BKX |
68.04 |
+0.05 |
+0.07% |
+32.68% |
| Biotech |
$BTK |
2,251.74 |
-5.03 |
-0.22% |
+45.55% |
|
|
|
 |
Finished Weak While Enduring Distributional Pressure
Kenneth J. Gruneisen - Passed the CAN SLIM® Master's Exam
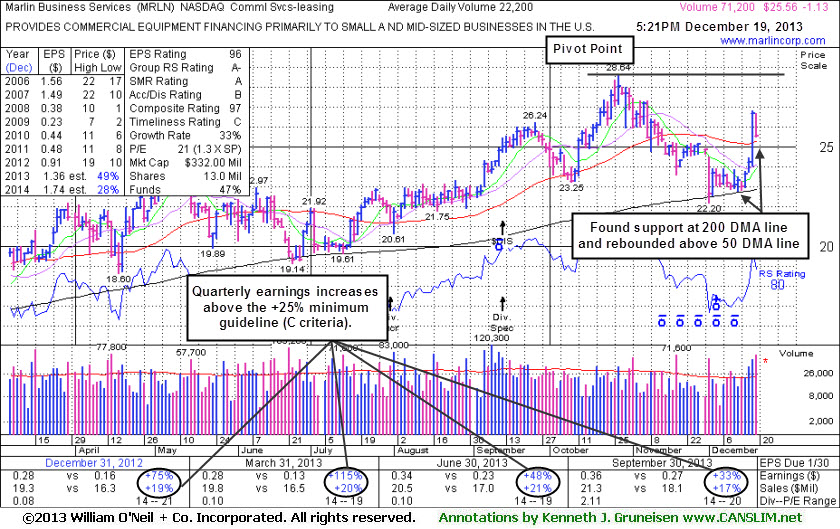
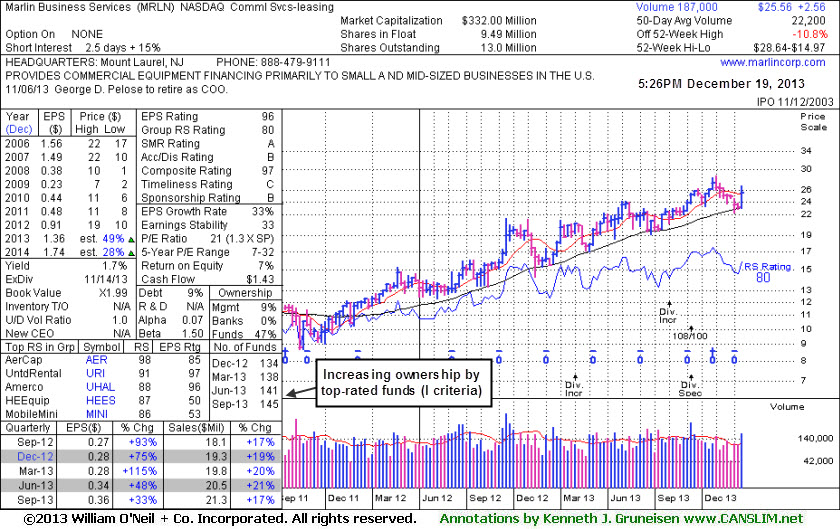
Marlin Business Services (MRLN -$1.13 or -4.29% to $25.56) encountered distributional pressure today and ended near the session low with a loss on more than 3 times average volume. It returned to the Featured Stocks list when it was highlighted in yellow in the earlier mid-day report (read here) with new pivot point cited based on its 10/28/13 high plus 10 cents. It traded up considerably this week with above average volume behind 4 consecutive gains, rebounding from below its 50-day moving average (DMA) line and helping its technical stance improve. Disciplined investors may watch for subsequent volume-driven gains above the pivot point which are needed to trigger a proper new technical buy signal.
Fundamentals remain strong (C and A criteria) since dropped from the Featured Stocks list on 12/02/13 its found support at its 200 DMA line. It was last shown in this FSU section on 11/14/13 under the headline, "Violated 50-Day Moving Average Line Raising Concerns." MRLN hails from the Commercial Services - Leasing group which now has a mediocre 57 Group Relative Strength Rating, not a strong sign concerning the L criteria. Return-On-Equity at 7% is also below the 17% minimum guideline. It is now trading -14% off its 52-week high, facing recently created resistance due to overhead supply. A fresh buy candidate breaking out with volume conviction, meanwhile, would be unhindered by any anxious sellers.
With only 9.49 million shares (S criteria) in the publicly traded float it may be particularly volatile in the event of any institutional buying or selling. The number of top-rated funds owning its shares rose from 111 in Mar '12 to 145 in Sep '13, a reassuring sign concerning the I criteria.
|
|
|
Color Codes Explained :
Y - Better candidates highlighted by our
staff of experts.
G - Previously featured
in past reports as yellow but may no longer be buyable under the
guidelines.
***Last / Change / Volume data in this table is the closing quote data***
Symbol/Exchange
Company Name
Industry Group |
PRICE |
CHANGE
(%Change) |
Day High |
Volume
(% DAV)
(% 50 day avg vol) |
52 Wk Hi
% From Hi |
Featured
Date |
Price
Featured |
Pivot Featured |
|
Max Buy |
CELG
-
NASDAQ
Celgene Corp
DRUGS - Drug Manufacturers - Major
|
$164.02
|
+1.54
0.95% |
$164.30
|
2,166,424
75.73% of 50 DAV
50 DAV is 2,860,900
|
$173.80
-5.63%
|
9/12/2013
|
$149.50
|
PP = $150.02
|
|
MB = $157.52
|
Most Recent Note - 12/18/2013 1:48:58 PM
G - Undercutting prior highs in the $161 area while slumping near its 50 DMA line ($157.11 now) as it retreats from all-time highs with today's 6th consecutive loss. More damaging losses violating the 50 DMA line would raise greater concerns.
>>> FEATURED STOCK ARTICLE : Cooling Volume Totals While Hovering Near Highs - 12/4/2013
View all notes |
Set NEW NOTE alert |
CANSLIM.net Company Profile |
SEC
News |
Chart |
Request a new note
C
A N
S L
I M


|
EGOV
-
NASDAQ
N I C Inc
INTERNET - Internet Software and Services
|
$23.11
|
-0.15
-0.64% |
$23.51
|
136,784
48.42% of 50 DAV
50 DAV is 282,500
|
$25.99
-11.08%
|
10/18/2013
|
$25.17
|
PP = $23.66
|
|
MB = $24.84
|
Most Recent Note - 12/18/2013 1:50:55 PM
G - Still sputtering below its 50 DMA line, and the longer it lingers below that important short-term average the worse its outlook gets. Disciplined investors always limit losses by selling any stock that falls more than -7% from their purchase price.
>>> FEATURED STOCK ARTICLE : Finding Support Near 50-Day Average During Distributional Pressure - 11/25/2013
View all notes |
Set NEW NOTE alert |
CANSLIM.net Company Profile |
SEC
News |
Chart |
Request a new note
C
A N
S L
I M
|
EQM
-
NYSE
E Q T Midstream Partners
ENERGY - Oil and Gas Pipelines
|
$55.00
|
+0.21
0.38% |
$55.16
|
111,651
85.89% of 50 DAV
50 DAV is 130,000
|
$56.41
-2.50%
|
12/12/2013
|
$53.17
|
PP = $56.51
|
|
MB = $59.34
|
Most Recent Note - 12/18/2013 1:51:57 PM
Y - Posting a big gain today while still quietly consolidating above important support at its 50 DMA line and prior highs in the $51 area. Subsequent volume-driven gains for new highs are needed to trigger a proper technical buy signal.
>>> FEATURED STOCK ARTICLE : Finding Support Near 50-Day Moving Average While Perched Near Highs - 12/13/2013
View all notes |
Set NEW NOTE alert |
CANSLIM.net Company Profile |
SEC
News |
Chart |
Request a new note
C
A N
S L
I M
|
FB
-
NASDAQ
Facebook Inc Cl A
INTERNET
|
$55.05
|
-0.52
-0.94% |
$55.19
|
89,709,939
121.38% of 50 DAV
50 DAV is 73,906,300
|
$55.18
-0.24%
|
12/12/2013
|
$51.40
|
PP = $54.93
|
|
MB = $57.68
|
 Most Recent Note - 12/19/2013 2:27:16 PM
Y - Pulling back today after wedging to new highs without great volume conviction behind recent gains. Formed a 9-week cup shaped base without a handle. Announced an offering of more than 27 Million new shares and a total of nearly 43 Million existing shares are also being offered by certain selling stockholders including Mark Zuckerberg. Such offerings often are a short-term hindrance to price progress. As of the close of trading on December 20, 2013 the stock will become a component of the S&P 500 Index. FB was highlighted in yellow with pivot point cited based on its 10/18/13 high plus 10 cents in the 12/12/13 mid-day report (read here). Subsequent volume-driven gains above the pivot point are needed to trigger a proper technical buy signal.
>>> FEATURED STOCK ARTICLE : Well Known Social Media Firm on Watch List While Still Base Building - 12/12/2013
View all notes |
Set NEW NOTE alert |
CANSLIM.net Company Profile |
SEC
News |
Chart |
Request a new note
C
A N
S L
I M
|
FLT
-
NYSE
Fleetcor Technologies
DIVERSIFIED SERVICES - Business/Management Services
|
$117.06
|
-2.06
-1.73% |
$119.26
|
563,430
67.53% of 50 DAV
50 DAV is 834,400
|
$123.96
-5.57%
|
8/19/2013
|
$99.01
|
PP = $100.97
|
|
MB = $106.02
|
Most Recent Note - 12/17/2013 5:14:48 PM
G - Enduring recent distributional pressure while consolidating above its 50 DMA line. A subsequent violation of that important near-term support level may trigger a technical sell signal. See the latest FSU analysis for more details and new annotated daily and weekly graphs.
>>> FEATURED STOCK ARTICLE : Enduring Distributional Pressure While Extended From Sound Base - 12/17/2013
View all notes |
Set NEW NOTE alert |
CANSLIM.net Company Profile |
SEC
News |
Chart |
Request a new note
C
A N
S L
I M
|
Symbol/Exchange
Company Name
Industry Group |
PRICE |
CHANGE
(%Change) |
Day High |
Volume
(% DAV)
(% 50 day avg vol) |
52 Wk Hi
% From Hi |
Featured
Date |
Price
Featured |
Pivot Featured |
|
Max Buy |
GNRC
-
NYSE
Generac Hldgs Inc
CONSUMER DURABLES - Electronic Equipment
|
$54.51
|
-0.36
-0.66% |
$54.76
|
505,696
63.02% of 50 DAV
50 DAV is 802,500
|
$55.00
-0.89%
|
11/26/2013
|
$53.02
|
PP = $52.42
|
|
MB = $55.04
|
Most Recent Note - 12/18/2013 2:39:28 PM
Y - Hitting a new 52-week high with today's 3rd consecutive gain on light volume. Prior highs in the $52 area define initial support to watch on pullbacks.
>>> FEATURED STOCK ARTICLE : Following Latest Breakout Prior Highs Define Support - 11/29/2013
View all notes |
Set NEW NOTE alert |
CANSLIM.net Company Profile |
SEC
News |
Chart |
Request a new note
C
A N
S L
I M
|
HLF
-
NYSE
Herbalife Ltd
DRUGS - Nutrition and Weight Management
|
$79.58
|
+1.58
2.03% |
$79.95
|
4,044,772
152.74% of 50 DAV
50 DAV is 2,648,200
|
$78.50
1.38%
|
11/22/2013
|
$72.21
|
PP = $75.04
|
|
MB = $78.79
|
Most Recent Note - 12/19/2013 1:06:23 PM
G - Hitting another new 52-week high with today's 4th consecutive volume-driven gain, rallying with no resistance due to overhead supply.. Color code is changed to green after rising beyond its "max buy" level.
>>> FEATURED STOCK ARTICLE : Perched Near Highs Following Rebound - 11/22/2013
View all notes |
Set NEW NOTE alert |
CANSLIM.net Company Profile |
SEC
News |
Chart |
Request a new note
C
A N
S L
I M
|
JAZZ
-
NASDAQ
Jazz Pharmaceuticals Plc
DRUGS - Biotechnology
|
$114.72
|
+0.98
0.86% |
$115.85
|
387,226
52.12% of 50 DAV
50 DAV is 742,900
|
$121.15
-5.31%
|
9/30/2013
|
$93.20
|
PP = $89.10
|
|
MB = $93.56
|
Most Recent Note - 12/16/2013 12:37:13 PM
G - Enduring distributional pressure and retreating from its 52-week high with higher volume behind today's loss. Recently noted as "extended from any sound base" with near-term support to watch at its 50 DMA line (now $100.85).
>>> FEATURED STOCK ARTICLE : Technically Extended Stock May Be a Dangerous Chase - 12/10/2013
View all notes |
Set NEW NOTE alert |
CANSLIM.net Company Profile |
SEC
News |
Chart |
Request a new note
C
A N
S L
I M
|
KORS
-
NYSE
Michael Kors Hldgs Ltd
RETAIL - Apparel Stores
|
$83.92
|
-0.27
-0.32% |
$84.58
|
1,883,778
40.84% of 50 DAV
50 DAV is 4,612,500
|
$84.40
-0.57%
|
8/6/2013
|
$69.66
|
PP = $66.28
|
|
MB = $69.59
|
Most Recent Note - 12/18/2013 1:57:20 PM
G - Hovering at its 52-week high today and volume totals have been cooling in recent weeks. Did not form a base of sufficient length yet found support at prior highs in the $78 area and stayed above its 50 DMA line during the latest consolidation.
>>> FEATURED STOCK ARTICLE : Consolidation Too Brief To Note New Pivot - 12/6/2013
View all notes |
Set NEW NOTE alert |
CANSLIM.net Company Profile |
SEC
News |
Chart |
Request a new note
C
A N
S L
I M
|
MRLN
-
NASDAQ
Marlin Business Services
DIVERSIFIED SERVICES - Rental and Leasing Services
|
$25.56
|
-1.13
-4.23% |
$26.71
|
71,741
323.16% of 50 DAV
50 DAV is 22,200
|
$28.64
-10.75%
|
12/19/2013
|
$26.69
|
PP = $28.74
|
|
MB = $30.18
|
Most Recent Note - 12/19/2013 5:44:39 PM
Y - Finished weak today after highlighted in yellow with new pivot point cited based on its 10/28/13 high plus 10 cents. Up considerably this week with above average volume behind 4 consecutive gains, rebounding from below its 50 DMA line helping its technical stance improve. Volume-driven gains above the pivot point are needed to trigger a proper new technical buy signal. See the latest FSU analysis for more details and new annotated daily and weekly graphs.
>>> FEATURED STOCK ARTICLE : Finished Weak While Enduring Distributional Pressure - 12/19/2013
View all notes |
Set NEW NOTE alert |
CANSLIM.net Company Profile |
SEC
News |
Chart |
Request a new note
C
A N
S L
I M
|
Symbol/Exchange
Company Name
Industry Group |
PRICE |
CHANGE
(%Change) |
Day High |
Volume
(% DAV)
(% 50 day avg vol) |
52 Wk Hi
% From Hi |
Featured
Date |
Price
Featured |
Pivot Featured |
|
Max Buy |
PCLN
-
NASDAQ
Priceline.Com Inc
INTERNET - Internet Software and Services
|
$1,191.57
|
+3.58
0.30% |
$1,194.00
|
602,506
98.43% of 50 DAV
50 DAV is 612,100
|
$1,198.75
-0.60%
|
12/18/2013
|
$1,156.20
|
PP = $1,198.85
|
|
MB = $1,258.79
|
Most Recent Note - 12/18/2013 2:03:06 PM
Y - Formed an advanced "3-week tight" base, albeit a riskier "late-stage" set-up, and its color code is changed to yellow with new pivot point based on its 11/29/13 high plus 10 cents. Subsequent volume-driven gains above the pivot point may trigger a new (or add-on) technical buy signal. It 50 DMA line defines important support to watch on pullbacks.
>>> FEATURED STOCK ARTICLE : Extended From Any Sound Base Pattern - 12/3/2013
View all notes |
Set NEW NOTE alert |
CANSLIM.net Company Profile |
SEC
News |
Chart |
Request a new note
C
A N
S L
I M
|
SFUN
-
NYSE
Soufun Hldgs Ltd Ads A
INTERNET - Internet Information Providers
|
$76.01
|
-0.05
-0.07% |
$76.84
|
663,870
47.57% of 50 DAV
50 DAV is 1,395,700
|
$77.45
-1.86%
|
10/17/2013
|
$58.02
|
PP = $53.87
|
|
MB = $56.56
|
Most Recent Note - 12/17/2013 4:04:42 PM
G - Volume was higher but still below average behind today's gain for a second-best close while challenging its all-time high hit last week. It is extended from any sound base pattern yet may produce more climactic gains. Prior highs and its 50 DMA line coincide in the $59 area defining important support to watch.
>>> FEATURED STOCK ARTICLE : Extended From Base Yet May Produce More Climactic Gains - 12/9/2013
View all notes |
Set NEW NOTE alert |
CANSLIM.net Company Profile |
SEC
News |
Chart |
Request a new note
C
A N
S L
I M
|
SSNC
-
NASDAQ
S S & C Technologies
COMPUTER SOFTWARE and SERVICES - Application Software
|
$41.21
|
-0.42
-1.01% |
$42.07
|
195,224
64.97% of 50 DAV
50 DAV is 300,500
|
$43.80
-5.91%
|
10/22/2013
|
$39.17
|
PP = $40.04
|
|
MB = $42.04
|
Most Recent Note - 12/16/2013 5:33:12 PM
G - Today's gain helped it rebound above its 50 DMA line helping its technical stance and outlook improve. See the latest FSU analysis for more details and new annotated daily and weekly graphs.
>>> FEATURED STOCK ARTICLE : Found Prompt Support After Damaging Losses Raised Concerns - 12/16/2013
View all notes |
Set NEW NOTE alert |
CANSLIM.net Company Profile |
SEC
News |
Chart |
Request a new note
C
A N
S L
I M
|
SSYS
-
NASDAQ
Stratasys Ltd
COMPUTER HARDWARE - Computer Peripherals
|
$122.81
|
+2.70
2.25% |
$123.93
|
933,067
80.13% of 50 DAV
50 DAV is 1,164,400
|
$134.00
-8.35%
|
10/11/2013
|
$102.94
|
PP = $105.38
|
|
MB = $110.65
|
Most Recent Note - 12/16/2013 5:34:16 PM
G - Consolidating above support at its 50 DMA line with volume totals cooling in recent weeks. More damaging losses would raise greater concerns and trigger worrisome technical sell signals. Previously noted with caution - "Reported earnings +13% on +153% sales revenues, below the +25% minimum earnings guideline (C criteria) raising fundamental concerns."
>>> FEATURED STOCK ARTICLE : Rallying For New Highs Despite Fundamental Flaw Raising Concern - 11/18/2013
View all notes |
Set NEW NOTE alert |
CANSLIM.net Company Profile |
SEC
News |
Chart |
Request a new note
C
A N
S L
I M
|
ULTI
-
NASDAQ
Ultimate Software Group
INTERNET - Internet Software and Services
|
$147.13
|
-1.18
-0.80% |
$149.16
|
183,158
124.17% of 50 DAV
50 DAV is 147,500
|
$162.88
-9.67%
|
10/16/2013
|
$142.95
|
PP = $151.18
|
|
MB = $158.74
|
Most Recent Note - 12/16/2013 12:51:03 PM
G - Still sputtering below its 50 DMA line, and the longer it lingers below that important short-term average, the worse its outlook gets. A prompt rebound above its 50 DMA line (now $151.41) is needed to help its technical stance.
>>> FEATURED STOCK ARTICLE : Consolidating Above 50 DMA Line and Prior Highs Defining Support - 11/21/2013
View all notes |
Set NEW NOTE alert |
CANSLIM.net Company Profile |
SEC
News |
Chart |
Request a new note
C
A N
S L
I M
|
Symbol/Exchange
Company Name
Industry Group |
PRICE |
CHANGE
(%Change) |
Day High |
Volume
(% DAV)
(% 50 day avg vol) |
52 Wk Hi
% From Hi |
Featured
Date |
Price
Featured |
Pivot Featured |
|
Max Buy |
VRX
-
NYSE
Valeant Pharmaceuticals
DRUGS - Drug Manufacturers - Other
|
$111.90
|
-0.51
-0.45% |
$112.34
|
726,941
67.34% of 50 DAV
50 DAV is 1,079,500
|
$115.40
-3.03%
|
9/11/2013
|
$100.26
|
PP = $105.50
|
|
MB = $110.78
|
Most Recent Note - 12/16/2013 3:42:59 PM
G - Rallying above its 50 DMA line with above average volume behind today's considerable gain, helping its technical stance improve. Recent lows in the $102 area define near-term support where a violation may trigger a technical sell signal. It has been resilient after it reported earnings +24% on +74% sales revenues for the Sep '13 quarter, a notch below the +25% minimum guideline (C criteria).
>>> FEATURED STOCK ARTICLE : Rebounding With Volume Backed Gains But Fundamental Concerns Remain - 12/18/2013
View all notes |
Set NEW NOTE alert |
CANSLIM.net Company Profile |
SEC
News |
Chart |
Request a new note
C
A N
S L
I M
|
YNDX
-
NASDAQ
Yandex N V Class A
INTERNET - Internet Information Providers
|
$39.68
|
+0.35
0.89% |
$40.05
|
1,693,928
62.39% of 50 DAV
50 DAV is 2,715,000
|
$42.00
-5.52%
|
11/27/2013
|
$39.61
|
PP = $42.10
|
|
MB = $44.21
|
Most Recent Note - 12/18/2013 2:07:09 PM
G - Consolidating near its 50 DMA line, stubbornly holding its ground after the damaging 12/11/13 loss raised concerns. Recently noted with caution- "Challenged its 52-week high recently but did not produce the required volume-driven gains above the pivot point to trigger a proper new technical buy signal."
>>> FEATURED STOCK ARTICLE : Forming New Base Pattern With Little Resistance Remaining - 11/27/2013
View all notes |
Set NEW NOTE alert |
CANSLIM.net Company Profile |
SEC
News |
Chart |
Request a new note
C
A N
S L
I M
|
|
|
|
THESE ARE NOT BUY RECOMMENDATIONS!
Comments contained in the body of this report are technical
opinions only. The material herein has been obtained
from sources believed to be reliable and accurate, however,
its accuracy and completeness cannot be guaranteed.
This site is not an investment advisor, hence it does
not endorse or recommend any securities or other investments.
Any recommendation contained in this report may not
be suitable for all investors and it is not to be deemed
an offer or solicitation on our part with respect to
the purchase or sale of any securities. All trademarks,
service marks and trade names appearing in this report
are the property of their respective owners, and are
likewise used for identification purposes only.
This report is a service available
only to active Paid Premium Members.
You may opt-out of receiving report notifications
at any time. Questions or comments may be submitted
by writing to Premium Membership Services 665 S.E. 10 Street, Suite 201 Deerfield Beach, FL 33441-5634 or by calling 1-800-965-8307
or 954-785-1121.
|
|
|

