You are not logged in.
This means you
CAN ONLY VIEW reports that were published prior to Monday, April 14, 2025.
You
MUST UPGRADE YOUR MEMBERSHIP if you want to see any current reports.
AFTER MARKET UPDATE - WEDNESDAY, DECEMBER 18TH, 2013
Previous After Market Report Next After Market Report >>>
|
|
|
|
DOW |
+292.71 |
16,167.97 |
+1.84% |
|
Volume |
867,951,460 |
+32% |
|
Volume |
2,054,099,360 |
+19% |
|
NASDAQ |
+46.38 |
4,070.06 |
+1.15% |
|
Advancers |
2,436 |
77% |
|
Advancers |
1,840 |
69% |
|
S&P 500 |
+29.65 |
1,810.65 |
+1.66% |
|
Decliners |
649 |
21% |
|
Decliners |
725 |
27% |
|
Russell 2000 |
+14.83 |
1,133.72 |
+1.33% |
|
52 Wk Highs |
186 |
|
|
52 Wk Highs |
145 |
|
|
S&P 600 |
+7.91 |
650.99 |
+1.23% |
|
52 Wk Lows |
85 |
|
|
52 Wk Lows |
35 |
|
|
 |
Dow and S&P 500 Index Rallied and Finished at New Record Highs
Kenneth J. Gruneisen - Passed the CAN SLIM® Master's Exam
The major averages ended higher with the Dow and S&P 500 setting new all-time closing highs on Wednesday. The volume totals were reported higher on the NYSE and on the Nasdaq exchange. Breadth was positive as advancers led decliners by nearly 4-1 on the NYSE and 9-4 on the Nasdaq exchange. There were 70 high-ranked companies from the CANSLIM.net Leaders List that made new 52-week highs and appeared on the CANSLIM.net BreakOuts Page, up from a total of 39 stocks on the prior session. The list of stocks hitting new 52-week highs outnumbered new lows on the Nasdaq exchange and on the NYSE. There were gains for all of the 16 high-ranked companies currently included on the Featured Stocks Page.
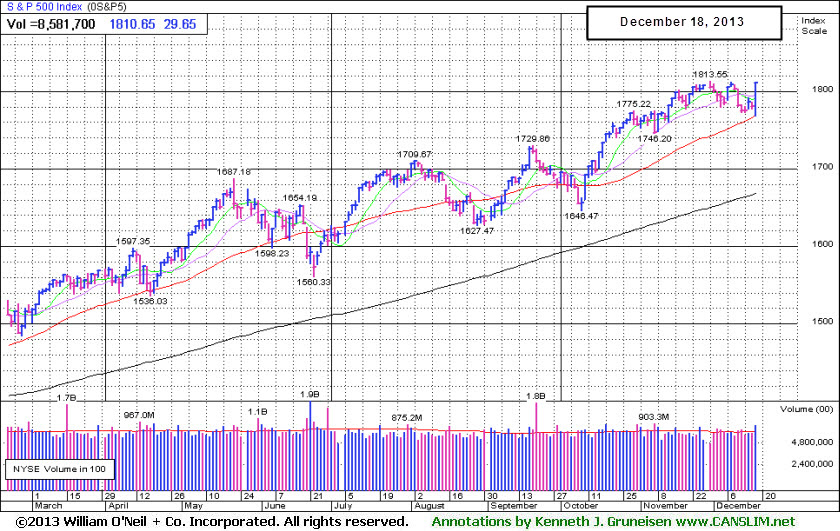
The Dow Jones Industrial Average rallied 292 points to 16,167, the S&P 500 added 29 points to 1,810 and the NASDAQ gained 46 points to 4,070. Stocks surged in the final hours of trading after the Federal Reserve announced a modest reduction of stimulus. Specifically, the central bank laid out plans to reduce their monthly bond purchases by $10 billion to $75 billion in January and pledged to keep rates low even after the unemployment rate moves below 6.5%. Chairman Bernanke cited improvements in the economy and unemployment for the slight taper.
All 10 sectors on the S&P ended higher, led by financial stocks including Bank of America Corp (BAC +3.36%). On the earnings front, Apple component supplier Jabil Circuit Inc (JBL -20.5%) dove after significantly lowering their future guidance. On the upside, homebuilder Lennar Corp (LEN +6.34%) rose following their profit tally. In other news, AMC Entertainment Holdings Inc (AMC +5%) rallied in its first day of trading.
Turning to fixed income markets, Treasuries were lower along the curve. The benchmark 10-year note was down 13/32 to yield 2.89% and the 30-year bond was off more than 1/2 of a point to yield 3.90%.
The Market (M criteria) rally has managed to overcome recent distributional pressure while still producing sufficient leadership (stocks hitting new highs) to maintain the ongoing uptrend. New buying efforts should always be selective. The CANSLIM.net Featured Stocks Page shows the most action-worthy candidates and their latest notes and a Headline Link directs members to the latest detailed analysis with data-packed graphs annotated by a Certified expert along with links to additional resources. The Premium Member Homepage includes "dynamic archives" to all prior pay reports published. Watch for an announcement via email concerning the next WEBCAST.
PICTURED: The S&P 500 Index rallied from its 50-day moving average (DMA) line to a best-ever close while volume increased to well above average.
|
 Kenneth J. Gruneisen started out as a licensed stockbroker in August 1987, a couple of months prior to the historic stock market crash that took the Dow Jones Industrial Average down -22.6% in a single day. He has published daily fact-based fundamental and technical analysis on high-ranked stocks online for two decades. Through FACTBASEDINVESTING.COM, Kenneth provides educational articles, news, market commentary, and other information regarding proven investment systems that work in good times and bad.
Comments contained in the body of this report are technical opinions only and are not necessarily those of Gruneisen Growth Corp. The material herein has been obtained from sources believed to be reliable and accurate, however, its accuracy and completeness cannot be guaranteed. Our firm, employees, and customers may effect transactions, including transactions contrary to any recommendation herein, or have positions in the securities mentioned herein or options with respect thereto. Any recommendation contained in this report may not be suitable for all investors and it is not to be deemed an offer or solicitation on our part with respect to the purchase or sale of any securities. |
|
 |
Retail, Financial, Tech and Energy-Related Indexes Rose
Kenneth J. Gruneisen - Passed the CAN SLIM® Master's Exam
The Retail Index ($RLX +1.92%) posted an influential gain while the Broker/Dealer Index ($XBD +1.81%) and the Bank Index ($BKX +2.16%) had a positive bias. The Integrated Oil Index ($XOI +1.75%) posted a solid gain and the Oil Services Index ($OSX +0.43%) edged higher. The Networking Index ($NWX +0.67%) and the Semiconductor Index ($SOX +0.75%) each posted modest gains while the Biotechnology Index ($BTK +2.48%) set strong pace for the tech sector. Defensive groups pulled back as the Gold & Silver Index ($XAU -1.22%) lost ground.
Charts courtesy www.stockcharts.com
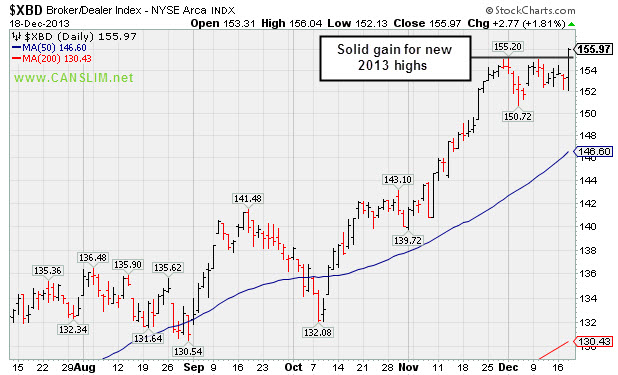
PICTURED: The Broker/Dealer Index ($XBD +1.81%) posted a solid gain for a new 2013 high.
| Oil Services |
$OSX |
275.89 |
+1.18 |
+0.43% |
+25.31% |
| Integrated Oil |
$XOI |
1,462.33 |
+25.14 |
+1.75% |
+17.76% |
| Semiconductor |
$SOX |
521.07 |
+3.89 |
+0.75% |
+35.67% |
| Networking |
$NWX |
309.96 |
+2.08 |
+0.67% |
+36.82% |
| Broker/Dealer |
$XBD |
155.97 |
+2.77 |
+1.81% |
+65.35% |
| Retail |
$RLX |
932.01 |
+17.56 |
+1.92% |
+42.71% |
| Gold & Silver |
$XAU |
81.59 |
-1.01 |
-1.22% |
-50.73% |
| Bank |
$BKX |
67.99 |
+1.44 |
+2.16% |
+32.59% |
| Biotech |
$BTK |
2,256.77 |
+54.55 |
+2.48% |
+45.88% |
|
|
|
 |
Rebounding With Volume Backed Gains But Fundamental Concerns Remain
Kenneth J. Gruneisen - Passed the CAN SLIM® Master's Exam
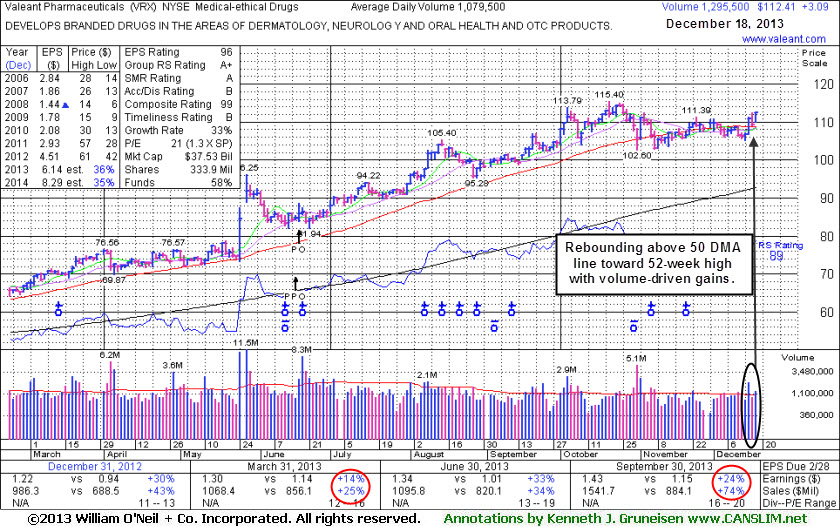
Valeant Pharmaceuticals International, Inc (VRX +$1.26 or +1.19% to $107.12) rose with above average volume again on Wednesday. It rallied above its 50-day moving average (DMA) line with above average volume behind a considerable gain on 12/16/13 helping its technical stance improve. VRX has been resilient after it reported earnings +24% on +74% sales revenues for the Sep '13 quarter, a notch below the +25% minimum guideline (C criteria). While it may be forming a sound new base, fundamentals may be an overriding concern.
Recent lows in the $102 area define near-term support where a violation may trigger a technical sell signal. VRX was last shown in this FSU section on 11/15/13 with annotated daily and weekly graphs under the headline, "Recent Lows Define Support to Watch Below 50 Day Average". Earnings rose +33% on +34% sales revenues for the Jun '13 quarter, above the +25% minimum earnings guideline (C criteria) a strong follow-up after concerns had been raised by its Mar '13 earnings report with only a +14% earnings increase (see red circles). A downturn in FY '07 and '08 earnings (A criteria) has been followed by a strong earnings rebound in recent years. Return On Equity is currently reported at 37%, well above the 17% minimum guideline of the fact-based system.
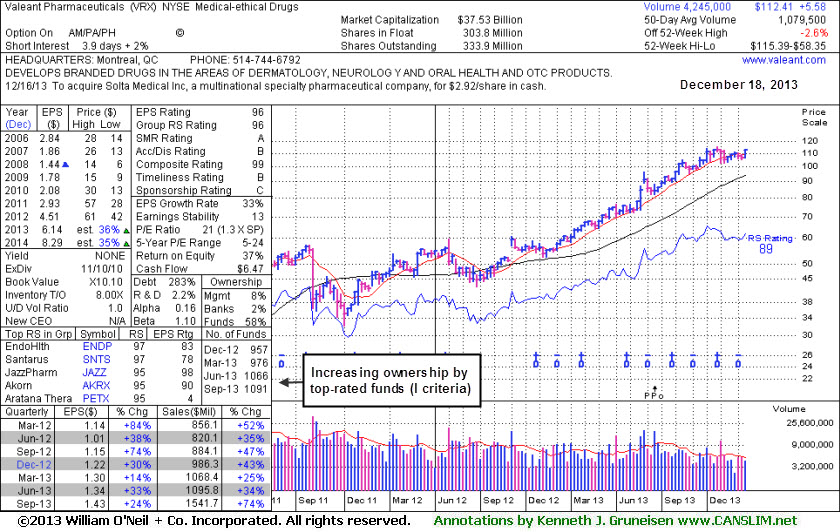
The number of top-rated funds owning its shares rose from 818 in Mar '12 in to 1,091 in Sep '13, a reassuring trend concerning the I criteria. The high-ranked Medical - Ethical Drugs firm's shares spiked higher in late May at around the time of M&A news that it would buy Bausch & Lomb for $8.7 billion. It completed Public Offering on 6/18/13. The upshot of Public Offerings is that when completed the end result is typically an increase in the total number of institutional owners. Institutional owners are often supportive of their existing positions and will even accumulate more shares when they consolidate near classic support levels like the 50-day and 200-day moving average (DMA) lines, if they are still believers in the company. If too many become pessimistic and decide to unload, this is what ends up sending the stocks slicing through support.
Prior reports noted - "Investors are taught in the Certification to only buy stocks with a combination of both strong fundamentals and strong technical action, however stocks should be sold based on their technical action only. In this example, more bullish action rewarded patient investors still giving it the benefit of the doubt until any technical sell signals start adding up."
|
|
|
Color Codes Explained :
Y - Better candidates highlighted by our
staff of experts.
G - Previously featured
in past reports as yellow but may no longer be buyable under the
guidelines.
***Last / Change / Volume data in this table is the closing quote data***
Symbol/Exchange
Company Name
Industry Group |
PRICE |
CHANGE
(%Change) |
Day High |
Volume
(% DAV)
(% 50 day avg vol) |
52 Wk Hi
% From Hi |
Featured
Date |
Price
Featured |
Pivot Featured |
|
Max Buy |
CELG
-
NASDAQ
Celgene Corp
DRUGS - Drug Manufacturers - Major
|
$163.62
|
+1.14
0.70% |
$164.22
|
943,171
32.97% of 50 DAV
50 DAV is 2,860,900
|
$173.80
-5.86%
|
9/12/2013
|
$149.50
|
PP = $150.02
|
|
MB = $157.52
|
Most Recent Note - 12/18/2013 1:48:58 PM
G - Undercutting prior highs in the $161 area while slumping near its 50 DMA line ($157.11 now) as it retreats from all-time highs with today's 6th consecutive loss. More damaging losses violating the 50 DMA line would raise greater concerns.
>>> FEATURED STOCK ARTICLE : Cooling Volume Totals While Hovering Near Highs - 12/4/2013
View all notes |
Set NEW NOTE alert |
CANSLIM.net Company Profile |
SEC
News |
Chart |
Request a new note
C
A N
S L
I M


|
EGOV
-
NASDAQ
N I C Inc
INTERNET - Internet Software and Services
|
$23.40
|
+0.14
0.60% |
$23.51
|
51,283
18.15% of 50 DAV
50 DAV is 282,500
|
$25.99
-9.97%
|
10/18/2013
|
$25.17
|
PP = $23.66
|
|
MB = $24.84
|
Most Recent Note - 12/18/2013 1:50:55 PM
G - Still sputtering below its 50 DMA line, and the longer it lingers below that important short-term average the worse its outlook gets. Disciplined investors always limit losses by selling any stock that falls more than -7% from their purchase price.
>>> FEATURED STOCK ARTICLE : Finding Support Near 50-Day Average During Distributional Pressure - 11/25/2013
View all notes |
Set NEW NOTE alert |
CANSLIM.net Company Profile |
SEC
News |
Chart |
Request a new note
C
A N
S L
I M
|
EQM
-
NYSE
E Q T Midstream Partners
ENERGY - Oil and Gas Pipelines
|
$55.02
|
+0.23
0.42% |
$55.16
|
65,523
50.40% of 50 DAV
50 DAV is 130,000
|
$56.41
-2.46%
|
12/12/2013
|
$53.17
|
PP = $56.51
|
|
MB = $59.34
|
Most Recent Note - 12/18/2013 1:51:57 PM
Y - Posting a big gain today while still quietly consolidating above important support at its 50 DMA line and prior highs in the $51 area. Subsequent volume-driven gains for new highs are needed to trigger a proper technical buy signal.
>>> FEATURED STOCK ARTICLE : Finding Support Near 50-Day Moving Average While Perched Near Highs - 12/13/2013
View all notes |
Set NEW NOTE alert |
CANSLIM.net Company Profile |
SEC
News |
Chart |
Request a new note
C
A N
S L
I M
|
FB
-
NASDAQ
Facebook Inc Cl A
INTERNET
|
$54.22
|
-1.35
-2.43% |
$55.19
|
55,111,154
74.57% of 50 DAV
50 DAV is 73,906,300
|
$55.18
-1.74%
|
12/12/2013
|
$51.40
|
PP = $54.93
|
|
MB = $57.68
|
Most Recent Note - 12/17/2013 12:51:47 PM
Y - Touching new highs without great volume conviction behind today's 4th consecutive gain, rising from a 9-week cup shaped base without a handle. Highlighted in yellow with pivot point cited based on its 10/18/13 high plus 10 cents in the 12/12/13 mid-day report (read here). At least +40% above average volume must be behind gains above the pivot point to trigger a proper technical buy signal.
>>> FEATURED STOCK ARTICLE : Well Known Social Media Firm on Watch List While Still Base Building - 12/12/2013
View all notes |
Set NEW NOTE alert |
CANSLIM.net Company Profile |
SEC
News |
Chart |
Request a new note
C
A N
S L
I M
|
FLT
-
NYSE
Fleetcor Technologies
DIVERSIFIED SERVICES - Business/Management Services
|
$117.81
|
-1.31
-1.10% |
$119.26
|
271,864
32.58% of 50 DAV
50 DAV is 834,400
|
$123.96
-4.96%
|
8/19/2013
|
$99.01
|
PP = $100.97
|
|
MB = $106.02
|
Most Recent Note - 12/17/2013 5:14:48 PM
G - Enduring recent distributional pressure while consolidating above its 50 DMA line. A subsequent violation of that important near-term support level may trigger a technical sell signal. See the latest FSU analysis for more details and new annotated daily and weekly graphs.
>>> FEATURED STOCK ARTICLE : Enduring Distributional Pressure While Extended From Sound Base - 12/17/2013
View all notes |
Set NEW NOTE alert |
CANSLIM.net Company Profile |
SEC
News |
Chart |
Request a new note
C
A N
S L
I M
|
Symbol/Exchange
Company Name
Industry Group |
PRICE |
CHANGE
(%Change) |
Day High |
Volume
(% DAV)
(% 50 day avg vol) |
52 Wk Hi
% From Hi |
Featured
Date |
Price
Featured |
Pivot Featured |
|
Max Buy |
GNRC
-
NYSE
Generac Hldgs Inc
CONSUMER DURABLES - Electronic Equipment
|
$54.30
|
-0.57
-1.03% |
$54.76
|
229,065
28.54% of 50 DAV
50 DAV is 802,500
|
$55.00
-1.27%
|
11/26/2013
|
$53.02
|
PP = $52.42
|
|
MB = $55.04
|
Most Recent Note - 12/18/2013 2:39:28 PM
Y - Hitting a new 52-week high with today's 3rd consecutive gain on light volume. Prior highs in the $52 area define initial support to watch on pullbacks.
>>> FEATURED STOCK ARTICLE : Following Latest Breakout Prior Highs Define Support - 11/29/2013
View all notes |
Set NEW NOTE alert |
CANSLIM.net Company Profile |
SEC
News |
Chart |
Request a new note
C
A N
S L
I M
|
HLF
-
NYSE
Herbalife Ltd
DRUGS - Nutrition and Weight Management
|
$78.83
|
+0.83
1.06% |
$79.75
|
2,694,338
101.74% of 50 DAV
50 DAV is 2,648,200
|
$78.50
0.42%
|
11/22/2013
|
$72.21
|
PP = $75.04
|
|
MB = $78.79
|
Most Recent Note - 12/17/2013 12:28:30 PM
Y - Hit a new 52-week high with today's 2nd consecutive volume-driven gain. Found support above its 50 DMA line recently, and no resistance remains due to overhead supply.
>>> FEATURED STOCK ARTICLE : Perched Near Highs Following Rebound - 11/22/2013
View all notes |
Set NEW NOTE alert |
CANSLIM.net Company Profile |
SEC
News |
Chart |
Request a new note
C
A N
S L
I M
|
JAZZ
-
NASDAQ
Jazz Pharmaceuticals Plc
DRUGS - Biotechnology
|
$114.65
|
+0.91
0.80% |
$115.85
|
164,815
22.19% of 50 DAV
50 DAV is 742,900
|
$121.15
-5.37%
|
9/30/2013
|
$93.20
|
PP = $89.10
|
|
MB = $93.56
|
Most Recent Note - 12/16/2013 12:37:13 PM
G - Enduring distributional pressure and retreating from its 52-week high with higher volume behind today's loss. Recently noted as "extended from any sound base" with near-term support to watch at its 50 DMA line (now $100.85).
>>> FEATURED STOCK ARTICLE : Technically Extended Stock May Be a Dangerous Chase - 12/10/2013
View all notes |
Set NEW NOTE alert |
CANSLIM.net Company Profile |
SEC
News |
Chart |
Request a new note
C
A N
S L
I M
|
KORS
-
NYSE
Michael Kors Hldgs Ltd
RETAIL - Apparel Stores
|
$84.00
|
-0.19
-0.23% |
$84.58
|
738,098
16.00% of 50 DAV
50 DAV is 4,612,500
|
$84.40
-0.47%
|
8/6/2013
|
$69.66
|
PP = $66.28
|
|
MB = $69.59
|
Most Recent Note - 12/18/2013 1:57:20 PM
G - Hovering at its 52-week high today and volume totals have been cooling in recent weeks. Did not form a base of sufficient length yet found support at prior highs in the $78 area and stayed above its 50 DMA line during the latest consolidation.
>>> FEATURED STOCK ARTICLE : Consolidation Too Brief To Note New Pivot - 12/6/2013
View all notes |
Set NEW NOTE alert |
CANSLIM.net Company Profile |
SEC
News |
Chart |
Request a new note
C
A N
S L
I M
|
PCLN
-
NASDAQ
Priceline.Com Inc
INTERNET - Internet Software and Services
|
$1,186.95
|
-1.04
-0.09% |
$1,194.00
|
312,812
51.10% of 50 DAV
50 DAV is 612,100
|
$1,198.75
-0.98%
|
12/18/2013
|
$1,156.20
|
PP = $1,198.85
|
|
MB = $1,258.79
|
Most Recent Note - 12/18/2013 2:03:06 PM
Y - Formed an advanced "3-week tight" base, albeit a riskier "late-stage" set-up, and its color code is changed to yellow with new pivot point based on its 11/29/13 high plus 10 cents. Subsequent volume-driven gains above the pivot point may trigger a new (or add-on) technical buy signal. It 50 DMA line defines important support to watch on pullbacks.
>>> FEATURED STOCK ARTICLE : Extended From Any Sound Base Pattern - 12/3/2013
View all notes |
Set NEW NOTE alert |
CANSLIM.net Company Profile |
SEC
News |
Chart |
Request a new note
C
A N
S L
I M
|
Symbol/Exchange
Company Name
Industry Group |
PRICE |
CHANGE
(%Change) |
Day High |
Volume
(% DAV)
(% 50 day avg vol) |
52 Wk Hi
% From Hi |
Featured
Date |
Price
Featured |
Pivot Featured |
|
Max Buy |
SFUN
-
NYSE
Soufun Hldgs Ltd Ads A
INTERNET - Internet Information Providers
|
$75.86
|
-0.20
-0.26% |
$76.84
|
324,850
23.28% of 50 DAV
50 DAV is 1,395,700
|
$77.45
-2.05%
|
10/17/2013
|
$58.02
|
PP = $53.87
|
|
MB = $56.56
|
Most Recent Note - 12/17/2013 4:04:42 PM
G - Volume was higher but still below average behind today's gain for a second-best close while challenging its all-time high hit last week. It is extended from any sound base pattern yet may produce more climactic gains. Prior highs and its 50 DMA line coincide in the $59 area defining important support to watch.
>>> FEATURED STOCK ARTICLE : Extended From Base Yet May Produce More Climactic Gains - 12/9/2013
View all notes |
Set NEW NOTE alert |
CANSLIM.net Company Profile |
SEC
News |
Chart |
Request a new note
C
A N
S L
I M
|
SSNC
-
NASDAQ
S S & C Technologies
COMPUTER SOFTWARE and SERVICES - Application Software
|
$41.79
|
+0.16
0.38% |
$41.89
|
58,896
19.60% of 50 DAV
50 DAV is 300,500
|
$43.80
-4.59%
|
10/22/2013
|
$39.17
|
PP = $40.04
|
|
MB = $42.04
|
Most Recent Note - 12/16/2013 5:33:12 PM
G - Today's gain helped it rebound above its 50 DMA line helping its technical stance and outlook improve. See the latest FSU analysis for more details and new annotated daily and weekly graphs.
>>> FEATURED STOCK ARTICLE : Found Prompt Support After Damaging Losses Raised Concerns - 12/16/2013
View all notes |
Set NEW NOTE alert |
CANSLIM.net Company Profile |
SEC
News |
Chart |
Request a new note
C
A N
S L
I M
|
SSYS
-
NASDAQ
Stratasys Ltd
COMPUTER HARDWARE - Computer Peripherals
|
$122.28
|
+2.17
1.81% |
$122.50
|
435,952
37.44% of 50 DAV
50 DAV is 1,164,400
|
$134.00
-8.75%
|
10/11/2013
|
$102.94
|
PP = $105.38
|
|
MB = $110.65
|
Most Recent Note - 12/16/2013 5:34:16 PM
G - Consolidating above support at its 50 DMA line with volume totals cooling in recent weeks. More damaging losses would raise greater concerns and trigger worrisome technical sell signals. Previously noted with caution - "Reported earnings +13% on +153% sales revenues, below the +25% minimum earnings guideline (C criteria) raising fundamental concerns."
>>> FEATURED STOCK ARTICLE : Rallying For New Highs Despite Fundamental Flaw Raising Concern - 11/18/2013
View all notes |
Set NEW NOTE alert |
CANSLIM.net Company Profile |
SEC
News |
Chart |
Request a new note
C
A N
S L
I M
|
ULTI
-
NASDAQ
Ultimate Software Group
INTERNET - Internet Software and Services
|
$147.11
|
-1.20
-0.81% |
$149.16
|
67,485
45.75% of 50 DAV
50 DAV is 147,500
|
$162.88
-9.68%
|
10/16/2013
|
$142.95
|
PP = $151.18
|
|
MB = $158.74
|
Most Recent Note - 12/16/2013 12:51:03 PM
G - Still sputtering below its 50 DMA line, and the longer it lingers below that important short-term average, the worse its outlook gets. A prompt rebound above its 50 DMA line (now $151.41) is needed to help its technical stance.
>>> FEATURED STOCK ARTICLE : Consolidating Above 50 DMA Line and Prior Highs Defining Support - 11/21/2013
View all notes |
Set NEW NOTE alert |
CANSLIM.net Company Profile |
SEC
News |
Chart |
Request a new note
C
A N
S L
I M
|
VRX
-
NYSE
Valeant Pharmaceuticals
DRUGS - Drug Manufacturers - Other
|
$111.10
|
-1.31
-1.17% |
$112.34
|
300,049
27.80% of 50 DAV
50 DAV is 1,079,500
|
$115.40
-3.72%
|
9/11/2013
|
$100.26
|
PP = $105.50
|
|
MB = $110.78
|
Most Recent Note - 12/16/2013 3:42:59 PM
G - Rallying above its 50 DMA line with above average volume behind today's considerable gain, helping its technical stance improve. Recent lows in the $102 area define near-term support where a violation may trigger a technical sell signal. It has been resilient after it reported earnings +24% on +74% sales revenues for the Sep '13 quarter, a notch below the +25% minimum guideline (C criteria).
>>> FEATURED STOCK ARTICLE : Rebounding With Volume Backed Gains But Fundamental Concerns Remain - 12/18/2013
View all notes |
Set NEW NOTE alert |
CANSLIM.net Company Profile |
SEC
News |
Chart |
Request a new note
C
A N
S L
I M
|
Symbol/Exchange
Company Name
Industry Group |
PRICE |
CHANGE
(%Change) |
Day High |
Volume
(% DAV)
(% 50 day avg vol) |
52 Wk Hi
% From Hi |
Featured
Date |
Price
Featured |
Pivot Featured |
|
Max Buy |
YNDX
-
NASDAQ
Yandex N V Class A
INTERNET - Internet Information Providers
|
$39.42
|
+0.09
0.23% |
$40.05
|
1,097,892
40.44% of 50 DAV
50 DAV is 2,715,000
|
$42.00
-6.14%
|
11/27/2013
|
$39.61
|
PP = $42.10
|
|
MB = $44.21
|
Most Recent Note - 12/18/2013 2:07:09 PM
G - Consolidating near its 50 DMA line, stubbornly holding its ground after the damaging 12/11/13 loss raised concerns. Recently noted with caution- "Challenged its 52-week high recently but did not produce the required volume-driven gains above the pivot point to trigger a proper new technical buy signal."
>>> FEATURED STOCK ARTICLE : Forming New Base Pattern With Little Resistance Remaining - 11/27/2013
View all notes |
Set NEW NOTE alert |
CANSLIM.net Company Profile |
SEC
News |
Chart |
Request a new note
C
A N
S L
I M
|
|
|
|
THESE ARE NOT BUY RECOMMENDATIONS!
Comments contained in the body of this report are technical
opinions only. The material herein has been obtained
from sources believed to be reliable and accurate, however,
its accuracy and completeness cannot be guaranteed.
This site is not an investment advisor, hence it does
not endorse or recommend any securities or other investments.
Any recommendation contained in this report may not
be suitable for all investors and it is not to be deemed
an offer or solicitation on our part with respect to
the purchase or sale of any securities. All trademarks,
service marks and trade names appearing in this report
are the property of their respective owners, and are
likewise used for identification purposes only.
This report is a service available
only to active Paid Premium Members.
You may opt-out of receiving report notifications
at any time. Questions or comments may be submitted
by writing to Premium Membership Services 665 S.E. 10 Street, Suite 201 Deerfield Beach, FL 33441-5634 or by calling 1-800-965-8307
or 954-785-1121.
|
|
|

