You are not logged in.
This means you
CAN ONLY VIEW reports that were published prior to Wednesday, March 19, 2025.
You
MUST UPGRADE YOUR MEMBERSHIP if you want to see any current reports.
AFTER MARKET UPDATE - FRIDAY, DECEMBER 18TH, 2009
Previous After Market Report Next After Market Report >>>
|
|
|
|
DOW |
+20.63 |
10,328.89 |
+0.20% |
|
Volume |
3,159,434,210 |
+84% |
|
Volume |
3,287,783,270 |
+67% |
|
NASDAQ |
+31.64 |
2,211.69 |
+1.45% |
|
Advancers |
1,775 |
57% |
|
Advancers |
1,644 |
57% |
|
S&P 500 |
+6.39 |
1,102.47 |
+0.58% |
|
Decliners |
1,241 |
40% |
|
Decliners |
1,117 |
39% |
|
Russell 2000 |
+6.32 |
610.57 |
+1.05% |
|
52 Wk Highs |
197 |
|
|
52 Wk Highs |
103 |
|
|
S&P 600 |
+3.55 |
324.57 |
+1.11% |
|
52 Wk Lows |
6 |
|
|
52 Wk Lows |
35 |
|
|
 |
Volume High On Options Expirations While Indices Post Gains
Adam Sarhan, Contributing Writer,
The major averages ended the week mixed as the US dollar continued to rally and investors digested a slew of economic data. Stocks closed higher on Friday as volume, an important indicator of institutional sponsorship, jumped well above Thursday's levels due to quadruple witching. Advancers led decliners about a 3-to-2 ratio on the NYSE and on the Nasdaq exchange. There were 26 high-ranked companies from the CANSLIM.net Leaders List that made a new 52-week high and appeared on the CANSLIM.net BreakOuts Page, higher from the total of 20 issues that appeared on the prior session. New 52-week highs still outnumbered new 52-week lows on the NYSE and on the Nasdaq exchange.
On Monday, stocks edged higher after Abu Dhabi announced it would bail out Dubai World and Exxon Mobil Corp (XOM -0.01%) announced plans to buy XTO Energy Inc. (XTO -0.04%) for $31 billion. The major averages closed just below their near term resistance levels and spent the rest of the week pulling back toward their respective support levels (50-day moving average lines). On Tuesday, the major averages closed lower as investors digested the latest round of disconcerting economic data. Before Tuesday's opening bell, two tepid economic reports were released which suggested stagflation may be on the horizon (higher inflation coupled with low economic activity). The producer price index (PPI) surged while the Empire State manufacturing index plunged. That afternoon, the National Association of Home Builders released their housing market index. The index, which rates the overall economy and housing market conditions, fell 1 point in December to 16 which is a very low reading.
On Wednesday, the market ended mixed as investors digested a slew of important data: the Fed concluded its last meeting of the year, housing starts topped estimates and consumer prices matched forecast. Before Wednesday's opening bell, two important economic reports were released: the consumer price index (CPI) and housing starts. The Labor Department said consumer prices rose by +0.4% in November after gaining +0.3% in October. The headline number matched estimates which helped allay inflation woes. The core rate, which excludes food and energy, was unchanged last month and was below the Street's estimate for an increase of +0.1%. Elsewhere, the Commerce Department said housing starts, which are registered when construction begins on a new residential building, were in line with estimates and rose +8.9% to an annual rate of 574,000 units. Meanwhile, building permits, a sign of future construction, jumped to the highest level in a year which was an encouraging sign. At 2:15PM EST, the FOMC concluded its two-day meeting and decided to leave interest rates steady near historical lows of 0-.25%. However, the Fed signaled that they will stop participating in capital markets by February 2010 and this put pressure on stocks.
Stocks got smacked on Thursday as the dollar rallied to a fresh three month high against the euro as concern spread that the Fed-induced rally will end in early 2010. Before Thursday's opening bell, the Labor Department said initial jobless claims rose slightly last week to 480,000 versus expectations for 465,000. At 10:00AM EST, the Conference Board released its index of leading economic indicators and the Philadelphia Fed released its index which measures general economic conditions in the region. The Conference Board's index, which is used to forecast the following 3-6 months, rose by +0.9% in November which bodes well for the first half of 2010. The index measures ten economic indicators that usually "lead" the overall economy. Meanwhile, the Philadelphia Fed's headline index rose more than 3.5 points to 20.4 which indicates healthy month-to-month acceleration in the region's manufacturing sector.
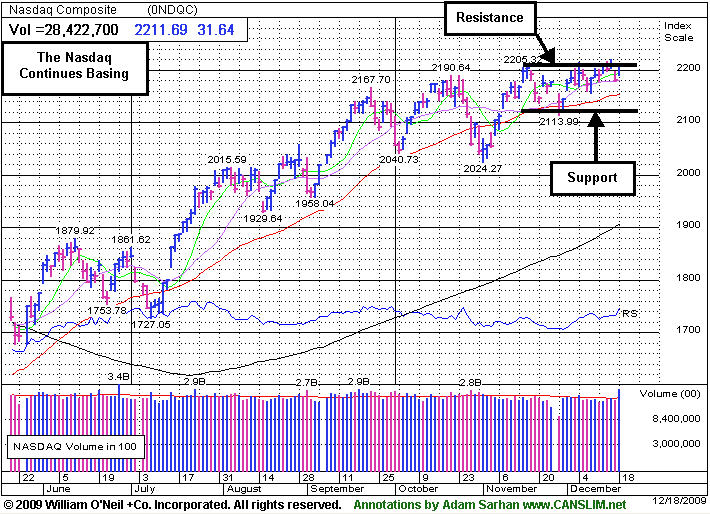
On Friday, stocks ended higher as the major averages continued basing. At this point, resistance for the Dow Jones Industrial Average, S&P 500, and the tech-heavy Nasdaq Composite stands at: 10,500, 1,115, and just above 2,200, respectively, Conversely, support sits just above their respective 50-day moving average lines. Looking forward, one could logically expect the sideways action to continue until either support or resistance is breached.
PICTURED: The Nasdaq Composite Index continues basing.
|
|
|
 |
Financial Shares Among Friday's Widespread Gainers
Kenneth J. Gruneisen - Passed the CAN SLIM® Master's Exam
The Broker/Dealer Index ($XBD +1.80%) and Bank Index ($BKX +2.30%) were a positive influence on the major averages on Friday while most other groups also ended the session higher. The tech sector had a positive bias as the Networking Index ($NWX +0.73%), Internet Index ($IIX +1.14%), Semiconductor Index ($SOX +1.47%), and Biotechnology Index ($BTK +1.62%) posted gains. The Gold & Silver Index ($XAU +1.53%) also rose more than +1%. Meanwhile there were smaller gains for the Retail Index ($RLX +0.09%), Healthcare Index ($HMO +0.24%), and Integrated Oil Index ($XOI +0.18%), but the Oil Services Index ($OSX -0.16%) ended slightly lower.
Charts courtesy www.stockcharts.com
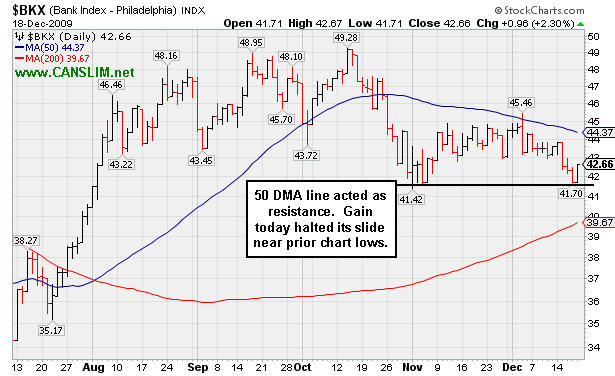
PICTURED: The Bank Index ($BKX +2.30%) encountered resistance at its 50-day moving average (DMA) line. It halted its slide near prior chart lows. Further deterioration in the financial group would hurt the overall market outlook, since financial shares are a reliable leading indicator.
| Oil Services |
$OSX |
192.05 |
-0.30 |
-0.16% |
+58.21% |
| Healthcare |
$HMO |
1,474.22 |
+3.51 |
+0.24% |
+53.54% |
| Integrated Oil |
$XOI |
1,043.97 |
+1.85 |
+0.18% |
+6.56% |
| Semiconductor |
$SOX |
344.83 |
+5.01 |
+1.47% |
+62.53% |
| Networking |
$NWX |
225.04 |
+1.64 |
+0.73% |
+56.40% |
| Internet |
$IIX |
228.84 |
+2.58 |
+1.14% |
+71.07% |
| Broker/Dealer |
$XBD |
113.09 |
+2.00 |
+1.80% |
+45.98% |
| Retail |
$RLX |
407.08 |
+0.36 |
+0.09% |
+45.77% |
| Gold & Silver |
$XAU |
167.04 |
+2.51 |
+1.53% |
+34.87% |
| Bank |
$BKX |
42.66 |
+0.96 |
+2.30% |
-3.75% |
| Biotech |
$BTK |
908.76 |
+14.52 |
+1.62% |
+40.42% |
|
|
|
 |
Price And Volume Forces Indicate Institutional Buying Demand
Kenneth J. Gruneisen - Passed the CAN SLIM® Master's Exam
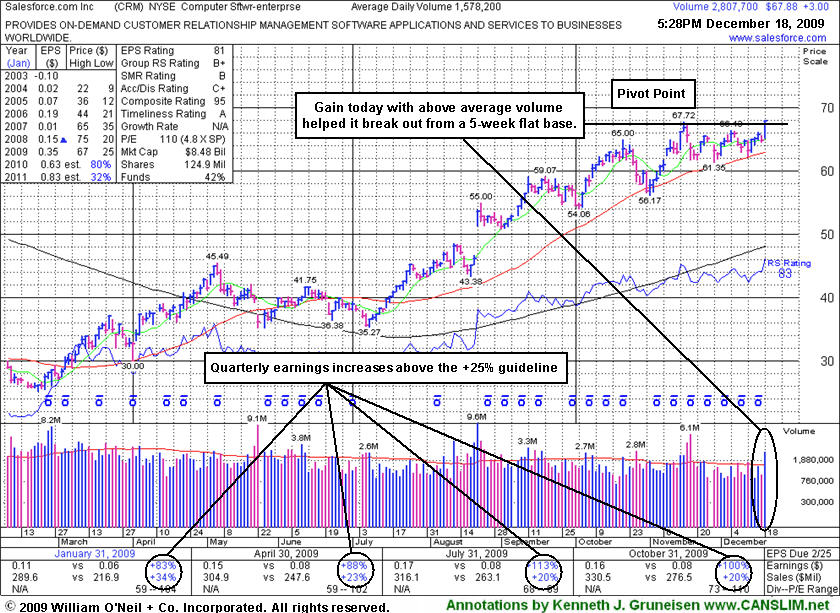
Salesforce.com, Inc. (CRM +$3.00 or +4.62% to $67.88) gapped up today for a small gain, then went on to rally with heavy volume for a new 52-week high. It had been recently consolidating above important support at its 50-day moving average (DMA) line. Over the past 5 weeks it formed a sound new flat base. Its color code was changed to yellow and a new pivot point based upon its 11/16/09 high plus 10 cents was noted earlier today. A 5-week consolidation is the minimum length for a proper flat base. A convincing breakout above its prior chart high with at least +50% above average volume was all that it took to trigger a new technical buy signal.
Patience has allowed disciplined investors another ideal entry point with the reassurance of heavy institutional buying (the I criteria) demand. That technical buy signal is no guarantee it will go on to produce huge gains, but such signs of big buying demand are considered as the critical "proof" for investors using this fact-based investment system. Meanwhile, any violation of its 50 DMA line and recent chart lows in the $61 area would raise concerns and trigger technical sell signals. Not long ago it found prompt support at its 50-day moving average (DMA) line then rallied to a new 52-week high and encountered some heavy distribution. Each subsequent test of that short term average line is considered to be more failure prone, while staying above the 50 DMA line is a healthy sign of institutional support.
|
|
|
Color Codes Explained :
Y - Better candidates highlighted by our
staff of experts.
G - Previously featured
in past reports as yellow but may no longer be buyable under the
guidelines.
***Last / Change / Volume quote data in this table corresponds with the timestamp on the note***
Symbol/Exchange
Company Name
Industry Group |
Last |
Chg. |
Vol
% DAV |
Date Featured |
Price Featured |
Latest Pivot Point
Featured |
Status |
| Latest Max Buy Price |
ARST
-
|
$26.03
|
+0.74
|
730,886
131% DAV
557,400
|
9/1/2009
(Date
Featured) |
$19.91
(Price
Featured) |
PP = $20.90 |
G |
| MB = $21.95 |
Most Recent Note - 12/18/2009 4:49:09 PM
G - Gain today on higher than average volume was its 7th consecutive gain. Its rebound this week above its 50 DMA line helped its outlook improve. Deterioration below its recent chart lows ($22.15) would raise more serious concerns. ARST was first featured in yellow at $19.91 in the 9/01/09 mid-day report with an annotated daily graph (read here).
>>> The latest Featured Stock Update with an annotated graph appeared on 12/16/2009. click here.
|
|
C
A
S
I |
News |
Chart |
SEC
View all notes Alert
me of new notes
Company
Profile
|
ASIA
-
|
$30.06
|
-0.32
|
2,055,113
154% DAV
1,332,300
|
10/14/2009
(Date
Featured) |
$23.05
(Price
Featured) |
PP = $22.19 |
G |
| MB = $23.30 |
Most Recent Note - 12/18/2009 4:56:46 PM
G - Today's loss with heavier volume was its 4th consecutive loss since reaching a new 52-week high. It is extended from any sound base after its considerable gap up gain on 12/07/09 with almost 8 times average volume. Featured 10/14/09 in the mid-day report (read here) as it gapped up for a new 52-week high with 5 times average volume, triggering a technical buy signal by blasting above its pivot point. First featured in the August 2009 CANSLIM.net News (read here).
>>> The latest Featured Stock Update with an annotated graph appeared on 12/7/2009. click here.
|
|
C
A
S
I |
News |
Chart |
SEC
View all notes Alert
me of new notes
Company
Profile
|
BIDU
- NASDAQ
Baidu Inc Ads
INTERNET - Internet Information Providers
|
$414.40
|
-1.44
|
1,329,270
68% DAV
1,964,900
|
9/8/2009
(Date
Featured) |
$351.80
(Price
Featured) |
PP = $440.00 |
G |
| MB = $462.00 |
Most Recent Note - 12/18/2009 4:59:43 PM
G - Losses late this week on light volume led to deterioration below its 50 DMA line, raising concerns. Color code was changed to green. It would need to rally above its latest pivot point to trigger a new buy signal. Technically, it has built a sloppy base over 8 weeks. Since quietly rallying to new highs in November it has stalled. BIDU traded up as much as +23% from its price when featured in yellow in the 9/08/09 Mid-Day BreakOuts Report (read here).
>>> The latest Featured Stock Update with an annotated graph appeared on 12/9/2009. click here.
|
|
C
A
S
I |
News |
Chart |
SEC
View all notes Alert
me of new notes
Company
Profile
|
CAAS
- NASDAQ
China Automotive Systems
AUTOMOTIVE - Auto Parts
|
$19.01
|
-0.71
|
801,560
129% DAV
620,700
|
11/30/2009
(Date
Featured) |
$18.84
(Price
Featured) |
PP = $17.62 |
G |
| MB = $18.50 |
Most Recent Note - 12/18/2009 5:00:50 PM
G - Down today on above average volume, it briefly traded under its "max buy" level. Negative reversals recently raised concerns while it was extended from a sound base under the investment system rules. The Chinese maker of power steering systems was rising from an advanced "3-weeks tight" type of chart pattern as it showed up in yellow in the 11/30/09 mid-day report (read here). Recent quarters show accelerating sales revenues and earnings increases, and it has a good annual earnings history.
>>> The latest Featured Stock Update with an annotated graph appeared on 12/11/2009. click here.
|
|
C
A
S
I |
News |
Chart |
SEC
View all notes Alert
me of new notes
Company
Profile
|
CACC
- NASDAQ
Credit Acceptance Corp
FINANCIAL SERVICES - Credit Services
|
$39.89
|
+0.35
|
104,527
291% DAV
35,900
|
9/29/2009
(Date
Featured) |
$33.48
(Price
Featured) |
PP = $37.10 |
G |
| MB = $38.96 |
Most Recent Note - 12/18/2009 5:17:21 PM
G - Hit a new high today as it rallied with above average volume behind a 6th consecutive gain. Considerable gain on 12/16/09 with almost 6 times average volume triggered a technical buy signal, and color code was changed to green as it got too extended from a sound base. An article in the paper on 12/14 discussed its thin trading and that it can lead to great volatility (read here). Recent chart lows in the $33 area are an important support level to watch now. The Finance - Consumer/Commercial Loans firm has maintained a great track record of annual and quarterly sales revenues and earnings increases. It was featured on 9/29/09 in yellow in the mid-day report (read here
>>> The latest Featured Stock Update with an annotated graph appeared on 12/10/2009. click here.
|
|
C
A
S
I |
News |
Chart |
SEC
View all notes Alert
me of new notes
Company
Profile
|
CRM
- NYSE
Salesforce.com Inc
INTERNET - Internet Software & Services
|
$67.88
|
+3.00
|
3,395,345
215% DAV
1,578,200
|
12/18/2009
(Date
Featured) |
$67.32
(Price
Featured) |
PP = $67.82 |
Y |
| MB = $71.21 |
Most Recent Note - 12/18/2009 5:21:56 PM
Y - Gain today with about twice its average volume for a new 2009 high helped it rise from a 5-week flat base above important support at its 50 DMA line. Color code was changed to yellow earlier today with new pivot point and max buy levels noted based on its 11/16/09 high. The gain with at least +50% above average volume and close above its prior highs triggered a new technical buy signal.
>>> The latest Featured Stock Update with an annotated graph appeared on 12/18/2009. click here.
|
|
C
A
S
I |
News |
Chart |
SEC
View all notes Alert
me of new notes
Company
Profile
|
CTRP
- NASDAQ
Ctrip.com Intl Ltd Adr
LEISURE - Resorts & Casinos
|
$74.45
|
-0.67
|
855,832
78% DAV
1,103,500
|
12/1/2009
(Date
Featured) |
$75.38
(Price
Featured) |
PP = $73.91 |
Y |
| MB = $77.61 |
Most Recent Note - 12/18/2009 5:24:22 PM
Y - Small loss today after negatively reversing on the prior session, closing below its "max buy" price but above its pivot point. Featured on 12/01/09 in yellow in the mid-day report (read here). It triggered a technical buy signal as it rose with more than +50% above average volume from a brief consolidation resembling a "high-tight-flag" pattern which it formed after repairing a late-October breach of its 50 DMA line. Fundamentally, its sales revenues and earnings increases have shown acceleration in the 3 most recent quarterly comparisons and rose above the +25% guideline. Based on weak technical action it was dropped from the Featured Stocks list on 6/10/08, when it closed at $49.84, yet it has rebounded very impressively from subsequent lows in the $16 area.
>>> The latest Featured Stock Update with an annotated graph appeared on 12/14/2009. click here.
|
|
C
A
S
I |
News |
Chart |
SEC
View all notes Alert
me of new notes
Company
Profile
|
HEAT
-
|
$15.58
|
-0.31
|
1,066,260
119% DAV
897,100
|
11/17/2009
(Date
Featured) |
$12.00
(Price
Featured) |
PP = $12.61 |
G |
| MB = $13.24 |
Most Recent Note - 12/18/2009 5:26:00 PM
G - Third consecutive loss today on near average volume. Consolidating near its 52-week high, extended from its prior base after 3 weekly gains on above average volume in the past 4 weeks. The investment system rules say a stock should be held a minimum of 8 weeks after rising more than +20% in the first 2-3 weeks from being bought. First featured in yellow in the 11/17/09 mid-day report (read here) when technically rising from a "double bottom" base, reaching a new all-time high.
>>> The latest Featured Stock Update with an annotated graph appeared on 12/15/2009. click here.
|
|
C
A
S
I |
News |
Chart |
SEC
View all notes Alert
me of new notes
Company
Profile
|
LFT
-
|
$37.14
|
+0.21
|
291,168
64% DAV
453,600
|
11/17/2009
(Date
Featured) |
$31.77
(Price
Featured) |
PP = $33.04 |
G |
| MB = $34.69 |
Most Recent Note - 12/18/2009 5:26:58 PM
G - Perched near all-time highs, extended after recently rising from a choppy 14-week base. Prior chart highs in the $31 area are an initial support level to watch. A proposed offering of additional shares on 11/16/09 seems well received by the market. Its fundamentals remain strong.
>>> The latest Featured Stock Update with an annotated graph appeared on 12/17/2009. click here.
|
|
C
A
S
I |
News |
Chart |
SEC
View all notes Alert
me of new notes
Company
Profile
|
|
|
|
THESE ARE NOT BUY RECOMMENDATIONS!
Comments contained in the body of this report are technical
opinions only. The material herein has been obtained
from sources believed to be reliable and accurate, however,
its accuracy and completeness cannot be guaranteed.
This site is not an investment advisor, hence it does
not endorse or recommend any securities or other investments.
Any recommendation contained in this report may not
be suitable for all investors and it is not to be deemed
an offer or solicitation on our part with respect to
the purchase or sale of any securities. All trademarks,
service marks and trade names appearing in this report
are the property of their respective owners, and are
likewise used for identification purposes only.
This report is a service available
only to active Paid Premium Members.
You may opt-out of receiving report notifications
at any time. Questions or comments may be submitted
by writing to Premium Membership Services 665 S.E. 10 Street, Suite 201 Deerfield Beach, FL 33441-5634 or by calling 1-800-965-8307
or 954-785-1121.
|
|
|


