You are not logged in.
This means you
CAN ONLY VIEW reports that were published prior to Monday, April 14, 2025.
You
MUST UPGRADE YOUR MEMBERSHIP if you want to see any current reports.
AFTER MARKET UPDATE - TUESDAY, DECEMBER 17TH, 2013
Previous After Market Report Next After Market Report >>>
|
|
|
|
DOW |
-9.31 |
15,875.26 |
-0.06% |
|
Volume |
655,925,110 |
-2% |
|
Volume |
1,723,239,680 |
-5% |
|
NASDAQ |
-5.84 |
4,023.68 |
-0.14% |
|
Advancers |
1,397 |
44% |
|
Advancers |
1,157 |
43% |
|
S&P 500 |
-5.54 |
1,781.00 |
-0.31% |
|
Decliners |
1,630 |
52% |
|
Decliners |
1,420 |
53% |
|
Russell 2000 |
-0.96 |
1,118.89 |
-0.09% |
|
52 Wk Highs |
76 |
|
|
52 Wk Highs |
78 |
|
|
S&P 600 |
-1.01 |
643.08 |
-0.16% |
|
52 Wk Lows |
83 |
|
|
52 Wk Lows |
34 |
|
|
 |
Major Averages Ended Slightly Lower on Lighter Volume Totals
Kenneth J. Gruneisen - Passed the CAN SLIM® Master's Exam
The major averages finished modestly lower on Tuesday's session. The volume totals were reported lighter on the NYSE and on the Nasdaq exchange. Breadth was negative as decliners led advancers by 7-6 on the NYSE and 6-5 on the Nasdaq exchange. There were 39 high-ranked companies from the CANSLIM.net Leaders List that made new 52-week highs and appeared on the CANSLIM.net BreakOuts Page, down from a total of 44 stocks on the prior session. The list of stocks hitting new 52-week highs outnumbered new lows on the Nasdaq exchange, but new lows outnumbered new highs on the NYSE. There were gains for 8 of the 16 high-ranked companies currently included on the Featured Stocks Page.
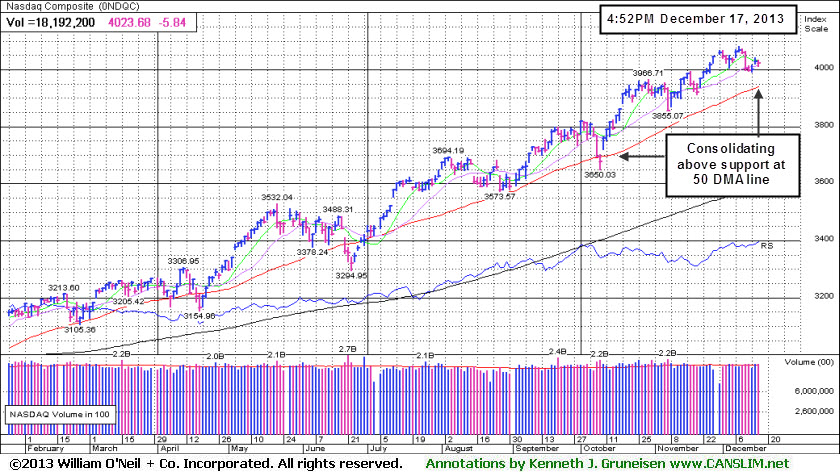
Stocks we choppy throughout the day as investors were cautious to make moves before the conclusion of the Fed's 2-day policy meeting. Equity markets could remain range-bound until the central bank makes a decision tomorrow on whether or not it will taper its current level of bond purchases.
Sector action on the S&P was mixed. Health Care stocks showed weakness with Glaxosmithkline Plc (GSK -1.62%). Telecom stocks got a boost from some M&A activity. Shares of Frontier Communications Corp (FTR +8.64%) rallied on reports that the company was acquiring AT&T Inc's (T -0.88%) mobile and fiber optic networks in Connecticut. 3M Co (MMM +2.92%) rose after boosting their quarterly dividend. In other news, Facebook Inc (FB +1.95%) hit a new all-time high on news that the company would start using video ads on Thursday.
Turning to fixed income markets, Treasuries were higher along the curve. The benchmark 10-year note was up 11/32 to yield 2.84% and the 30-year bond gained 15/32 to yield 3.87%.
The Market (M criteria) rally has managed to overcome recent distributional pressure while still producing sufficient leadership (stocks hitting new highs) to maintain the ongoing uptrend. New buying efforts should always be selective. The CANSLIM.net Featured Stocks Page shows the most action-worthy candidates and their latest notes and a Headline Link directs members to the latest detailed analysis with data-packed graphs annotated by a Certified expert along with links to additional resources. The Premium Member Homepage includes "dynamic archives" to all prior pay reports published. Watch for an announcement via email concerning the next WEBCAST.
PICTURED: The Nasdaq Composite Index is still trading well above its 50-day moving average (DMA) line which acted as support during its prior consolidation.
|
 Kenneth J. Gruneisen started out as a licensed stockbroker in August 1987, a couple of months prior to the historic stock market crash that took the Dow Jones Industrial Average down -22.6% in a single day. He has published daily fact-based fundamental and technical analysis on high-ranked stocks online for two decades. Through FACTBASEDINVESTING.COM, Kenneth provides educational articles, news, market commentary, and other information regarding proven investment systems that work in good times and bad.
Comments contained in the body of this report are technical opinions only and are not necessarily those of Gruneisen Growth Corp. The material herein has been obtained from sources believed to be reliable and accurate, however, its accuracy and completeness cannot be guaranteed. Our firm, employees, and customers may effect transactions, including transactions contrary to any recommendation herein, or have positions in the securities mentioned herein or options with respect thereto. Any recommendation contained in this report may not be suitable for all investors and it is not to be deemed an offer or solicitation on our part with respect to the purchase or sale of any securities. |
|
 |
Networking and Semiconductor Indexes Rose Against Negative Backdrop
Kenneth J. Gruneisen - Passed the CAN SLIM® Master's Exam
Modest losses for the Retail Index ($RLX -0.47%) and financial indexes were a negative influence on the major averages as the Bank Index ($BKX -0.79%) and the Broker/Dealer Index ($XBD -0.33%) edged lower. Commodity-linked groups also had a slightly negative bias as the Oil Services Index ($OSX -0.51%), Integrated Oil Index ($XOI -0.50%), and the Gold & Silver Index ($XAU -0.41%) finished the session with small losses. The Networking Index ($NWX +0.32%) and the Semiconductor Index ($SOX +0.98%) posted gains while the Biotechnology Index ($BTK -1.14%) dragged on the tech sector.
Charts courtesy www.stockcharts.com
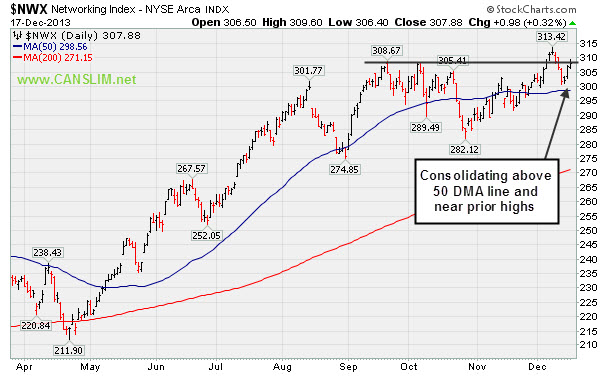
PICTURED: The Networking Index ($NWX +0.32%) is consolidating above its 50-day moving average (DMA) line and near prior highs.
| Oil Services |
$OSX |
274.71 |
-1.42 |
-0.51% |
+24.78% |
| Integrated Oil |
$XOI |
1,437.19 |
-7.29 |
-0.50% |
+15.73% |
| Semiconductor |
$SOX |
517.18 |
+5.03 |
+0.98% |
+34.66% |
| Networking |
$NWX |
307.88 |
+0.98 |
+0.32% |
+35.90% |
| Broker/Dealer |
$XBD |
153.21 |
-0.50 |
-0.33% |
+62.42% |
| Retail |
$RLX |
914.45 |
-4.35 |
-0.47% |
+40.03% |
| Gold & Silver |
$XAU |
82.60 |
-0.34 |
-0.41% |
-50.12% |
| Bank |
$BKX |
66.58 |
-0.53 |
-0.79% |
+29.84% |
| Biotech |
$BTK |
2,202.22 |
-25.34 |
-1.14% |
+42.35% |
|
|
|
 |
Enduring Distributional Pressure While Extended From Sound Base
Kenneth J. Gruneisen - Passed the CAN SLIM® Master's Exam
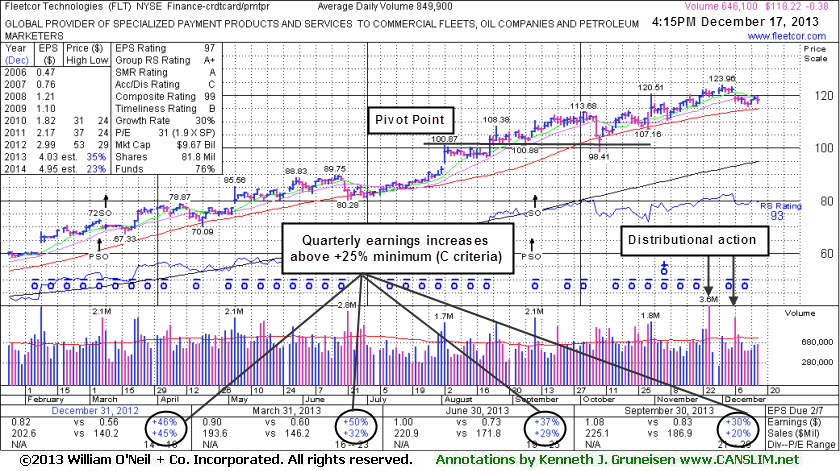
FleetCor Technologies, Inc. (FLT -$0.31% or -0.26% to $118.29) has been slumping toward its 50-day moving average (DMA) line ($114.85 now) since gapping down on 12/06/13 while retreating from all-time highs. A subsequent violation of that important near-term support level may trigger a technical sell signal. It has not formed any sound base pattern, and the annotated daily graph below highlights recent signs of distributional pressure. It has traded up as much as +74.25% since first featured in yellow at $71.14 in the mid-day report on 3/21/13 (read here). Disciplined investors avoid chasing stocks extended more than +5% above their pivot point or prior highs and always limit losses by selling any stock that falls more than -7% from their purchase price.
Last appearing in this FSU section on 11/13/13 with annotated daily and weekly graphs under the headline, "Perched Near All-Time High Tallying Quiet Gains", it was shown inching higher with light volume for a best-ever close. It is currently perched only -4.7% off its all-time high and no resistance remains due to overhead supply. The 9/06/13 summary, under the headline, "Holding Ground Following Latest Volume Driven Gains", showed a weekly graph where it recently rose with volume-driven gains from an advanced "3-weeks tight" base noted as a riskier "late stage" base.
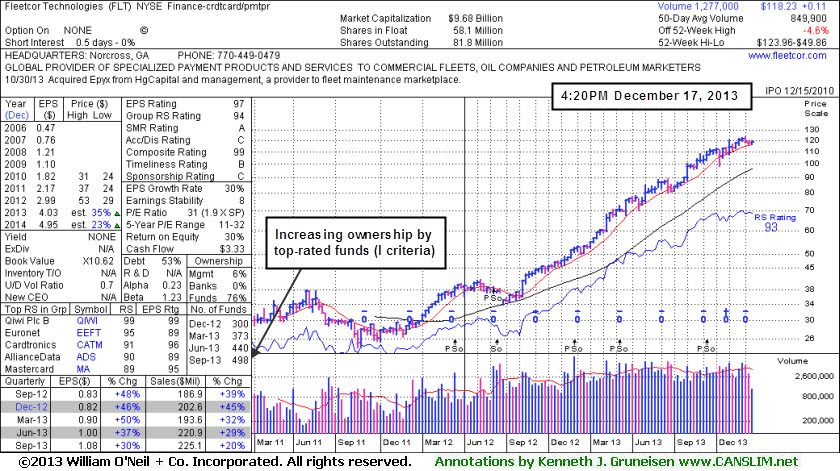
It reported earnings +30% on +20% sales revenues for the Sep '13 quarter, marking its 7th consecutive quarterly comparison with earnings above the +25% guideline (C criteria). The company completed yet another Secondary Offering on 9/11/13. On 3/14/12, 6/11/12, 11/29/12, and 3/08/13 it priced Secondary Offerings and it was previously noted, "Such offerings often are a short-term hindrance to upward price progress yet typically result in broader institutional ownership interest."
The number of top-rated funds owning its shares rose from 193 in Mar '12 to 498 in Sep '13, a reassuring sign concerning the I criteria. The company hails from the Finance - Credit Card Payment Processing group which improved to a 94 Group Relative Strength Rating from a 55 rating when shown in the FSU section on 7/18/13. Impressive strength and leadership from a couple of other firms in the same industry group is also considered a reassurance concerning the L criteria.
|
|
|
Color Codes Explained :
Y - Better candidates highlighted by our
staff of experts.
G - Previously featured
in past reports as yellow but may no longer be buyable under the
guidelines.
***Last / Change / Volume data in this table is the closing quote data***
Symbol/Exchange
Company Name
Industry Group |
PRICE |
CHANGE
(%Change) |
Day High |
Volume
(% DAV)
(% 50 day avg vol) |
52 Wk Hi
% From Hi |
Featured
Date |
Price
Featured |
Pivot Featured |
|
Max Buy |
CELG
-
NASDAQ
Celgene Corp
DRUGS - Drug Manufacturers - Major
|
$160.79
|
-2.59
-1.58% |
$164.17
|
2,621,205
91.24% of 50 DAV
50 DAV is 2,872,800
|
$173.80
-7.49%
|
9/12/2013
|
$149.50
|
PP = $150.02
|
|
MB = $157.52
|
Most Recent Note - 12/11/2013 6:00:39 PM
G - Retreated from its 52-week and all-time highs with today's loss after 5 consecutive gains. Prior highs in the $161 area define initial support to watch above its 50 DMA line.
>>> FEATURED STOCK ARTICLE : Cooling Volume Totals While Hovering Near Highs - 12/4/2013
View all notes |
Set NEW NOTE alert |
CANSLIM.net Company Profile |
SEC
News |
Chart |
Request a new note
C
A N
S L
I M


|
EGOV
-
NASDAQ
N I C Inc
INTERNET - Internet Software and Services
|
$22.72
|
+0.02
0.09% |
$22.80
|
175,839
61.81% of 50 DAV
50 DAV is 284,500
|
$25.99
-12.58%
|
10/18/2013
|
$25.17
|
PP = $23.66
|
|
MB = $24.84
|
Most Recent Note - 12/13/2013 5:50:36 PM
G - Slumped below its 50 DMA line this week with a streak of 5 consecutive losses raising concerns. Only a prompt rebound above that important short-term average would help its outlook improve. Disciplined investors always limit losses by selling any stock that falls more than -7% from their purchase price.
>>> FEATURED STOCK ARTICLE : Finding Support Near 50-Day Average During Distributional Pressure - 11/25/2013
View all notes |
Set NEW NOTE alert |
CANSLIM.net Company Profile |
SEC
News |
Chart |
Request a new note
C
A N
S L
I M
|
EQM
-
NYSE
E Q T Midstream Partners
ENERGY - Oil and Gas Pipelines
|
$52.89
|
-1.12
-2.07% |
$54.62
|
100,360
76.79% of 50 DAV
50 DAV is 130,700
|
$56.41
-6.24%
|
12/12/2013
|
$53.17
|
PP = $56.51
|
|
MB = $59.34
|
 Most Recent Note - 12/17/2013 4:06:14 PM
Y - Quietly consolidating above important support at its 50 DMA line and prior highs in the $51 area. Subsequent volume-driven gains for new highs are needed to trigger a proper technical buy signal.
>>> FEATURED STOCK ARTICLE : Finding Support Near 50-Day Moving Average While Perched Near Highs - 12/13/2013
View all notes |
Set NEW NOTE alert |
CANSLIM.net Company Profile |
SEC
News |
Chart |
Request a new note
C
A N
S L
I M
|
FB
-
NASDAQ
Facebook Inc Cl A
INTERNET
|
$54.86
|
+1.05
1.95% |
$55.18
|
78,449,537
105.05% of 50 DAV
50 DAV is 74,676,900
|
$54.83
0.06%
|
12/12/2013
|
$51.40
|
PP = $54.93
|
|
MB = $57.68
|
Most Recent Note - 12/17/2013 12:51:47 PM
Y - Touching new highs without great volume conviction behind today's 4th consecutive gain, rising from a 9-week cup shaped base without a handle. Highlighted in yellow with pivot point cited based on its 10/18/13 high plus 10 cents in the 12/12/13 mid-day report (read here). At least +40% above average volume must be behind gains above the pivot point to trigger a proper technical buy signal.
>>> FEATURED STOCK ARTICLE : Well Known Social Media Firm on Watch List While Still Base Building - 12/12/2013
View all notes |
Set NEW NOTE alert |
CANSLIM.net Company Profile |
SEC
News |
Chart |
Request a new note
C
A N
S L
I M
|
FLT
-
NYSE
Fleetcor Technologies
DIVERSIFIED SERVICES - Business/Management Services
|
$118.15
|
-0.45
-0.38% |
$119.24
|
670,178
78.85% of 50 DAV
50 DAV is 849,900
|
$123.96
-4.69%
|
8/19/2013
|
$99.01
|
PP = $100.97
|
|
MB = $106.02
|
Most Recent Note - 12/17/2013 5:14:48 PM
G - Enduring recent distributional pressure while consolidating above its 50 DMA line. A subsequent violation of that important near-term support level may trigger a technical sell signal. See the latest FSU analysis for more details and new annotated daily and weekly graphs.
>>> FEATURED STOCK ARTICLE : Enduring Distributional Pressure While Extended From Sound Base - 12/17/2013
View all notes |
Set NEW NOTE alert |
CANSLIM.net Company Profile |
SEC
News |
Chart |
Request a new note
C
A N
S L
I M
|
Symbol/Exchange
Company Name
Industry Group |
PRICE |
CHANGE
(%Change) |
Day High |
Volume
(% DAV)
(% 50 day avg vol) |
52 Wk Hi
% From Hi |
Featured
Date |
Price
Featured |
Pivot Featured |
|
Max Buy |
GNRC
-
NYSE
Generac Hldgs Inc
CONSUMER DURABLES - Electronic Equipment
|
$53.26
|
+0.01
0.02% |
$53.58
|
318,268
38.87% of 50 DAV
50 DAV is 818,700
|
$54.00
-1.37%
|
11/26/2013
|
$53.02
|
PP = $52.42
|
|
MB = $55.04
|
Most Recent Note - 12/16/2013 5:38:36 PM
Y - Rallied near its 52-week high today with a gain on light volume. It has been quietly consolidating above prior highs in the $52 area defining initial support to watch.
>>> FEATURED STOCK ARTICLE : Following Latest Breakout Prior Highs Define Support - 11/29/2013
View all notes |
Set NEW NOTE alert |
CANSLIM.net Company Profile |
SEC
News |
Chart |
Request a new note
C
A N
S L
I M
|
HLF
-
NYSE
Herbalife Ltd
DRUGS - Nutrition and Weight Management
|
$75.76
|
+0.93
1.24% |
$78.50
|
8,847,084
355.32% of 50 DAV
50 DAV is 2,489,900
|
$77.39
-2.11%
|
11/22/2013
|
$72.21
|
PP = $75.04
|
|
MB = $78.79
|
Most Recent Note - 12/17/2013 12:28:30 PM
Y - Hit a new 52-week high with today's 2nd consecutive volume-driven gain. Found support above its 50 DMA line recently, and no resistance remains due to overhead supply.
>>> FEATURED STOCK ARTICLE : Perched Near Highs Following Rebound - 11/22/2013
View all notes |
Set NEW NOTE alert |
CANSLIM.net Company Profile |
SEC
News |
Chart |
Request a new note
C
A N
S L
I M
|
JAZZ
-
NASDAQ
Jazz Pharmaceuticals Plc
DRUGS - Biotechnology
|
$112.10
|
-0.09
-0.08% |
$112.90
|
417,179
53.52% of 50 DAV
50 DAV is 779,500
|
$121.15
-7.47%
|
9/30/2013
|
$93.20
|
PP = $89.10
|
|
MB = $93.56
|
Most Recent Note - 12/16/2013 12:37:13 PM
G - Enduring distributional pressure and retreating from its 52-week high with higher volume behind today's loss. Recently noted as "extended from any sound base" with near-term support to watch at its 50 DMA line (now $100.85).
>>> FEATURED STOCK ARTICLE : Technically Extended Stock May Be a Dangerous Chase - 12/10/2013
View all notes |
Set NEW NOTE alert |
CANSLIM.net Company Profile |
SEC
News |
Chart |
Request a new note
C
A N
S L
I M
|
KORS
-
NYSE
Michael Kors Hldgs Ltd
RETAIL - Apparel Stores
|
$82.91
|
+0.71
0.86% |
$83.59
|
2,311,326
50.17% of 50 DAV
50 DAV is 4,607,200
|
$83.91
-1.19%
|
8/6/2013
|
$69.66
|
PP = $66.28
|
|
MB = $69.59
|
Most Recent Note - 12/12/2013 5:51:31 PM
G - Rallied toward its 52-week high for a best-ever close with near average volume behind today's gain. Prior highs in the $78 area define near-term support coinciding with its 50 DMA line.
>>> FEATURED STOCK ARTICLE : Consolidation Too Brief To Note New Pivot - 12/6/2013
View all notes |
Set NEW NOTE alert |
CANSLIM.net Company Profile |
SEC
News |
Chart |
Request a new note
C
A N
S L
I M
|
PCLN
-
NASDAQ
Priceline.Com Inc
INTERNET - Internet Software and Services
|
$1,160.90
|
-13.35
-1.14% |
$1,175.00
|
592,963
95.84% of 50 DAV
50 DAV is 618,700
|
$1,198.75
-3.16%
|
9/13/2013
|
$966.82
|
PP = $995.08
|
|
MB = $1,044.83
|
Most Recent Note - 12/11/2013 5:58:50 PM
G - Still hovering at its 52-week high. It may go on to produce more climactic gains but is currently extended from any sound base pattern. Reported earnings +40% on +33% sales revenues for the Sep '13 quarter versus the year-ago period, improving after a slightly sub par Jun '13 report.
>>> FEATURED STOCK ARTICLE : Extended From Any Sound Base Pattern - 12/3/2013
View all notes |
Set NEW NOTE alert |
CANSLIM.net Company Profile |
SEC
News |
Chart |
Request a new note
C
A N
S L
I M
|
Symbol/Exchange
Company Name
Industry Group |
PRICE |
CHANGE
(%Change) |
Day High |
Volume
(% DAV)
(% 50 day avg vol) |
52 Wk Hi
% From Hi |
Featured
Date |
Price
Featured |
Pivot Featured |
|
Max Buy |
SFUN
-
NYSE
Soufun Hldgs Ltd Ads A
INTERNET - Internet Information Providers
|
$75.73
|
+3.26
4.50% |
$76.76
|
1,267,889
89.41% of 50 DAV
50 DAV is 1,418,000
|
$77.45
-2.22%
|
10/17/2013
|
$58.02
|
PP = $53.87
|
|
MB = $56.56
|
Most Recent Note - 12/17/2013 4:04:42 PM
G - Volume was higher but still below average behind today's gain for a second-best close while challenging its all-time high hit last week. It is extended from any sound base pattern yet may produce more climactic gains. Prior highs and its 50 DMA line coincide in the $59 area defining important support to watch.
>>> FEATURED STOCK ARTICLE : Extended From Base Yet May Produce More Climactic Gains - 12/9/2013
View all notes |
Set NEW NOTE alert |
CANSLIM.net Company Profile |
SEC
News |
Chart |
Request a new note
C
A N
S L
I M
|
SSNC
-
NASDAQ
S S & C Technologies
COMPUTER SOFTWARE and SERVICES - Application Software
|
$40.15
|
-0.13
-0.32% |
$40.49
|
158,514
50.66% of 50 DAV
50 DAV is 312,900
|
$43.80
-8.33%
|
10/22/2013
|
$39.17
|
PP = $40.04
|
|
MB = $42.04
|
Most Recent Note - 12/16/2013 5:33:12 PM
G - Today's gain helped it rebound above its 50 DMA line helping its technical stance and outlook improve. See the latest FSU analysis for more details and new annotated daily and weekly graphs.
>>> FEATURED STOCK ARTICLE : Found Prompt Support After Damaging Losses Raised Concerns - 12/16/2013
View all notes |
Set NEW NOTE alert |
CANSLIM.net Company Profile |
SEC
News |
Chart |
Request a new note
C
A N
S L
I M
|
SSYS
-
NASDAQ
Stratasys Ltd
COMPUTER HARDWARE - Computer Peripherals
|
$118.46
|
+0.54
0.46% |
$118.94
|
732,039
62.00% of 50 DAV
50 DAV is 1,180,800
|
$134.00
-11.60%
|
10/11/2013
|
$102.94
|
PP = $105.38
|
|
MB = $110.65
|
Most Recent Note - 12/16/2013 5:34:16 PM
G - Consolidating above support at its 50 DMA line with volume totals cooling in recent weeks. More damaging losses would raise greater concerns and trigger worrisome technical sell signals. Previously noted with caution - "Reported earnings +13% on +153% sales revenues, below the +25% minimum earnings guideline (C criteria) raising fundamental concerns."
>>> FEATURED STOCK ARTICLE : Rallying For New Highs Despite Fundamental Flaw Raising Concern - 11/18/2013
View all notes |
Set NEW NOTE alert |
CANSLIM.net Company Profile |
SEC
News |
Chart |
Request a new note
C
A N
S L
I M
|
ULTI
-
NASDAQ
Ultimate Software Group
INTERNET - Internet Software and Services
|
$147.48
|
-0.52
-0.35% |
$148.91
|
170,977
118.24% of 50 DAV
50 DAV is 144,600
|
$162.88
-9.45%
|
10/16/2013
|
$142.95
|
PP = $151.18
|
|
MB = $158.74
|
Most Recent Note - 12/16/2013 12:51:03 PM
G - Still sputtering below its 50 DMA line, and the longer it lingers below that important short-term average, the worse its outlook gets. A prompt rebound above its 50 DMA line (now $151.41) is needed to help its technical stance.
>>> FEATURED STOCK ARTICLE : Consolidating Above 50 DMA Line and Prior Highs Defining Support - 11/21/2013
View all notes |
Set NEW NOTE alert |
CANSLIM.net Company Profile |
SEC
News |
Chart |
Request a new note
C
A N
S L
I M
|
VRX
-
NYSE
Valeant Pharmaceuticals
DRUGS - Drug Manufacturers - Other
|
$109.32
|
-1.60
-1.44% |
$112.40
|
936,992
85.62% of 50 DAV
50 DAV is 1,094,300
|
$115.40
-5.26%
|
9/11/2013
|
$100.26
|
PP = $105.50
|
|
MB = $110.78
|
Most Recent Note - 12/16/2013 3:42:59 PM
G - Rallying above its 50 DMA line with above average volume behind today's considerable gain, helping its technical stance improve. Recent lows in the $102 area define near-term support where a violation may trigger a technical sell signal. It has been resilient after it reported earnings +24% on +74% sales revenues for the Sep '13 quarter, a notch below the +25% minimum guideline (C criteria).
>>> FEATURED STOCK ARTICLE : Recent Lows Define Support to Watch Below 50 Day Average - 11/15/2013
View all notes |
Set NEW NOTE alert |
CANSLIM.net Company Profile |
SEC
News |
Chart |
Request a new note
C
A N
S L
I M
|
Symbol/Exchange
Company Name
Industry Group |
PRICE |
CHANGE
(%Change) |
Day High |
Volume
(% DAV)
(% 50 day avg vol) |
52 Wk Hi
% From Hi |
Featured
Date |
Price
Featured |
Pivot Featured |
|
Max Buy |
YNDX
-
NASDAQ
Yandex N V Class A
INTERNET - Internet Information Providers
|
$38.39
|
+0.06
0.16% |
$38.89
|
1,689,866
61.13% of 50 DAV
50 DAV is 2,764,600
|
$42.00
-8.60%
|
11/27/2013
|
$39.61
|
PP = $42.10
|
|
MB = $44.21
|
Most Recent Note - 12/12/2013 1:09:11 PM
G - Rebounding near its 50 DMA line with a solid gain backed by above average volume today. On the prior session it violated its 50 DMA line triggering a technical sell signal and it was noted - "Only a prompt rebound above its 50 DMA line would help its outlook improve. Challenged its 52-week high recently but did not produce the required volume-driven gains above the pivot point to trigger a proper new technical buy signal."
>>> FEATURED STOCK ARTICLE : Forming New Base Pattern With Little Resistance Remaining - 11/27/2013
View all notes |
Set NEW NOTE alert |
CANSLIM.net Company Profile |
SEC
News |
Chart |
Request a new note
C
A N
S L
I M
|
|
|
|
THESE ARE NOT BUY RECOMMENDATIONS!
Comments contained in the body of this report are technical
opinions only. The material herein has been obtained
from sources believed to be reliable and accurate, however,
its accuracy and completeness cannot be guaranteed.
This site is not an investment advisor, hence it does
not endorse or recommend any securities or other investments.
Any recommendation contained in this report may not
be suitable for all investors and it is not to be deemed
an offer or solicitation on our part with respect to
the purchase or sale of any securities. All trademarks,
service marks and trade names appearing in this report
are the property of their respective owners, and are
likewise used for identification purposes only.
This report is a service available
only to active Paid Premium Members.
You may opt-out of receiving report notifications
at any time. Questions or comments may be submitted
by writing to Premium Membership Services 665 S.E. 10 Street, Suite 201 Deerfield Beach, FL 33441-5634 or by calling 1-800-965-8307
or 954-785-1121.
|
|
|

