You are not logged in.
This means you
CAN ONLY VIEW reports that were published prior to Monday, March 10, 2025.
You
MUST UPGRADE YOUR MEMBERSHIP if you want to see any current reports.
AFTER MARKET UPDATE - MONDAY, DECEMBER 17TH, 2012
Previous After Market Report Next After Market Report >>>
|
|
|
|
DOW |
+100.38 |
13,235.39 |
+0.76% |
|
Volume |
701,916,420 |
+4% |
|
Volume |
1,851,553,600 |
+6% |
|
NASDAQ |
+39.27 |
3,010.60 |
+1.32% |
|
Advancers |
2,042 |
65% |
|
Advancers |
1,720 |
66% |
|
S&P 500 |
+16.78 |
1,430.36 |
+1.19% |
|
Decliners |
1,007 |
32% |
|
Decliners |
772 |
30% |
|
Russell 2000 |
+11.25 |
835.00 |
+1.37% |
|
52 Wk Highs |
79 |
|
|
52 Wk Highs |
53 |
|
|
S&P 600 |
+6.46 |
467.86 |
+1.40% |
|
52 Wk Lows |
28 |
|
|
52 Wk Lows |
33 |
|
|
 |
Volume Increases as Major Averages Rally to Start Week
Kenneth J. Gruneisen - Passed the CAN SLIM® Master's Exam
The major averages rallied on Monday while the volume totals were reported higher than the prior session totals on both the NYSE and the Nasdaq exchange. That indicated an encouraging pick-up in buying demand from the institutional crowd. Breadth was positive as advancers led decliners by more than a 2-1 margin on the NYSE and on the Nasdaq exchange. The total number of stocks hitting new 52-week highs outnumbered new 52-week lows on the NYSE and on the Nasdaq exchange. There were 36 high-ranked companies from the CANSLIM.net Leaders List making new 52-week highs and appearing on the CANSLIM.net BreakOuts Page, doubling the prior session total of 18 stocks. Any sustainable rally requires a healthy crop of companies hitting new 52-week highs, so it remains important to see meaningful leadership. There were gains for 9 of the 12 high-ranked companies currently included on the Featured Stocks Page.
The major averages advanced amid optimism surrounding fiscal cliff negotiations in Washington. The market was higher despite a report that showed manufacturing activity in the New York region declined for a fifth consecutive month in December.
Financials were among the best performers as Bank of America (BAC +3.97%) rose. American International Group Inc (AIG +2.98%) after announcing plans to sell its stake in Hong Kong insurer AIA Group. Coal stocks were notable decliners with Peabody Energy Corp (BTU -3.79%) falling.
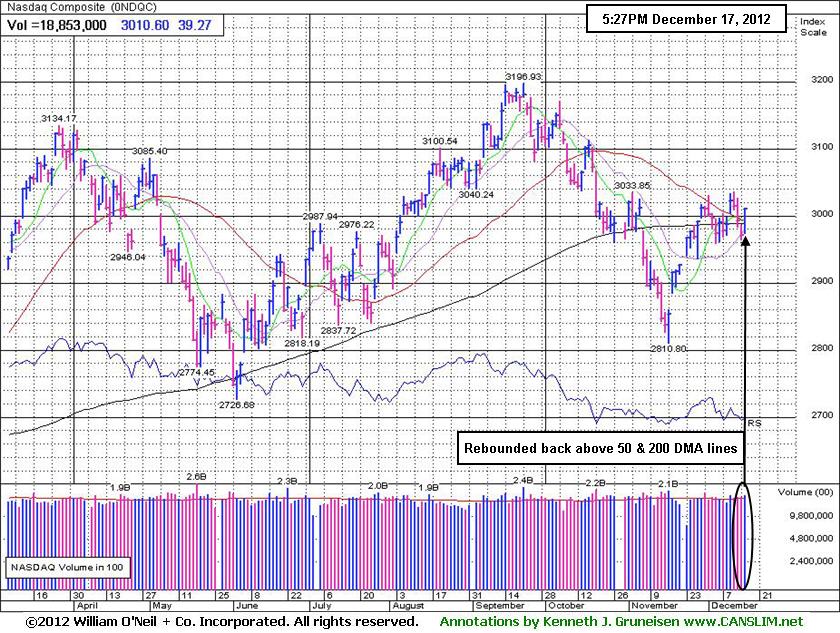
Technically, the market direction (M criteria) remains in a confirmed uptrend. After Monday's gains the Nasdaq Composite Index, benchmark S&P 500 Index, and the Dow Jones Industrial Average are again collectively above their respective 50-day moving average (DMA) lines. New buying efforts may be justified only in worthy high-ranked leaders. See the noteworthy companies included on the Featured Stocks Page.
Watch for an announcement via email concerning the next WEBCAST. The webcast will also be available via an updated link highlighted at the top of the Premium Member Homepage.
PICTURED: The Nasdaq Composite rebounded back above its 50-day and 200-day moving average (DMA) lines, finishing -5.8% off its 2012 high hit 9/21/12.
|
 Kenneth J. Gruneisen started out as a licensed stockbroker in August 1987, a couple of months prior to the historic stock market crash that took the Dow Jones Industrial Average down -22.6% in a single day. He has published daily fact-based fundamental and technical analysis on high-ranked stocks online for two decades. Through FACTBASEDINVESTING.COM, Kenneth provides educational articles, news, market commentary, and other information regarding proven investment systems that work in good times and bad.
Comments contained in the body of this report are technical opinions only and are not necessarily those of Gruneisen Growth Corp. The material herein has been obtained from sources believed to be reliable and accurate, however, its accuracy and completeness cannot be guaranteed. Our firm, employees, and customers may effect transactions, including transactions contrary to any recommendation herein, or have positions in the securities mentioned herein or options with respect thereto. Any recommendation contained in this report may not be suitable for all investors and it is not to be deemed an offer or solicitation on our part with respect to the purchase or sale of any securities. |
|
 |
Financial Indexes Underpinned Broader Market Rally
Kenneth J. Gruneisen - Passed the CAN SLIM® Master's Exam
Financial shares underpinned the market's rally on Monday as the were standout gainers. The Retail Index ($RLX +1.77%) also was a positive influence, and the Internet Index ($IIX +1.25%), Biotechnology Index ($BTK +1.08%), Networking Index ($NWX +1.07%), and Semiconductor Index ($SOX +0.42%) posted unanimous gains. Energy-related shares rose and the Oil Services Index ($OSX +1.16%) and Integrated Oil Index ($XOI +0.68%) ended modestly higher. The Healthcare Index ($HMO +0.82%) and the Gold & Silver Index ($XAU +0.18%) rounded out the widely positive session with gains.
Charts courtesy www.stockcharts.com
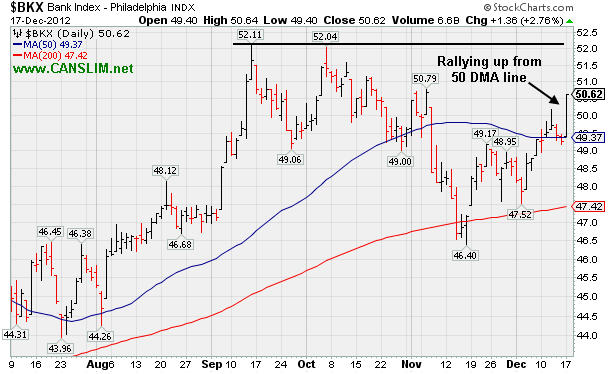
PICTURED 1: The Bank Index ($BKX +2.76%) rallied up from its 50-day moving average (DMA) line.
Charts courtesy www.stockcharts.com
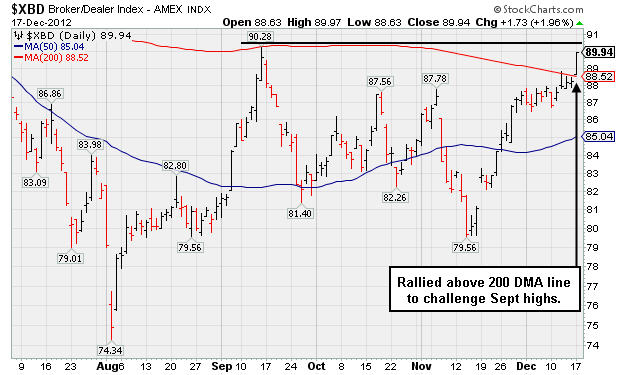
PICTURED 2: The Broker/Dealer Index ($XBD +1.96%) rallied above its 200 DMA line to challenge its September highs. Better action in the financial indexes of late is a reassuring sign concerning the broader market outlook, as CANSLIM.net's regular readers should note the often-mentioned importance of the financial indexes as reliable "leading indicators".
| Oil Services |
$OSX |
216.88 |
+2.48 |
+1.16% |
+0.28% |
| Healthcare |
$HMO |
2,524.81 |
+20.47 |
+0.82% |
+10.66% |
| Integrated Oil |
$XOI |
1,245.86 |
+8.42 |
+0.68% |
+1.36% |
| Semiconductor |
$SOX |
382.62 |
+1.59 |
+0.42% |
+4.99% |
| Networking |
$NWX |
222.46 |
+2.35 |
+1.07% |
+3.39% |
| Internet |
$IIX |
329.25 |
+4.05 |
+1.25% |
+16.86% |
| Broker/Dealer |
$XBD |
89.94 |
+1.73 |
+1.96% |
+8.01% |
| Retail |
$RLX |
662.99 |
+11.54 |
+1.77% |
+26.72% |
| Gold & Silver |
$XAU |
165.05 |
+0.30 |
+0.18% |
-8.63% |
| Bank |
$BKX |
50.62 |
+1.36 |
+2.76% |
+28.54% |
| Biotech |
$BTK |
1,551.14 |
+16.53 |
+1.08% |
+42.12% |
|
|
|
 |
Perched Near High With No Overhead Supply
Kenneth J. Gruneisen - Passed the CAN SLIM® Master's Exam
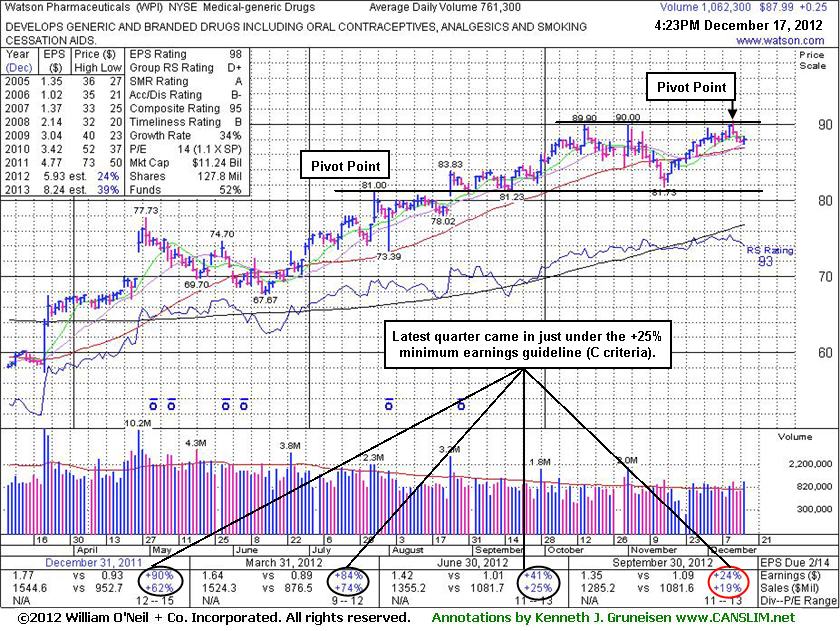
Watson Pharmaceuticals (WPI +$0.25 or +0.28% to $87.99) recently stalled after touching a new 52-week high, and yet no resistance remains due to overhead supply. Its color code was changed to yellow with new pivot point cited based on its 12/12/12 high plus 10 cents. It has formed an orderly base-on-base type pattern. Subsequent volume-driven gains above its pivot point may trigger a new (or add-on) technical buy signal.
As previously noted, quarterly comparisons for sales revenues and earnings increases have shown sequential deceleration in its growth rate raising some fundamental concerns. It recently reported earnings +24% on +19% sales revenues for the Sep '12 quarter, one notch below the +25% minimum guideline (C criteria). It has been resilient since last shown in this FSU section on 11/23/12 with an annotated graph under the headline, "Resilient Despite Noted Deceleration in Sales and Earnings Growth", as it rebounded above its 50-day moving average (DMA) line. The number of top-rated funds owning its shares rose from 1,011 in Mar '12 to 1,116 in Sep '12, a reassuring sign concerning the I criteria. It has maintained a strong annual earnings (A criteria) history.
|
|
|
Color Codes Explained :
Y - Better candidates highlighted by our
staff of experts.
G - Previously featured
in past reports as yellow but may no longer be buyable under the
guidelines.
***Last / Change / Volume data in this table is the closing quote data***
Symbol/Exchange
Company Name
Industry Group |
PRICE |
CHANGE
(%Change) |
Day High |
Volume
(% DAV)
(% 50 day avg vol) |
52 Wk Hi
% From Hi |
Featured
Date |
Price
Featured |
Pivot Featured |
|
Max Buy |
CELG
-
NASDAQ
Celgene Corp
DRUGS - Drug Manufacturers - Major
|
$80.44
|
+1.08
1.36% |
$80.58
|
2,764,279
99.20% of 50 DAV
50 DAV is 2,786,700
|
$82.78
-2.83%
|
12/11/2012
|
$82.24
|
PP = $81.34
|
|
MB = $85.41
|
 Most Recent Note - 12/17/2012 5:42:05 PM
Y - Halted its slide with a gain today. Slumped below its pivot point following a technical buy signal on 12/11/12, however its small losses lacked great volume conviction. Disciplined investors always limit losses if any stock falls -7% from their purchase price.
>>> The latest Featured Stock Update with an annotated graph appeared on 12/12/2012. Click here.
View all notes |
Alert me of new notes |
CANSLIM.net Company Profile |
SEC |
Zacks Reports |
StockTalk |
News |
Chart |
Request a new note
C
A N
S L
I M


|
CFNL
-
NASDAQ
Cardinal Financial Corp
BANKING - Regional - Southeast Banks
|
$15.78
|
+0.05
0.31% |
$16.01
|
295,584
146.76% of 50 DAV
50 DAV is 201,400
|
$16.21
-2.65%
|
12/3/2012
|
$15.20
|
PP = $16.31
|
|
MB = $17.13
|
Most Recent Note - 12/17/2012 5:34:43 PM
Y - Churned above average volume today without making meaningful price progress, action indicative of distributional pressure. A volume-driven rally above its pivot point may trigger a proper new (or add-on) technical buy signal.
>>> The latest Featured Stock Update with an annotated graph appeared on 12/10/2012. Click here.
View all notes |
Alert me of new notes |
CANSLIM.net Company Profile |
SEC |
Zacks Reports |
StockTalk |
News |
Chart |
Request a new note
C
A N
S L
I M
|
CMCSA
-
NASDAQ
Comcast Corp Cl A
MEDIA - CATV Systems
|
$37.54
|
+1.00
2.72% |
$37.57
|
15,029,834
128.32% of 50 DAV
50 DAV is 11,712,400
|
$37.96
-1.12%
|
12/3/2012
|
$37.08
|
PP = $38.06
|
|
MB = $39.96
|
Most Recent Note - 12/17/2012 5:36:01 PM
Y - Rallied up from its 50 DMA line with a volume-driven gain today, finishing only -1.1% off its 52-week high. Disciplined investors will watch for gains above the pivot point backed by at least the bare minimum +40% above average volume threshold to trigger a proper new (or add-on) technical buy signal before taking action.
>>> The latest Featured Stock Update with an annotated graph appeared on 12/7/2012. Click here.
View all notes |
Alert me of new notes |
CANSLIM.net Company Profile |
SEC |
Zacks Reports |
StockTalk |
News |
Chart |
Request a new note
C
A N
S L
I M
|
MIDD
-
NASDAQ
Middleby Corp
MANUFACTURING - Diversified Machinery
|
$129.35
|
+0.94
0.73% |
$129.43
|
79,952
103.97% of 50 DAV
50 DAV is 76,900
|
$129.99
-0.49%
|
10/8/2012
|
$118.46
|
PP = $122.67
|
|
MB = $128.80
|
Most Recent Note - 12/17/2012 5:43:22 PM
G - Still hovering just above its "max buy" level at today's close. Earnings +23% on +18% sales for the Sep '12 quarter, below the +25% minimum earnings guideline (C criteria), raised concerns.
>>> The latest Featured Stock Update with an annotated graph appeared on 12/6/2012. Click here.
View all notes |
Alert me of new notes |
CANSLIM.net Company Profile |
SEC |
Zacks Reports |
StockTalk |
News |
Chart |
Request a new note
C
A N
S L
I M
|
N
-
NYSE
Netsuite Inc
DIVERSIFIED SERVICES - Business/Management Services
|
$64.90
|
+0.48
0.75% |
$65.00
|
357,743
76.21% of 50 DAV
50 DAV is 469,400
|
$67.02
-3.16%
|
12/12/2012
|
$64.75
|
PP = $67.12
|
|
MB = $70.48
|
Most Recent Note - 12/17/2012 5:44:46 PM
Y - Small gain on light volume today for its second-best close ever. Fundamentals (C and A criteria) remain strong and it was highlighted in yellow with new pivot point cited based on its 10/26/12 high plus 10 cents. Disciplined investors will watch for subsequent volume-driven gains above the pivot point which may trigger a technical buy signal before taking action.
>>> The latest Featured Stock Update with an annotated graph appeared on 12/13/2012. Click here.
View all notes |
Alert me of new notes |
CANSLIM.net Company Profile |
SEC |
Zacks Reports |
StockTalk |
News |
Chart |
Request a new note
C
A N
S L
I M
|
Symbol/Exchange
Company Name
Industry Group |
PRICE |
CHANGE
(%Change) |
Day High |
Volume
(% DAV)
(% 50 day avg vol) |
52 Wk Hi
% From Hi |
Featured
Date |
Price
Featured |
Pivot Featured |
|
Max Buy |
NSR
-
NYSE
Neustar Inc
TELECOMMUNICATIONS - Diversified Communication Serv
|
$42.54
|
+0.84
2.01% |
$42.78
|
602,730
177.95% of 50 DAV
50 DAV is 338,700
|
$43.29
-1.73%
|
12/11/2012
|
$41.85
|
PP = $41.41
|
|
MB = $43.48
|
Most Recent Note - 12/17/2012 12:25:48 PM
Y - Trading up today with higher volume, yet it remains below its "max buy" level. Clinched a technical buy signal on 12/11/12 as it rallied from a 10-week base. Quarterly comparisons through Sep '12 showed 3 consecutive increases of more than the +25% minimum earnings guideline (C criteria). Prior highs near $41 define initial support to watch on pullbacks.
>>> The latest Featured Stock Update with an annotated graph appeared on 12/11/2012. Click here.
View all notes |
Alert me of new notes |
CANSLIM.net Company Profile |
SEC |
Zacks Reports |
StockTalk |
News |
Chart |
Request a new note
C
A N
S L
I M
|
RAX
-
NYSE
Rackspace Hosting Inc
INTERNET - Internet Software and; Services
|
$68.55
|
-0.18
-0.26% |
$70.37
|
2,085,040
141.09% of 50 DAV
50 DAV is 1,477,800
|
$70.00
-2.07%
|
11/26/2012
|
$66.26
|
PP = $67.18
|
|
MB = $70.54
|
Most Recent Note - 12/17/2012 12:33:48 PM
Y - Touched a new 52-week high today but reversed into the red even while no resistance remains due to overhead supply. Recent gains have lacked volume conviction as it inched its pivot point while it was repeatedly noted - "Confirming gains above its pivot point with at least +40% above average volume would be a welcome reassurance. Disciplined investors may be wise to use a tactic called 'pyramiding' to allow the market action to dictate their weighting in new buys while always limiting losses by selling if any stock ever falls more than -7% from their purchase price."
>>> The latest Featured Stock Update with an annotated graph appeared on 11/27/2012. Click here.
View all notes |
Alert me of new notes |
CANSLIM.net Company Profile |
SEC |
Zacks Reports |
StockTalk |
News |
Chart |
Request a new note
C
A N
S L
I M
|
RGR
-
NYSE
Sturm Ruger & Co Inc
CONSUMER DURABLES - Sporting Goods
|
$44.00
|
-1.57
-3.45% |
$46.57
|
1,947,138
368.22% of 50 DAV
50 DAV is 528,800
|
$55.66
-20.94%
|
11/20/2012
|
$52.23
|
PP = $52.65
|
|
MB = $55.28
|
Most Recent Note - 12/17/2012 3:53:53 PM
G - Down again today with heavier volume, enduring more damaging distributional pressure and slumping near its 200 DMA line. See the latest FSU analysis for more details and a new annotated graph.
>>> The latest Featured Stock Update with an annotated graph appeared on 12/14/2012. Click here.
View all notes |
Alert me of new notes |
CANSLIM.net Company Profile |
SEC |
Zacks Reports |
StockTalk |
News |
Chart |
Request a new note
C
A N
S L
I M
|
RNF
-
NYSE
Rentech Nitrogen Ptnr Lp
CHEMICALS - Agricultural Chemicals
|
$36.72
|
-0.78
-2.08% |
$37.82
|
332,892
99.76% of 50 DAV
50 DAV is 333,700
|
$41.15
-10.77%
|
11/1/2012
|
$39.11
|
PP = $40.15
|
|
MB = $42.16
|
Most Recent Note - 12/17/2012 5:37:49 PM
G - Slumped below its 50 DMA line raising concerns with a 4th consecutive loss today and its color code is changed to green. Recent gains with below average volume indicated lackluster buying demand from the institutional crowd. Disciplined investors may watch for volume-driven gains for a new high close to trigger a technical buy signal.
>>> The latest Featured Stock Update with an annotated graph appeared on 11/26/2012. Click here.
View all notes |
Alert me of new notes |
CANSLIM.net Company Profile |
SEC |
Zacks Reports |
StockTalk |
News |
Chart |
Request a new note
C
A N
S L
I M
|
ULTA
-
NASDAQ
Ulta Salon Cosm & Frag
SPECIALTY RETAIL - Specialty Retail, Other
|
$97.24
|
+2.24
2.36% |
$97.27
|
809,247
102.63% of 50 DAV
50 DAV is 788,500
|
$103.52
-6.07%
|
12/4/2012
|
$100.29
|
PP = $103.62
|
|
MB = $108.80
|
Most Recent Note - 12/17/2012 5:39:08 PM
Y - Found support at its 50 DMA line last week and tallied a 2nd consecutive gain today on near average volume. Disciplined investors will watch for volume-driven gains above the pivot point to trigger a new technical buy signal.
>>> The latest Featured Stock Update with an annotated graph appeared on 12/4/2012. Click here.
View all notes |
Alert me of new notes |
CANSLIM.net Company Profile |
SEC |
Zacks Reports |
StockTalk |
News |
Chart |
Request a new note
C
A N
S L
I M
|
Symbol/Exchange
Company Name
Industry Group |
PRICE |
CHANGE
(%Change) |
Day High |
Volume
(% DAV)
(% 50 day avg vol) |
52 Wk Hi
% From Hi |
Featured
Date |
Price
Featured |
Pivot Featured |
|
Max Buy |
VSI
-
NYSE
Vitamin Shoppe Inc
SPECIALTY RETAIL - Specialty Retail, Other
|
$56.45
|
+0.77
1.38% |
$56.56
|
265,701
109.79% of 50 DAV
50 DAV is 242,000
|
$61.89
-8.79%
|
12/3/2012
|
$59.06
|
PP = $61.99
|
|
MB = $65.09
|
Most Recent Note - 12/13/2012 1:02:47 PM
G - Still sputtering below its 50 DMA line today. Technically, the longer it lingers below its important short-term average the worse its outlook gets. The $61 area has been a stubborn resistance level in recent months.
>>> The latest Featured Stock Update with an annotated graph appeared on 12/3/2012. Click here.
View all notes |
Alert me of new notes |
CANSLIM.net Company Profile |
SEC |
Zacks Reports |
StockTalk |
News |
Chart |
Request a new note
C
A N
S L
I M
|
WPI
-
NYSE
Watson Pharmaceuticals
DRUGS - Drugs - Generic
|
$87.99
|
+0.25
0.28% |
$88.37
|
1,062,642
139.58% of 50 DAV
50 DAV is 761,300
|
$90.39
-2.66%
|
12/17/2012
|
$87.99
|
PP = $90.49
|
|
MB = $95.01
|
Most Recent Note - 12/17/2012 4:47:05 PM
Y - Consolidating within close striking distance of its 52-week high today and no resistance remains due to overhead supply. Color code is changed to yellow with new pivot point cited based on its 12/12/12 high plus 10 cents. See the latest FSU analysis for more details and a new annotated graph.
>>> The latest Featured Stock Update with an annotated graph appeared on 12/17/2012. Click here.
View all notes |
Alert me of new notes |
CANSLIM.net Company Profile |
SEC |
Zacks Reports |
StockTalk |
News |
Chart |
Request a new note
C
A N
S L
I M
|
|
|
|
THESE ARE NOT BUY RECOMMENDATIONS!
Comments contained in the body of this report are technical
opinions only. The material herein has been obtained
from sources believed to be reliable and accurate, however,
its accuracy and completeness cannot be guaranteed.
This site is not an investment advisor, hence it does
not endorse or recommend any securities or other investments.
Any recommendation contained in this report may not
be suitable for all investors and it is not to be deemed
an offer or solicitation on our part with respect to
the purchase or sale of any securities. All trademarks,
service marks and trade names appearing in this report
are the property of their respective owners, and are
likewise used for identification purposes only.
This report is a service available
only to active Paid Premium Members.
You may opt-out of receiving report notifications
at any time. Questions or comments may be submitted
by writing to Premium Membership Services 665 S.E. 10 Street, Suite 201 Deerfield Beach, FL 33441-5634 or by calling 1-800-965-8307
or 954-785-1121.
|
|
|

