You are not logged in.
This means you
CAN ONLY VIEW reports that were published prior to Monday, April 14, 2025.
You
MUST UPGRADE YOUR MEMBERSHIP if you want to see any current reports.
AFTER MARKET UPDATE - THURSDAY, DECEMBER 17TH, 2009
Previous After Market Report Next After Market Report >>>
|
|
|
|
DOW |
-132.86 |
10,308.26 |
-1.27% |
|
Volume |
1,716,633,080 |
+47% |
|
Volume |
1,967,178,560 |
-5% |
|
NASDAQ |
-26.86 |
2,180.05 |
-1.22% |
|
Advancers |
839 |
27% |
|
Advancers |
735 |
26% |
|
S&P 500 |
-13.10 |
1,096.08 |
-1.18% |
|
Decliners |
2,209 |
70% |
|
Decliners |
1,987 |
70% |
|
Russell 2000 |
-6.96 |
604.25 |
-1.14% |
|
52 Wk Highs |
129 |
|
|
52 Wk Highs |
60 |
|
|
S&P 600 |
-2.94 |
321.02 |
-0.91% |
|
52 Wk Lows |
4 |
|
|
52 Wk Lows |
27 |
|
|
 |
NYSE Indices Encounter More Distribution
Adam Sarhan, Contributing Writer,
The NYSE indices suffered another distribution day after the US dollar vaulted to a three-month high against the euro as concern spread that the Fed-induced rally will end in early 2010. Volume, an important indicator of institutional sponsorship, was reported mixed; higher than Wednesday's totals on the NYSE, yet lower on the Nasdaq exchange. The lower volume on the Nasdaq helped that index avoid adding another distribution day to its count. Decliners led advancers by more than a 2-to-1 ratio on the NYSE and by nearly a 3-to-1 ratio on the Nasdaq exchange. There were 20 high-ranked companies from the CANSLIM.net Leaders List that made a new 52-week high and appeared on the CANSLIM.net BreakOuts Page, substantially down from the total of 53 issues that appeared on the prior session. New 52-week highs still outnumbered new 52-week lows on the NYSE and on the Nasdaq exchange.
Before Thursday's opening bell, the Labor Department said initial jobless claims rose slightly last week to 480,000 versus expectations for 465,000. The report missed estimates but continued the recent trend which points to a possible bottoming in the labor market. The four week average, which smooths out the data, suggests a mild improvement with a sixteenth consecutive decline, down 5,250 to the lowest level since September 2008. For those of you that do not know, this report shows how many people filed for unemployment insurance for the first time and is released every Thursday at 8:30AM EST. However, the report is counter intuitive, if the number increases each week then that suggests a deteriorating labor market because more people are filing for unemployment claims.
At 10:00AM EST, the Conference Board released its index of leading economic indicators and the Philadelphia Fed released its index which measures general economic conditions in the region. The Conference Board's index, which is used to forecast the following 3-6 months, rose by +0.9% in November which bodes well for the first half of 2010. The index measures ten economic indicators that usually "lead" the overall economy. Meanwhile, the Philadelphia Fed's headline index rose more than 3.5 points to 20.4 which indicates healthy month-to-month acceleration in the region's manufacturing sector. The report also contrasts the Empire State index which came in just above zero on Tuesday. The fact that the market sold off on the news suggests investors were not happy with the data.
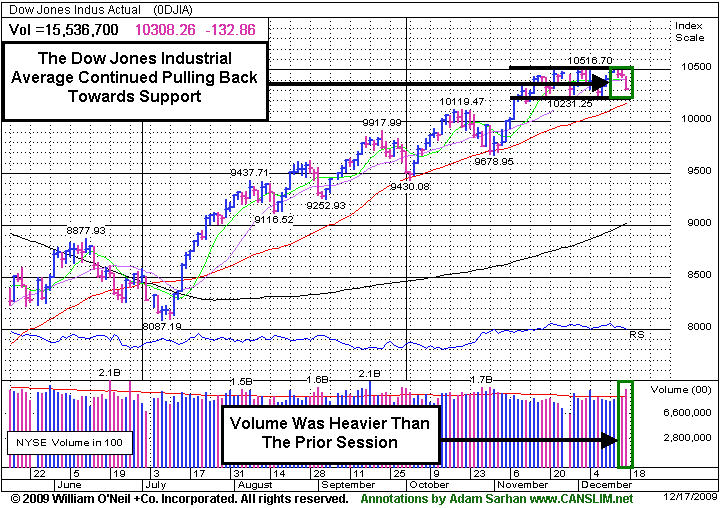
The US dollar's strength dominated the headlines on Thursday, and a slew of dollar denominated assets headed lower (mainly stocks and commodities). The major averages continued pulling back from important resistance levels and appear to be headed for a test of support levels which are just above their respective 50-day moving average lines.
PICTURED: The Dow Jones Industrial Average continued pulling back toward prior lows that are now a support level to watch near its 50-day moving average line.
|
|
|
 |
Gold & Silver Index a Standout Decliner
Kenneth J. Gruneisen - Passed the CAN SLIM® Master's Exam
Thursday's action was widely negative outside of the influential financial group, but among the more worrisome factors weighing on the market was the fact that financial shares continued to slump and the Broker/Dealer Index ($XBD -1.97%) and Bank Index ($BKX -1.53%) fell. The tech sector indices finished unanimously lower as the Biotechnology Index ($BTK -1.97%), Networking Index ($NWX -1.56%), Semiconductor Index ($SOX -1.46%), and Internet Index ($IIX -1.27%) lost ground. The Retail Index ($RLX -0.79%) and defensive areas also fell as the Healthcare Index ($HMO -1.10%), Integrated Oil Index ($XOI -1.58%), and Oil Services Index ($OSX -0.66%) ended lower.
Charts courtesy www.stockcharts.com
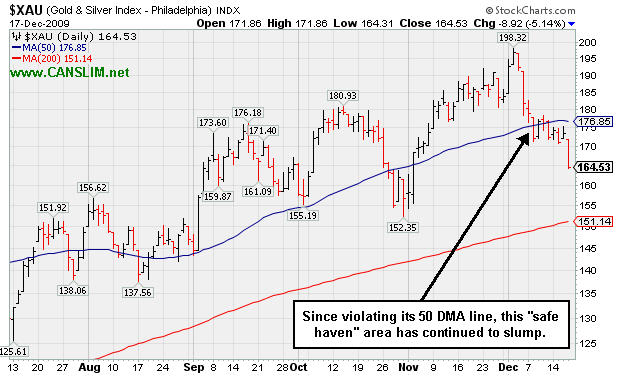
PICTURED: The Gold & Silver Index ($XAU -5.14%) was a standout decliner. It has offered investors no "safe haven" and only slumped worse since recently violating its 50-day moving average (DMA) line.
| Oil Services |
$OSX |
192.35 |
-1.27 |
-0.66% |
+58.46% |
| Healthcare |
$HMO |
1,470.71 |
-16.39 |
-1.10% |
+53.17% |
| Integrated Oil |
$XOI |
1,042.12 |
-16.76 |
-1.58% |
+6.37% |
| Semiconductor |
$SOX |
339.82 |
-5.04 |
-1.46% |
+60.16% |
| Networking |
$NWX |
223.40 |
-3.53 |
-1.56% |
+55.26% |
| Internet |
$IIX |
226.26 |
-2.92 |
-1.27% |
+69.14% |
| Broker/Dealer |
$XBD |
111.09 |
-2.23 |
-1.97% |
+43.40% |
| Retail |
$RLX |
406.72 |
-3.24 |
-0.79% |
+45.64% |
| Gold & Silver |
$XAU |
164.53 |
-8.92 |
-5.14% |
+32.85% |
| Bank |
$BKX |
41.70 |
-0.65 |
-1.53% |
-5.91% |
| Biotech |
$BTK |
894.24 |
-17.99 |
-1.97% |
+38.18% |
|
|
|
 |
Healthy Gains In Recent Weeks Indicate Accumulation
Kenneth J. Gruneisen - Passed the CAN SLIM® Master's Exam
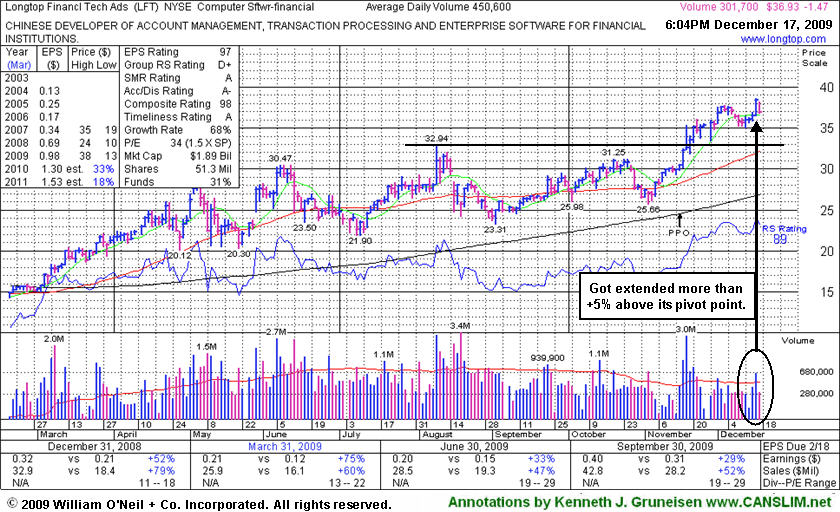
Longtop Financl Tech Ads (LFT -$1.47 or -3.83% to $36.93) suffered a loss on lighter volume today as it erased a large part of its prior gain with above average volume for a new all-time high. It has gotten extended after recently rising from a choppy 14-week base. It is extended more than +5% above its pivot point and above its "max buy" price, so disciplined investors would avoid chasing it. Its Up/Down Volume Ratio of 2.4 is an unbiased sign of recent accumulation taking place. Recent highs and its 50-day moving average line are now coinciding in the $31 area and defining an important support level to watch.
A proposed offering of additional shares on 11/16/09 seems well received by the market. Its fundamentals remain strong. The number of top-rated funds owning an interest in its shares rose from 20 funds in Dec '08 to 52 funds in Sept '09, which is reassuring concerning the L criteria. It has reported strong annual and quarterly earnings increases (good concerning the C & A criteria) backed by strong sales revenues increases. Return on Equity of +20% is above the +17% guideline. Upward progress can often be hindered by additional share offerings for the near-term, yet institutional investors typically increase their interest through the process. LFT was first featured at $22.19 on Thursday, April 02, 2009 in the CANSLIM.net Mid Day Breakouts Report (read here).
|
|
|
Color Codes Explained :
Y - Better candidates highlighted by our
staff of experts.
G - Previously featured
in past reports as yellow but may no longer be buyable under the
guidelines.
***Last / Change / Volume quote data in this table corresponds with the timestamp on the note***
Symbol/Exchange
Company Name
Industry Group |
Last |
Chg. |
Vol
% DAV |
Date Featured |
Price Featured |
Latest Pivot Point
Featured |
Status |
| Latest Max Buy Price |
ARST
-
|
$25.29
|
+0.33
|
389,076
70% DAV
558,900
|
9/1/2009
(Date
Featured) |
$19.91
(Price
Featured) |
PP = $20.90 |
G |
| MB = $21.95 |
Most Recent Note - 12/17/2009 5:48:40 PM
G - A 6th consecutive gain today on lighter than average volume helped rally further above its 50 DMA line. Its rebound this week above that short-term average has helped its outlook improve. Deterioration below its recent chart lows ($22.15) would raise more serious concerns. ARST was first featured in yellow at $19.91 in the 9/01/09 mid-day report with an annotated daily graph (read here).
>>> The latest Featured Stock Update with an annotated graph appeared on 12/16/2009. click here.
|
|
C
A
S
I |
News |
Chart |
SEC
View all notes Alert
me of new notes
Company
Profile
|
ASIA
-
|
$30.38
|
-0.57
|
936,521
69% DAV
1,351,400
|
10/14/2009
(Date
Featured) |
$23.05
(Price
Featured) |
PP = $22.19 |
G |
| MB = $23.30 |
Most Recent Note - 12/17/2009 5:49:49 PM
G - Today was its 3rd consecutive loss with below average volume since reaching a new 52-week high. It is extended from any sound base after its considerable gap up gain on 12/07/09 with almost 8 times average volume. Featured 10/14/09 in the mid-day report (read here) as it gapped up for a new 52-week high with 5 times average volume, triggering a technical buy signal by blasting above its pivot point. First featured in the August 2009 CANSLIM.net News (read here).
>>> The latest Featured Stock Update with an annotated graph appeared on 12/7/2009. click here.
|
|
C
A
S
I |
News |
Chart |
SEC
View all notes Alert
me of new notes
Company
Profile
|
BIDU
- NASDAQ
Baidu Inc Ads
INTERNET - Internet Information Providers
|
$415.84
|
-10.42
|
1,335,502
67% DAV
1,993,500
|
9/8/2009
(Date
Featured) |
$351.80
(Price
Featured) |
PP = $440.00 |
G |
| MB = $462.00 |
Most Recent Note - 12/17/2009 5:54:50 PM
G - Loss today led to a close below its 50 DMA line, raising concerns. Color code is changed to green, and it would need to rally above its latest pivot point to trigger a new buy signal. Technically, it has built a sloppy base over almost 8 weeks. Since quietly rallying to new highs in November it has stalled. BIDU traded up as much as +23% from its price when featured in yellow in the 9/08/09 Mid-Day BreakOuts Report (read here).
>>> The latest Featured Stock Update with an annotated graph appeared on 12/9/2009. click here.
|
|
C
A
S
I |
News |
Chart |
SEC
View all notes Alert
me of new notes
Company
Profile
|
CAAS
- NASDAQ
China Automotive Systems
AUTOMOTIVE - Auto Parts
|
$19.72
|
-0.59
|
316,168
51% DAV
615,100
|
11/30/2009
(Date
Featured) |
$18.84
(Price
Featured) |
PP = $17.62 |
G |
| MB = $18.50 |
Most Recent Note - 12/17/2009 5:56:47 PM
G - After another worrisome negative reversal on 12/15/09 it has still been hovering near all-time highs. Still extended from a sound base under the investment system rules. The Chinese maker of power steering systems was rising from an advanced "3-weeks tight" type of chart pattern as it showed up in yellow in the 11/30/09 mid-day report (read here). Recent quarters show accelerating sales revenues and earnings increases, and it has a good annual earnings history.
>>> The latest Featured Stock Update with an annotated graph appeared on 12/11/2009. click here.
|
|
C
A
S
I |
News |
Chart |
SEC
View all notes Alert
me of new notes
Company
Profile
|
CACC
- NASDAQ
Credit Acceptance Corp
FINANCIAL SERVICES - Credit Services
|
$39.54
|
+0.49
|
74,190
211% DAV
35,100
|
9/29/2009
(Date
Featured) |
$33.48
(Price
Featured) |
PP = $37.10 |
G |
| MB = $38.96 |
Most Recent Note - 12/17/2009 5:58:46 PM
G - Posted another gain today after its 12/16/09 gain with almost 6 times average volume triggered a technical buy signal. It rallied with above average volume behind 5 consecutive gains. Color code was changed to green as it got too extended from a sound base. An article in the paper on 12/14 discussed its thin trading and that it can lead to great volatility (read here). Recent chart lows in the $33 area are an important support level to watch now. The Finance - Consumer/Commercial Loans firm has maintained a great track record of annual and quarterly sales revenues and earnings increases. It was featured on 9/29/09 in yellow in the mid-day report (read here
>>> The latest Featured Stock Update with an annotated graph appeared on 12/10/2009. click here.
|
|
C
A
S
I |
News |
Chart |
SEC
View all notes Alert
me of new notes
Company
Profile
|
CRM
- NYSE
Salesforce.com Inc
INTERNET - Internet Software & Services
|
$64.88
|
-0.90
|
1,024,052
65% DAV
1,582,200
|
8/16/2009
(Date
Featured) |
$47.12
(Price
Featured) |
PP = $45.59 |
G |
| MB = $47.87 |
Most Recent Note - 12/17/2009 5:59:29 PM
G - Small loss today on below average volume. It has been consolidating for nearly 5 weeks above important support at that short-term average line, yet hovering within close striking distance of its 52 week high. Last week it tested support at its 50 DMA line.
>>> The latest Featured Stock Update with an annotated graph appeared on 12/8/2009. click here.
|
|
C
A
S
I |
News |
Chart |
SEC
View all notes Alert
me of new notes
Company
Profile
|
CTRP
- NASDAQ
Ctrip.com Intl Ltd Adr
LEISURE - Resorts & Casinos
|
$75.12
|
-2.25
|
1,134,839
104% DAV
1,089,700
|
12/1/2009
(Date
Featured) |
$75.38
(Price
Featured) |
PP = $73.91 |
Y |
| MB = $77.61 |
Most Recent Note - 12/17/2009 6:00:31 PM
Y - Closed near its session low today, negatively reversing after briefly trading above its "max buy" price. Featured on 12/01/09 in yellow in the mid-day report (read here). It triggered a technical buy signal as it rose with more than +50% above average volume from a brief consolidation resembling a "high-tight-flag" pattern which it formed after repairing a late-October breach of its 50 DMA line. Fundamentally, its sales revenues and earnings increases have shown acceleration in the 3 most recent quarterly comparisons and rose above the +25% guideline. Based on weak technical action it was dropped from the Featured Stocks list on 6/10/08, when it closed at $49.84, yet it has rebounded very impressively from subsequent lows in the $16 area.
>>> The latest Featured Stock Update with an annotated graph appeared on 12/14/2009. click here.
|
|
C
A
S
I |
News |
Chart |
SEC
View all notes Alert
me of new notes
Company
Profile
|
HEAT
-
|
$15.89
|
-0.44
|
711,982
80% DAV
890,800
|
11/17/2009
(Date
Featured) |
$12.00
(Price
Featured) |
PP = $12.61 |
G |
| MB = $13.24 |
Most Recent Note - 12/17/2009 6:01:09 PM
G - Hovering near its 52-week high, extended from its prior base after 3 weekly gains on above average volume in the past 4 weeks. The investment system rules say a stock should be held a minimum of 8 weeks after rising more than +20% in the first 2-3 weeks from being bought. First featured in yellow in the 11/17/09 mid-day report (read here) when technically rising from a "double bottom" base, reaching a new all-time high.
>>> The latest Featured Stock Update with an annotated graph appeared on 12/15/2009. click here.
|
|
C
A
S
I |
News |
Chart |
SEC
View all notes Alert
me of new notes
Company
Profile
|
LFT
-
|
$36.93
|
-1.47
|
301,749
67% DAV
450,600
|
11/17/2009
(Date
Featured) |
$31.77
(Price
Featured) |
PP = $33.04 |
G |
| MB = $34.69 |
Most Recent Note - 12/17/2009 6:03:23 PM
G - Loss on lighter volume today erased a large part of its prior gain with above average volume for a new all-time high. It got extended after recently rising from a choppy 14-week base. Prior chart highs in the $31 area are an initial support level to watch. A proposed offering of additional shares on 11/16/09 seems well received by the market. Its fundamentals remain strong.
>>> The latest Featured Stock Update with an annotated graph appeared on 12/17/2009. click here.
|
|
C
A
S
I |
News |
Chart |
SEC
View all notes Alert
me of new notes
Company
Profile
|
|
|
|
THESE ARE NOT BUY RECOMMENDATIONS!
Comments contained in the body of this report are technical
opinions only. The material herein has been obtained
from sources believed to be reliable and accurate, however,
its accuracy and completeness cannot be guaranteed.
This site is not an investment advisor, hence it does
not endorse or recommend any securities or other investments.
Any recommendation contained in this report may not
be suitable for all investors and it is not to be deemed
an offer or solicitation on our part with respect to
the purchase or sale of any securities. All trademarks,
service marks and trade names appearing in this report
are the property of their respective owners, and are
likewise used for identification purposes only.
This report is a service available
only to active Paid Premium Members.
You may opt-out of receiving report notifications
at any time. Questions or comments may be submitted
by writing to Premium Membership Services 665 S.E. 10 Street, Suite 201 Deerfield Beach, FL 33441-5634 or by calling 1-800-965-8307
or 954-785-1121.
|
|
|


