You are not logged in.
This means you
CAN ONLY VIEW reports that were published prior to Monday, April 14, 2025.
You
MUST UPGRADE YOUR MEMBERSHIP if you want to see any current reports.
AFTER MARKET UPDATE - MONDAY, DECEMBER 16TH, 2013
Previous After Market Report Next After Market Report >>>
|
|
|
|
DOW |
+129.21 |
15,884.57 |
+0.82% |
|
Volume |
668,877,810 |
+7% |
|
Volume |
1,818,686,950 |
+21% |
|
NASDAQ |
+28.54 |
4,029.52 |
+0.71% |
|
Advancers |
2,048 |
65% |
|
Advancers |
1,749 |
65% |
|
S&P 500 |
+11.22 |
1,786.54 |
+0.63% |
|
Decliners |
1,008 |
32% |
|
Decliners |
817 |
30% |
|
Russell 2000 |
+12.80 |
1,119.85 |
+1.16% |
|
52 Wk Highs |
110 |
|
|
52 Wk Highs |
108 |
|
|
S&P 600 |
+7.31 |
644.09 |
+1.15% |
|
52 Wk Lows |
78 |
|
|
52 Wk Lows |
28 |
|
|
 |
Major Averages Posted Solid Gains on Higher Volume
Kenneth J. Gruneisen - Passed the CAN SLIM® Master's Exam
Equity markets held solid gains into the closing bell on Monday. The volume totals were reported higher on the NYSE and on the Nasdaq exchange, indicating encouraging accumulation of stocks by the institutional crowd. Breadth as positive as advancers led decliners by 2-1 on the NYSE and on the Nasdaq exchange. There were 44 high-ranked companies from the CANSLIM.net Leaders List that made new 52-week highs and appeared on the CANSLIM.net BreakOuts Page, up from a total of 20 stocks on the prior session. The list of stocks hitting new 52-week highs outnumbered new lows on the Nasdaq exchange and on the NYSE. There were gains for 10 of the 16 high-ranked companies currently included on the Featured Stocks Page.
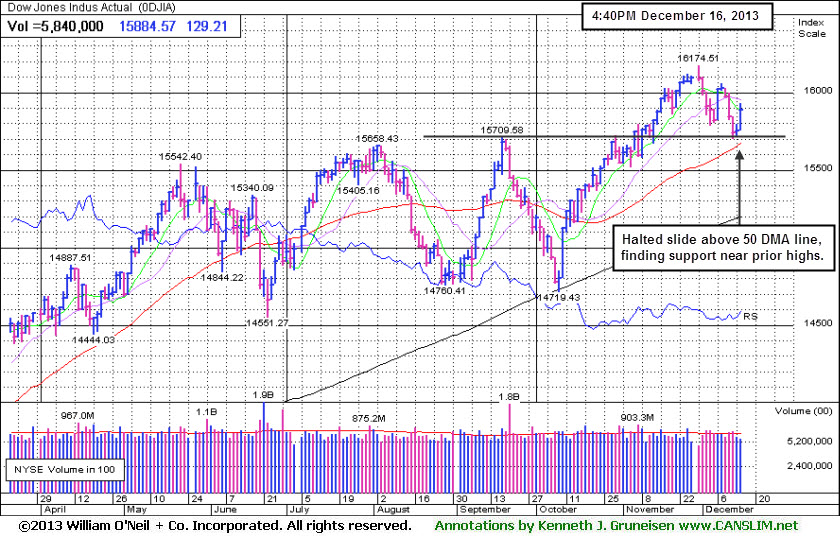
The S&P 500 Index added 11 points to 1,786 and the NASDAQ advanced 28 points, closing at 4,029. Stocks traded higher from the opening bell as investors looked to take advantage of the Dow and S&P 500's 2-week decline. A batch of positive economic reports helped buoy the major averages as concerns over Fed stimulus tapering appeared muted.
Most sectors on the S&P 500 finished higher, led by industrials like Caterpillar Inc (CAT +1.55%) . Tech stocks also showed strength as Apple Inc (AAPL +0.55%) edged higher. On the M&A front, microchip manufacturer LSI Corp (LSI +38.56%) gapped up after announcing that it was being acquired by Avago Technologies Ltd (AVGO +9.75%) in a $6.6 billion deal.
Turning to fixed income markets, Treasuries were modestly lower along the curve. The benchmark 10-year note was down 1/16 of a point to yield 2.88% and the 30-year bond was off 9/32 to yield 3.90%.
The Market (M criteria) rally has managed to overcome recent distributional pressure while still producing sufficient leadership (stocks hitting new highs) to maintain the ongoing uptrend. New buying efforts should always be selective. The CANSLIM.net Featured Stocks Page shows the most action-worthy candidates and their latest notes and a Headline Link directs members to the latest detailed analysis with data-packed graphs annotated by a Certified expert along with links to additional resources. The Premium Member Homepage includes "dynamic archives" to all prior pay reports published. Watch for an announcement via email concerning the next WEBCAST.
PICTURED: The Dow Jones Industrial Average was up 129 points to 15,884, halting its slide above its 50-day moving average (DMA) line after testing support at prior highs.
|
 Kenneth J. Gruneisen started out as a licensed stockbroker in August 1987, a couple of months prior to the historic stock market crash that took the Dow Jones Industrial Average down -22.6% in a single day. He has published daily fact-based fundamental and technical analysis on high-ranked stocks online for two decades. Through FACTBASEDINVESTING.COM, Kenneth provides educational articles, news, market commentary, and other information regarding proven investment systems that work in good times and bad.
Comments contained in the body of this report are technical opinions only and are not necessarily those of Gruneisen Growth Corp. The material herein has been obtained from sources believed to be reliable and accurate, however, its accuracy and completeness cannot be guaranteed. Our firm, employees, and customers may effect transactions, including transactions contrary to any recommendation herein, or have positions in the securities mentioned herein or options with respect thereto. Any recommendation contained in this report may not be suitable for all investors and it is not to be deemed an offer or solicitation on our part with respect to the purchase or sale of any securities. |
|
 |
Retail, Financial, Tech, and Commodity-Linked Groups Rose
Kenneth J. Gruneisen - Passed the CAN SLIM® Master's Exam
The Retail Index ($RLX +0.48%) was a positive influence on the major averages along with financial shares as the Bank Index ($BKX +0.74%) and the Broker/Dealer Index ($XBD +0.26%) posted gains. Energy-related shares rose as the Integrated Oil Index ($XOI +0.84%) and the Oil Services Index ($OSX +1.27%) spurted higher. Gold & Silver Index ($XAU +0.96%) also rose. The tech sector saw solid gains from the Semiconductor Index ($SOX +1.31%) and the Networking Index ($NWX +1.60%) while the Biotechnology Index ($BTK +0.25%) posted a smaller gain.
Charts courtesy www.stockcharts.com
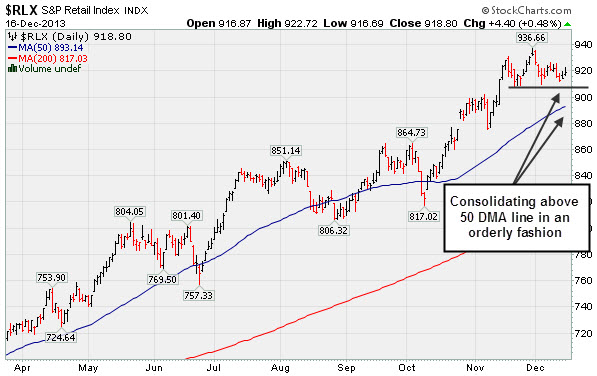
PICTURED: The Retail Index ($RLX +0.48%) is consolidating in an orderly fashion well above its 50-day moving average (DMA) line.
| Oil Services |
$OSX |
276.13 |
+3.45 |
+1.27% |
+25.42% |
| Integrated Oil |
$XOI |
1,444.48 |
+12.10 |
+0.84% |
+16.32% |
| Semiconductor |
$SOX |
512.15 |
+6.63 |
+1.31% |
+33.35% |
| Networking |
$NWX |
306.90 |
+4.82 |
+1.60% |
+35.47% |
| Broker/Dealer |
$XBD |
153.71 |
+0.40 |
+0.26% |
+62.95% |
| Retail |
$RLX |
918.80 |
+4.40 |
+0.48% |
+40.69% |
| Gold & Silver |
$XAU |
82.94 |
+0.79 |
+0.96% |
-49.92% |
| Bank |
$BKX |
67.11 |
+0.49 |
+0.74% |
+30.87% |
| Biotech |
$BTK |
2,227.56 |
+5.57 |
+0.25% |
+43.99% |
|
|
|
 |
Found Prompt Support After Damaging Losses Raised Concerns
Kenneth J. Gruneisen - Passed the CAN SLIM® Master's Exam
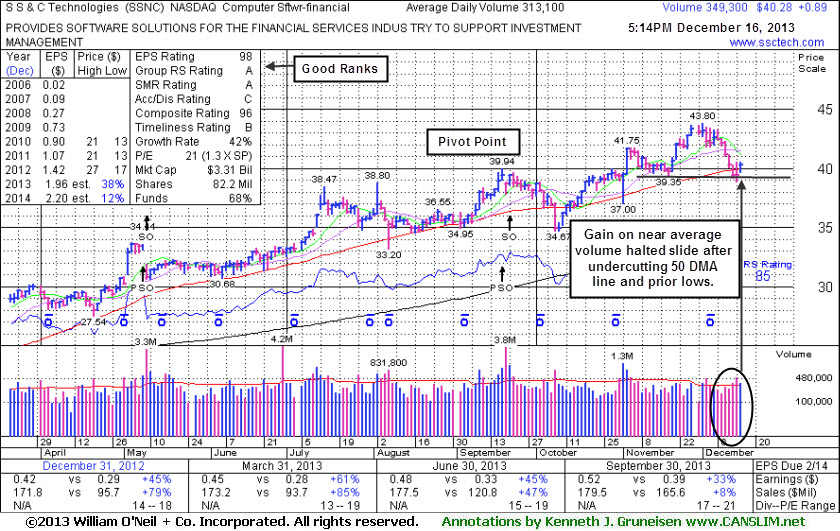
S S & C Technologies Holdings, Inc (SSNC +$0.89 or +2.26% to $40.28) posted a gain today with near average volume and managed to finish the session above its 50-day moving average (DMA) line. Technically, the prompt rebound above that short-term average helped its outlook improve. Damaging losses had recently raised concerns by undercutting the 50 DMA line and prior lows. Subsequent losses undercutting the latest low ($38.85 on 12/13/13) would raise greater concerns and trigger more worrisome sell signals.
SSNC was last shown in this FSU section on 11/12/13 with annotated graphs under the headline, "Volume Totals Cooling Following Recent Volume-Driven Breakout". It had rallied for a new 52-week high with 2 times average volume on 11/04/13 while rising above the pivot point triggering a new (or add-on) technical buy signal.
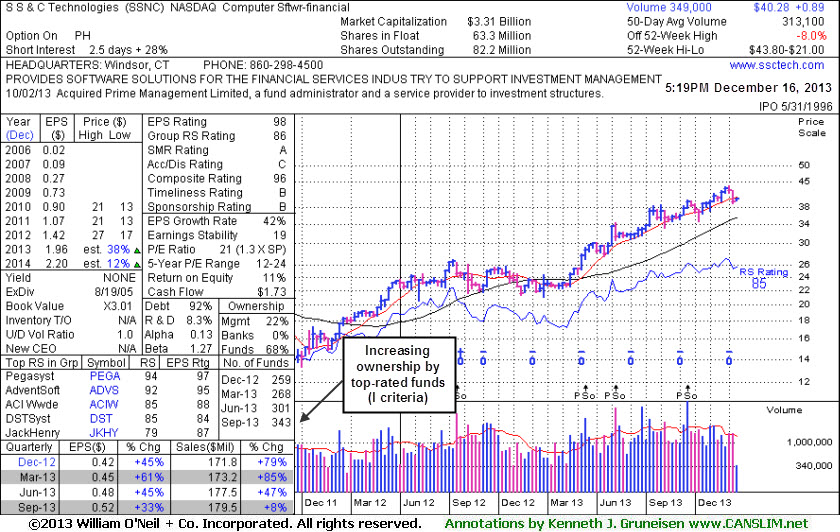
The number of top-rated funds owning its shares rose from 260 in Dec' 12 to 343 in Sep '13, a reassuring sign concerning the I criteria of the fact-based investment system. The high-ranked Computer Software - Financial firm completed previously noted Secondary Offerings on 5/09/13, 3/14/13, and on 7/19/12. Such offerings can be a short-term hindrance, however new institutional owners are often attracted when a company has the help of underwriters in placing shares during offerings.
It has earned high ranks due to its strong earnings history. The past 6 quarterly comparisons through Sep '13 showed earnings increases above the +25% minimum guideline (C criteria) for buy candidates. Its annual earnings (A criteria) history has also been very strong. The Computer Software - Financial industry group currently has an A Rating, and leadership among other individual issues in the group is a reassuring sign concerning the L criteria.
|
|
|
Color Codes Explained :
Y - Better candidates highlighted by our
staff of experts.
G - Previously featured
in past reports as yellow but may no longer be buyable under the
guidelines.
***Last / Change / Volume data in this table is the closing quote data***
Symbol/Exchange
Company Name
Industry Group |
PRICE |
CHANGE
(%Change) |
Day High |
Volume
(% DAV)
(% 50 day avg vol) |
52 Wk Hi
% From Hi |
Featured
Date |
Price
Featured |
Pivot Featured |
|
Max Buy |
CELG
-
NASDAQ
Celgene Corp
DRUGS - Drug Manufacturers - Major
|
$163.38
|
-1.52
-0.92% |
$167.79
|
2,457,710
85.39% of 50 DAV
50 DAV is 2,878,100
|
$173.80
-6.00%
|
9/12/2013
|
$149.50
|
PP = $150.02
|
|
MB = $157.52
|
Most Recent Note - 12/11/2013 6:00:39 PM
G - Retreated from its 52-week and all-time highs with today's loss after 5 consecutive gains. Prior highs in the $161 area define initial support to watch above its 50 DMA line.
>>> FEATURED STOCK ARTICLE : Cooling Volume Totals While Hovering Near Highs - 12/4/2013
View all notes |
Set NEW NOTE alert |
CANSLIM.net Company Profile |
SEC
News |
Chart |
Request a new note
C
A N
S L
I M


|
EGOV
-
NASDAQ
N I C Inc
INTERNET - Internet Software and Services
|
$22.70
|
+0.21
0.93% |
$22.86
|
267,838
94.54% of 50 DAV
50 DAV is 283,300
|
$25.99
-12.66%
|
10/18/2013
|
$25.17
|
PP = $23.66
|
|
MB = $24.84
|
Most Recent Note - 12/13/2013 5:50:36 PM
G - Slumped below its 50 DMA line this week with a streak of 5 consecutive losses raising concerns. Only a prompt rebound above that important short-term average would help its outlook improve. Disciplined investors always limit losses by selling any stock that falls more than -7% from their purchase price.
>>> FEATURED STOCK ARTICLE : Finding Support Near 50-Day Average During Distributional Pressure - 11/25/2013
View all notes |
Set NEW NOTE alert |
CANSLIM.net Company Profile |
SEC
News |
Chart |
Request a new note
C
A N
S L
I M
|
EQM
-
NYSE
E Q T Midstream Partners
ENERGY - Oil and Gas Pipelines
|
$54.01
|
-0.39
-0.72% |
$55.00
|
75,566
57.68% of 50 DAV
50 DAV is 131,000
|
$56.41
-4.25%
|
12/12/2013
|
$53.17
|
PP = $56.51
|
|
MB = $59.34
|
Most Recent Note - 12/13/2013 5:48:19 PM
Y - Rallying from support at its 50 DMA line and prior highs in the $51 area after highlighted in yellow in the 12/12/13 mid-day report with new pivot point cited based on its 11/18/13 high plus 10 cents. Subsequent volume-driven gains for new highs are needed to trigger a proper technical buy signal. See the latest FSU analysis for more details and a new annotated graph.
>>> FEATURED STOCK ARTICLE : Finding Support Near 50-Day Moving Average While Perched Near Highs - 12/13/2013
View all notes |
Set NEW NOTE alert |
CANSLIM.net Company Profile |
SEC
News |
Chart |
Request a new note
C
A N
S L
I M
|
FB
-
NASDAQ
Facebook Inc Cl A
INTERNET
|
$53.81
|
+0.49
0.92% |
$54.50
|
84,969,543
114.11% of 50 DAV
50 DAV is 74,463,400
|
$54.83
-1.85%
|
12/12/2013
|
$51.40
|
PP = $54.93
|
|
MB = $57.68
|
Most Recent Note - 12/12/2013 5:00:04 PM
Y - Posted a gain today with +25% above average volume while rallying further above its 50 DMA line, still working on a 9-week cup shaped base. Highlighted in yellow with pivot point cited based on its 10/18/13 high plus 10 cents in the earlier mid-day report (read here). Disciplined investors may watch for subsequent volume-driven gains above its pivot point which are necessary to trigger a proper technical buy signal. Reported earnings +108% on +60% sales revenues for the Sep '13 quarter versus the year ago period, its 2nd quarterly comparison with earnings above the +25% minimum. Sequential acceleration in quarterly sales and earnings increases helps it look like a better match with the fact-based investment system's winning models. See the latest FSU analysis for more details and a new annotated graph.
>>> FEATURED STOCK ARTICLE : Well Known Social Media Firm on Watch List While Still Base Building - 12/12/2013
View all notes |
Set NEW NOTE alert |
CANSLIM.net Company Profile |
SEC
News |
Chart |
Request a new note
C
A N
S L
I M
|
FLT
-
NYSE
Fleetcor Technologies
DIVERSIFIED SERVICES - Business/Management Services
|
$118.60
|
+0.48
0.41% |
$120.00
|
624,760
73.49% of 50 DAV
50 DAV is 850,100
|
$123.96
-4.32%
|
8/19/2013
|
$99.01
|
PP = $100.97
|
|
MB = $106.02
|
Most Recent Note - 12/12/2013 5:48:00 PM
G - Slumping toward its 50 DMA line since gapping down on 12/06/13 while retreating from all-time highs. A subsequent violation of that important near-term support level may trigger a technical sell signal.
>>> FEATURED STOCK ARTICLE : Perched Near All-Time High Tallying Quiet Gains - 11/13/2013
View all notes |
Set NEW NOTE alert |
CANSLIM.net Company Profile |
SEC
News |
Chart |
Request a new note
C
A N
S L
I M
|
Symbol/Exchange
Company Name
Industry Group |
PRICE |
CHANGE
(%Change) |
Day High |
Volume
(% DAV)
(% 50 day avg vol) |
52 Wk Hi
% From Hi |
Featured
Date |
Price
Featured |
Pivot Featured |
|
Max Buy |
GNRC
-
NYSE
Generac Hldgs Inc
CONSUMER DURABLES - Electronic Equipment
|
$53.25
|
+1.27
2.44% |
$53.51
|
442,734
54.00% of 50 DAV
50 DAV is 819,900
|
$54.00
-1.39%
|
11/26/2013
|
$53.02
|
PP = $52.42
|
|
MB = $55.04
|
 Most Recent Note - 12/16/2013 5:38:36 PM
Y - Rallied near its 52-week high today with a gain on light volume. It has been quietly consolidating above prior highs in the $52 area defining initial support to watch.
>>> FEATURED STOCK ARTICLE : Following Latest Breakout Prior Highs Define Support - 11/29/2013
View all notes |
Set NEW NOTE alert |
CANSLIM.net Company Profile |
SEC
News |
Chart |
Request a new note
C
A N
S L
I M
|
HLF
-
NYSE
Herbalife Ltd
DRUGS - Nutrition and Weight Management
|
$74.83
|
+6.45
9.43% |
$77.29
|
7,196,097
296.59% of 50 DAV
50 DAV is 2,426,300
|
$77.39
-3.31%
|
11/22/2013
|
$72.21
|
PP = $75.04
|
|
MB = $78.79
|
Most Recent Note - 12/16/2013 5:37:09 PM
Y - Found support above its 50 DMA line and rallied today with nearly 3 times average volume, challenging its 52-week high. No resistance remains due to overhead supply.
>>> FEATURED STOCK ARTICLE : Perched Near Highs Following Rebound - 11/22/2013
View all notes |
Set NEW NOTE alert |
CANSLIM.net Company Profile |
SEC
News |
Chart |
Request a new note
C
A N
S L
I M
|
JAZZ
-
NASDAQ
Jazz Pharmaceuticals Plc
DRUGS - Biotechnology
|
$112.19
|
-2.34
-2.04% |
$113.92
|
1,295,328
169.17% of 50 DAV
50 DAV is 765,700
|
$121.15
-7.40%
|
9/30/2013
|
$93.20
|
PP = $89.10
|
|
MB = $93.56
|
Most Recent Note - 12/16/2013 12:37:13 PM
G - Enduring distributional pressure and retreating from its 52-week high with higher volume behind today's loss. Recently noted as "extended from any sound base" with near-term support to watch at its 50 DMA line (now $100.85).
>>> FEATURED STOCK ARTICLE : Technically Extended Stock May Be a Dangerous Chase - 12/10/2013
View all notes |
Set NEW NOTE alert |
CANSLIM.net Company Profile |
SEC
News |
Chart |
Request a new note
C
A N
S L
I M
|
KORS
-
NYSE
Michael Kors Hldgs Ltd
RETAIL - Apparel Stores
|
$82.20
|
-0.07
-0.09% |
$83.04
|
2,551,751
55.54% of 50 DAV
50 DAV is 4,594,200
|
$83.91
-2.04%
|
8/6/2013
|
$69.66
|
PP = $66.28
|
|
MB = $69.59
|
Most Recent Note - 12/12/2013 5:51:31 PM
G - Rallied toward its 52-week high for a best-ever close with near average volume behind today's gain. Prior highs in the $78 area define near-term support coinciding with its 50 DMA line.
>>> FEATURED STOCK ARTICLE : Consolidation Too Brief To Note New Pivot - 12/6/2013
View all notes |
Set NEW NOTE alert |
CANSLIM.net Company Profile |
SEC
News |
Chart |
Request a new note
C
A N
S L
I M
|
PCLN
-
NASDAQ
Priceline.Com Inc
INTERNET - Internet Software and Services
|
$1,174.25
|
+2.98
0.25% |
$1,178.66
|
430,735
69.33% of 50 DAV
50 DAV is 621,300
|
$1,198.75
-2.04%
|
9/13/2013
|
$966.82
|
PP = $995.08
|
|
MB = $1,044.83
|
Most Recent Note - 12/11/2013 5:58:50 PM
G - Still hovering at its 52-week high. It may go on to produce more climactic gains but is currently extended from any sound base pattern. Reported earnings +40% on +33% sales revenues for the Sep '13 quarter versus the year-ago period, improving after a slightly sub par Jun '13 report.
>>> FEATURED STOCK ARTICLE : Extended From Any Sound Base Pattern - 12/3/2013
View all notes |
Set NEW NOTE alert |
CANSLIM.net Company Profile |
SEC
News |
Chart |
Request a new note
C
A N
S L
I M
|
Symbol/Exchange
Company Name
Industry Group |
PRICE |
CHANGE
(%Change) |
Day High |
Volume
(% DAV)
(% 50 day avg vol) |
52 Wk Hi
% From Hi |
Featured
Date |
Price
Featured |
Pivot Featured |
|
Max Buy |
SFUN
-
NYSE
Soufun Hldgs Ltd Ads A
INTERNET - Internet Information Providers
|
$72.47
|
-0.81
-1.11% |
$75.27
|
879,751
61.47% of 50 DAV
50 DAV is 1,431,300
|
$77.45
-6.43%
|
10/17/2013
|
$58.02
|
PP = $53.87
|
|
MB = $56.56
|
Most Recent Note - 12/11/2013 5:15:22 PM
G - Volume was light behind today's loss while still consolidating from its all-time high hit last week. It is extended from any sound base pattern yet may produce more climactic gains. Prior highs and its 50 DMA line coincide in the $59 area defining important support to watch.
>>> FEATURED STOCK ARTICLE : Extended From Base Yet May Produce More Climactic Gains - 12/9/2013
View all notes |
Set NEW NOTE alert |
CANSLIM.net Company Profile |
SEC
News |
Chart |
Request a new note
C
A N
S L
I M
|
SSNC
-
NASDAQ
S S & C Technologies
COMPUTER SOFTWARE and SERVICES - Application Software
|
$40.28
|
+0.89
2.26% |
$40.50
|
353,425
112.88% of 50 DAV
50 DAV is 313,100
|
$43.80
-8.04%
|
10/22/2013
|
$39.17
|
PP = $40.04
|
|
MB = $42.04
|
Most Recent Note - 12/16/2013 5:33:12 PM
G - Today's gain helped it rebound above its 50 DMA line helping its technical stance and outlook improve. See the latest FSU analysis for more details and new annotated daily and weekly graphs.
>>> FEATURED STOCK ARTICLE : Found Prompt Support After Damaging Losses Raised Concerns - 12/16/2013
View all notes |
Set NEW NOTE alert |
CANSLIM.net Company Profile |
SEC
News |
Chart |
Request a new note
C
A N
S L
I M
|
SSYS
-
NASDAQ
Stratasys Ltd
COMPUTER HARDWARE - Computer Peripherals
|
$117.92
|
-2.07
-1.73% |
$120.94
|
722,827
61.14% of 50 DAV
50 DAV is 1,182,200
|
$134.00
-12.00%
|
10/11/2013
|
$102.94
|
PP = $105.38
|
|
MB = $110.65
|
Most Recent Note - 12/16/2013 5:34:16 PM
G - Consolidating above support at its 50 DMA line with volume totals cooling in recent weeks. More damaging losses would raise greater concerns and trigger worrisome technical sell signals. Previously noted with caution - "Reported earnings +13% on +153% sales revenues, below the +25% minimum earnings guideline (C criteria) raising fundamental concerns."
>>> FEATURED STOCK ARTICLE : Rallying For New Highs Despite Fundamental Flaw Raising Concern - 11/18/2013
View all notes |
Set NEW NOTE alert |
CANSLIM.net Company Profile |
SEC
News |
Chart |
Request a new note
C
A N
S L
I M
|
ULTI
-
NASDAQ
Ultimate Software Group
INTERNET - Internet Software and Services
|
$148.00
|
+0.33
0.22% |
$149.43
|
177,902
124.84% of 50 DAV
50 DAV is 142,500
|
$162.88
-9.14%
|
10/16/2013
|
$142.95
|
PP = $151.18
|
|
MB = $158.74
|
Most Recent Note - 12/16/2013 12:51:03 PM
G - Still sputtering below its 50 DMA line, and the longer it lingers below that important short-term average, the worse its outlook gets. A prompt rebound above its 50 DMA line (now $151.41) is needed to help its technical stance.
>>> FEATURED STOCK ARTICLE : Consolidating Above 50 DMA Line and Prior Highs Defining Support - 11/21/2013
View all notes |
Set NEW NOTE alert |
CANSLIM.net Company Profile |
SEC
News |
Chart |
Request a new note
C
A N
S L
I M
|
VRX
-
NYSE
Valeant Pharmaceuticals
DRUGS - Drug Manufacturers - Other
|
$110.92
|
+4.09
3.83% |
$111.35
|
2,012,346
184.81% of 50 DAV
50 DAV is 1,088,900
|
$115.40
-3.88%
|
9/11/2013
|
$100.26
|
PP = $105.50
|
|
MB = $110.78
|
Most Recent Note - 12/16/2013 3:42:59 PM
G - Rallying above its 50 DMA line with above average volume behind today's considerable gain, helping its technical stance improve. Recent lows in the $102 area define near-term support where a violation may trigger a technical sell signal. It has been resilient after it reported earnings +24% on +74% sales revenues for the Sep '13 quarter, a notch below the +25% minimum guideline (C criteria).
>>> FEATURED STOCK ARTICLE : Recent Lows Define Support to Watch Below 50 Day Average - 11/15/2013
View all notes |
Set NEW NOTE alert |
CANSLIM.net Company Profile |
SEC
News |
Chart |
Request a new note
C
A N
S L
I M
|
Symbol/Exchange
Company Name
Industry Group |
PRICE |
CHANGE
(%Change) |
Day High |
Volume
(% DAV)
(% 50 day avg vol) |
52 Wk Hi
% From Hi |
Featured
Date |
Price
Featured |
Pivot Featured |
|
Max Buy |
YNDX
-
NASDAQ
Yandex N V Class A
INTERNET - Internet Information Providers
|
$38.33
|
+0.12
0.31% |
$38.97
|
2,099,696
76.01% of 50 DAV
50 DAV is 2,762,400
|
$42.00
-8.74%
|
11/27/2013
|
$39.61
|
PP = $42.10
|
|
MB = $44.21
|
Most Recent Note - 12/12/2013 1:09:11 PM
G - Rebounding near its 50 DMA line with a solid gain backed by above average volume today. On the prior session it violated its 50 DMA line triggering a technical sell signal and it was noted - "Only a prompt rebound above its 50 DMA line would help its outlook improve. Challenged its 52-week high recently but did not produce the required volume-driven gains above the pivot point to trigger a proper new technical buy signal."
>>> FEATURED STOCK ARTICLE : Forming New Base Pattern With Little Resistance Remaining - 11/27/2013
View all notes |
Set NEW NOTE alert |
CANSLIM.net Company Profile |
SEC
News |
Chart |
Request a new note
C
A N
S L
I M
|
|
|
|
THESE ARE NOT BUY RECOMMENDATIONS!
Comments contained in the body of this report are technical
opinions only. The material herein has been obtained
from sources believed to be reliable and accurate, however,
its accuracy and completeness cannot be guaranteed.
This site is not an investment advisor, hence it does
not endorse or recommend any securities or other investments.
Any recommendation contained in this report may not
be suitable for all investors and it is not to be deemed
an offer or solicitation on our part with respect to
the purchase or sale of any securities. All trademarks,
service marks and trade names appearing in this report
are the property of their respective owners, and are
likewise used for identification purposes only.
This report is a service available
only to active Paid Premium Members.
You may opt-out of receiving report notifications
at any time. Questions or comments may be submitted
by writing to Premium Membership Services 665 S.E. 10 Street, Suite 201 Deerfield Beach, FL 33441-5634 or by calling 1-800-965-8307
or 954-785-1121.
|
|
|

