You are not logged in.
This means you
CAN ONLY VIEW reports that were published prior to Monday, April 14, 2025.
You
MUST UPGRADE YOUR MEMBERSHIP if you want to see any current reports.
AFTER MARKET UPDATE - WEDNESDAY, DECEMBER 16TH, 2009
Previous After Market Report Next After Market Report >>>
|
|
|
|
DOW |
-10.88 |
10,441.12 |
-0.10% |
|
Volume |
1,164,448,140 |
-1% |
|
Volume |
2,067,817,730 |
+3% |
|
NASDAQ |
+5.86 |
2,206.91 |
+0.27% |
|
Advancers |
1,966 |
63% |
|
Advancers |
1,591 |
55% |
|
S&P 500 |
+1.25 |
1,109.18 |
+0.11% |
|
Decliners |
1,063 |
34% |
|
Decliners |
1,144 |
40% |
|
Russell 2000 |
+4.90 |
611.21 |
+0.81% |
|
52 Wk Highs |
285 |
|
|
52 Wk Highs |
143 |
|
|
S&P 600 |
+2.44 |
323.96 |
+0.76% |
|
52 Wk Lows |
3 |
|
|
52 Wk Lows |
19 |
|
|
 |
Mixed Session Included More High-Ranked Leaders Hitting New 52-Week Highs
Adam Sarhan, Contributing Writer,
The major averages ended mixed and very little changed on Wednesday's session as investors digested a slew of important data: the Fed concluded its last meeting of the year, housing starts topped estimates and consumer prices matched forecasts. Volume, an important indicator of institutional sponsorship, was reported lighter than Tuesday's totals on the NYSE, yet the volume on the Nasdaq exchange was reported higher, which signaled that large institutions were more aggressively buying stocks. Advancers led decliners by about a 2-to-1 ratio on the NYSE and by nearly a 4-to-3 ratio on the Nasdaq exchange. There were 53 high-ranked companies from the CANSLIM.net Leaders List that made a new 52-week high and appeared on the CANSLIM.net BreakOuts Page, better than the total of 42 issues that appeared on the prior session. New 52-week highs substantially outnumbered new 52-week lows on the NYSE and on the Nasdaq exchange.
At 8:30AM EST, two important economic reports were released: the consumer price index (CPI) and housing starts. The Labor Department said consumer prices rose by +0.4% in November after gaining +0.3% in October. The headline number matched estimates which helped allay inflation woes. The core rate, which excludes food and energy, was unchanged last month and was below the Street's estimate for an increase of +0.1%. Elsewhere, the Commerce Department said housing starts, which are registered when construction begins on a new residential building, were in line with estimates and rose +8.9% to an annual rate of 574,000 units. Meanwhile, building permits, a sign of future construction, jumped to the highest level in a year which was an encouraging sign. The pre-market news left investors optimistic about the future because the data signaled that the economy was recovering while inflation remained somewhat contained.
At 2:15PM EST, the FOMC concluded its two-day meeting and decided to leave interest rates steady near historical lows of 0-.25%. Time Magazine named Fed Chairman, Ben Bernanke as person of the year thanks to his ability to save the country's financial system from the worst recession since the WWII. Many economists believe that the US economy will grow over +4% in the fourth quarter of 2009 which will be the fastest pace in almost four years. However, stocks sold off after the Fed's announcement because many investors believe that keeping rates this low will cause rampant inflation down the road.
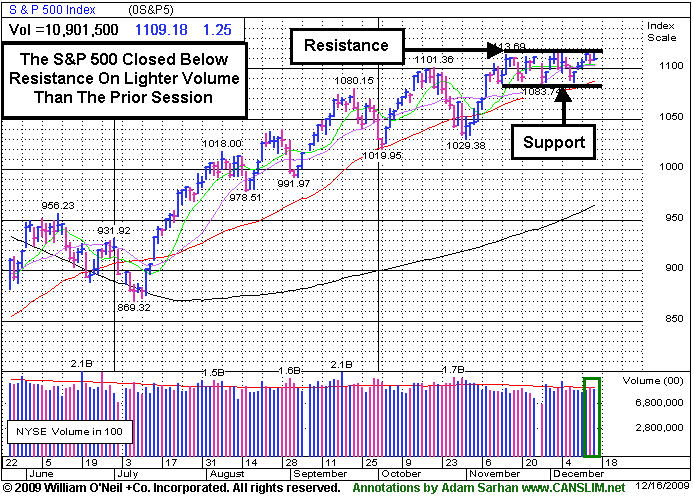
On Wednesday, the major averages closed just below important resistance levels as leading stocks were mixed. The Dow Jones Industrial Average and benchmark S&P 500 Index closed below 10,500 and 1,115, their respective resistance levels. The Nasdaq Composite Index closed just above 2,200 which has served as an important level of resistance for the tech-heavy index in recent months. At this point, the action remains healthy as long as the major averages remain above their respective 50-day moving average lines. So far, the market has held up rather nicely to the slew of economic data that was released this week, which is a bullish sign. As long as this action continues, the major averages deserve the bullish benefit of the doubt.
PICTURED: The S&P 500 Index is hovering near a recent resistance level.
|
|
|
 |
Broker/Dealer Index Halts Slide Near Prior Low Closes
Kenneth J. Gruneisen - Passed the CAN SLIM® Master's Exam
Weakness in the Biotechnology Index ($BTK -0.86%), Retail Index ($RLX -0.37%), and Bank Index ($BKX -0.42%) created a drag that largely offset gains elsewhere on Wednesday. Defensive areas fared well as the Healthcare Index ($HMO +1.95%) was among the session's standout gainers, meanwhile commodity-linked groups including the Gold & Silver Index ($XAU +1.34%), Oil Services Index ($OSX +1.41%), Integrated Oil Index ($XOI +0.74%) posted gains. The Semiconductor Index ($SOX +1.74%) led the tech sector while the Internet Index ($IIX +0.44%) and Networking Index ($NWX +0.77%) posed smaller gains.
Charts courtesy www.stockcharts.com
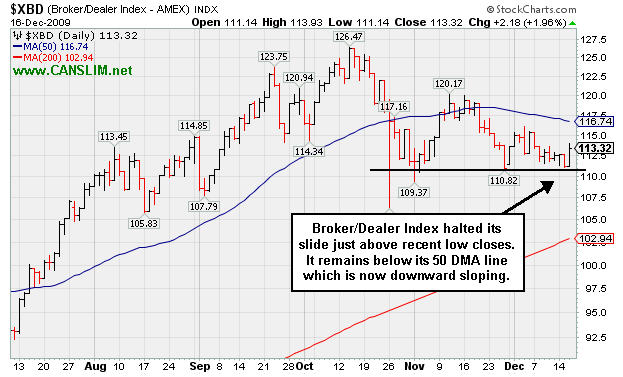
PICTURED: The Broker/Dealer Index ($XBD +1.96%) halted its slide just above recent low closes. It remains below its 50-day moving average (DMA) line which is now downward sloping.
| Oil Services |
$OSX |
193.62 |
+2.70 |
+1.41% |
+59.50% |
| Healthcare |
$HMO |
1,487.10 |
+28.44 |
+1.95% |
+54.88% |
| Integrated Oil |
$XOI |
1,058.88 |
+7.75 |
+0.74% |
+8.08% |
| Semiconductor |
$SOX |
344.86 |
+5.89 |
+1.74% |
+62.54% |
| Networking |
$NWX |
226.93 |
+1.73 |
+0.77% |
+57.71% |
| Internet |
$IIX |
229.18 |
+1.01 |
+0.44% |
+71.32% |
| Broker/Dealer |
$XBD |
113.32 |
+2.18 |
+1.96% |
+46.28% |
| Retail |
$RLX |
409.96 |
-1.51 |
-0.37% |
+46.80% |
| Gold & Silver |
$XAU |
173.45 |
+2.29 |
+1.34% |
+40.05% |
| Bank |
$BKX |
42.35 |
-0.18 |
-0.42% |
-4.44% |
| Biotech |
$BTK |
912.23 |
-7.89 |
-0.86% |
+40.96% |
|
|
|
 |
Rally Back Above 50-Day Average Helps Outlook
Kenneth J. Gruneisen - Passed the CAN SLIM® Master's Exam
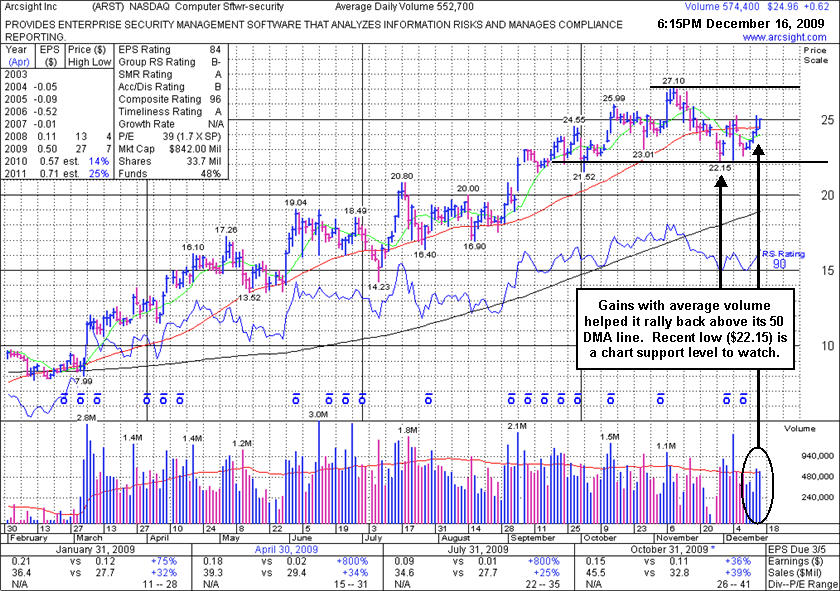
ArcSight, Inc. (ARST +$0.62 or -2.08% to $24.96) posted a 5th consecutive gain today on near average volume which helped it close above its 50-day moving average (DMA) line and helped it outlook. However, its current consolidation is not considered a new sound base. Patience may allow for it to form a new cup-with-handle or other bullish base pattern in due time. Meanwhile, deterioration below its recent chart lows ($22.15) would raise more serious concerns and trigger technical sell signals. Concerns were raised when it recently traded below its 50-day moving average (DMA) line. The 50 DMA line is always an important technical support level to watch on pullbacks. In this case, concerns were also raised when it undercut a prior chart low ($23.01), the next technical support.
It has shown resilience again this week after recently noted technical sell signals. However, keep in mind that ARST was considered a "late-stage" breakout possibility when featured after it had already made a considerable 5-fold rally from its November '08 low. ARST was first featured in yellow at $19.91 in the 9/01/09 mid-day report with an annotated daily graph (read here) and it was also featured with more detailed analysis in the September 2009 CANSLIM.net News with an annotated weekly graph (read here).
|
|
|
Color Codes Explained :
Y - Better candidates highlighted by our
staff of experts.
G - Previously featured
in past reports as yellow but may no longer be buyable under the
guidelines.
***Last / Change / Volume quote data in this table corresponds with the timestamp on the note***
Symbol/Exchange
Company Name
Industry Group |
Last |
Chg. |
Vol
% DAV |
Date Featured |
Price Featured |
Latest Pivot Point
Featured |
Status |
| Latest Max Buy Price |
ARST
-
|
$24.96
|
+0.62
|
586,222
106% DAV
552,700
|
9/1/2009
(Date
Featured) |
$19.91
(Price
Featured) |
PP = $20.90 |
G |
| MB = $21.95 |
Most Recent Note - 12/16/2009 5:00:31 PM
G - A 5th consecutive gain today on near average volume helped it close above its 50 DMA line, which helps it outlook. Deterioration below its recent chart lows ($22.15) would raise more serious concerns. ARST was first featured in yellow at $19.91 in the 9/01/09 mid-day report with an annotated daily graph (read here).
>>> The latest Featured Stock Update with an annotated graph appeared on 12/16/2009. click here.
|
|
C
A
S
I |
News |
Chart |
SEC
View all notes Alert
me of new notes
Company
Profile
|
ASIA
-
|
$30.95
|
-0.04
|
824,744
60% DAV
1,364,200
|
10/14/2009
(Date
Featured) |
$23.05
(Price
Featured) |
PP = $22.19 |
G |
| MB = $23.30 |
Most Recent Note - 12/16/2009 5:02:30 PM
G - Holding its ground today near its 52-week high. It is extended from any sound base after its considerable gap up gain on 12/07/09 with almost 8 times average volume. Featured 10/14/09 in the mid-day report (read here) as it gapped up for a new 52-week high with 5 times average volume, triggering a technical buy signal by blasting above its pivot point. First featured in the August 2009 CANSLIM.net News (read here).
>>> The latest Featured Stock Update with an annotated graph appeared on 12/7/2009. click here.
|
|
C
A
S
I |
News |
Chart |
SEC
View all notes Alert
me of new notes
Company
Profile
|
BIDU
- NASDAQ
Baidu Inc Ads
INTERNET - Internet Information Providers
|
$426.26
|
+2.26
|
767,633
38% DAV
2,042,600
|
9/8/2009
(Date
Featured) |
$351.80
(Price
Featured) |
PP = $440.00 |
Y |
| MB = $462.00 |
Most Recent Note - 12/16/2009 5:03:18 PM
Y - Volume has been continuing to dry up while consolidating in a tight trading range near all-time highs and just above its 50 DMA line. Color code was changed to yellow with new pivot point cited. Technically, it has built a sloppy base over almost 8 weeks. Since quietly rallying to new highs in November it has stalled. BIDU traded up as much as +23% from its price when featured in yellow in the 9/08/09 Mid-Day BreakOuts Report (read here).
>>> The latest Featured Stock Update with an annotated graph appeared on 12/9/2009. click here.
|
|
C
A
S
I |
News |
Chart |
SEC
View all notes Alert
me of new notes
Company
Profile
|
CAAS
- NASDAQ
China Automotive Systems
AUTOMOTIVE - Auto Parts
|
$20.31
|
+0.26
|
419,375
69% DAV
608,100
|
11/30/2009
(Date
Featured) |
$18.84
(Price
Featured) |
PP = $17.62 |
G |
| MB = $18.50 |
Most Recent Note - 12/16/2009 5:05:57 PM
G - Held its ground today after another worrisome negative reversal on 12/15/09 indicative of distributional pressure. It has been hovering near all-time highs, yet it is still extended from a sound base under the investment system rules. The Chinese maker of power steering systems was rising from an advanced "3-weeks tight" type of chart pattern as it showed up in yellow in the 11/30/09 mid-day report (read here). Recent quarters show accelerating sales revenues and earnings increases, and it has a good annual earnings history.
>>> The latest Featured Stock Update with an annotated graph appeared on 12/11/2009. click here.
|
|
C
A
S
I |
News |
Chart |
SEC
View all notes Alert
me of new notes
Company
Profile
|
CACC
- NASDAQ
Credit Acceptance Corp
FINANCIAL SERVICES - Credit Services
|
$39.05
|
+3.05
|
184,655
561% DAV
32,900
|
9/29/2009
(Date
Featured) |
$33.48
(Price
Featured) |
PP = $37.10 |
G |
| MB = $38.96 |
Most Recent Note - 12/16/2009 5:08:35 PM
G - Gapped up today and rallied above its pivot point and its max buy level quickly with almost 6 times average volume. Rallied with ever-increasing and above average volume behind 4 consecutive gains. Color code was changed to green as it got too extended from a sound base. An article in the paper on 12/14 discussed its thin trading and that it can lead to great volatility (read here). Recent chart lows in the $33 area are an important support level to watch now. The Finance - Consumer/Commercial Loans firm has maintained a great track record of annual and quarterly sales revenues and earnings increases. It was featured on 9/29/09 in yellow in the mid-day report (read here
>>> The latest Featured Stock Update with an annotated graph appeared on 12/10/2009. click here.
|
|
C
A
S
I |
News |
Chart |
SEC
View all notes Alert
me of new notes
Company
Profile
|
CRM
- NYSE
Salesforce.com Inc
INTERNET - Internet Software & Services
|
$65.78
|
+0.71
|
1,458,698
91% DAV
1,606,100
|
8/16/2009
(Date
Featured) |
$47.12
(Price
Featured) |
PP = $45.59 |
G |
| MB = $47.87 |
Most Recent Note - 12/16/2009 5:10:19 PM
G - Small gain today on near average volume. It has been consolidating for nearly 5 weeks above important support at that short-term average line, yet hovering within close striking distance of its 52 week high. Last week it tested support at its 50 DMA line.
>>> The latest Featured Stock Update with an annotated graph appeared on 12/8/2009. click here.
|
|
C
A
S
I |
News |
Chart |
SEC
View all notes Alert
me of new notes
Company
Profile
|
CTRP
- NASDAQ
Ctrip.com Intl Ltd Adr
LEISURE - Resorts & Casinos
|
$77.37
|
+3.28
|
772,039
71% DAV
1,086,500
|
12/1/2009
(Date
Featured) |
$75.38
(Price
Featured) |
PP = $73.91 |
Y |
| MB = $77.61 |
Most Recent Note - 12/16/2009 5:12:49 PM
Y - Gain today with light volume helped it rally for a new high close while approaching its "max buy" price of $77.60. Featured on 12/01/09 in yellow in the mid-day report (read here). It triggered a technical buy signal as it rose with more than +50% above average volume from a brief consolidation resembling a "high-tight-flag" pattern which it formed after repairing a late-October breach of its 50 DMA line. Fundamentally, its sales revenues and earnings increases have shown acceleration in the 3 most recent quarterly comparisons and rose above the +25% guideline. Based on weak technical action it was dropped from the Featured Stocks list on 6/10/08, when it closed at $49.84, yet it has rebounded very impressively from subsequent lows in the $16 area.
>>> The latest Featured Stock Update with an annotated graph appeared on 12/14/2009. click here.
|
|
C
A
S
I |
News |
Chart |
SEC
View all notes Alert
me of new notes
Company
Profile
|
HEAT
-
|
$16.33
|
-0.26
|
909,139
103% DAV
883,200
|
11/17/2009
(Date
Featured) |
$12.00
(Price
Featured) |
PP = $12.61 |
G |
| MB = $13.24 |
Most Recent Note - 12/16/2009 5:14:18 PM
G - Halted a 3-day winning streak with today's small loss on lighter (near average) volume. Perched near its 52-week high, extended from its prior base after 3 weekly gains on above average volume in the past 4 weeks. The investment system rules say a stock should be held a minimum of 8 weeks after rising more than +20% in the first 2-3 weeks from being bought. First featured in yellow in the 11/17/09 mid-day report (read here) when technically rising from a "double bottom" base, reaching a new all-time high.
>>> The latest Featured Stock Update with an annotated graph appeared on 12/15/2009. click here.
|
|
C
A
S
I |
News |
Chart |
SEC
View all notes Alert
me of new notes
Company
Profile
|
LFT
-
|
$38.40
|
+1.88
|
662,802
150% DAV
442,600
|
11/17/2009
(Date
Featured) |
$31.77
(Price
Featured) |
PP = $33.04 |
G |
| MB = $34.69 |
Most Recent Note - 12/16/2009 5:15:40 PM
G - Considerable gain today with above average volume for a new all-time high, getting extended after recently rising from a choppy 14-week base. Prior chart highs in the $31 area are an initial support level to watch. A proposed offering of additional shares on 11/16/09 seems well received by the market. Its fundamentals remain strong.
>>> The latest Featured Stock Update with an annotated graph appeared on 12/4/2009. click here.
|
|
C
A
S
I |
News |
Chart |
SEC
View all notes Alert
me of new notes
Company
Profile
|
|
|
|
THESE ARE NOT BUY RECOMMENDATIONS!
Comments contained in the body of this report are technical
opinions only. The material herein has been obtained
from sources believed to be reliable and accurate, however,
its accuracy and completeness cannot be guaranteed.
This site is not an investment advisor, hence it does
not endorse or recommend any securities or other investments.
Any recommendation contained in this report may not
be suitable for all investors and it is not to be deemed
an offer or solicitation on our part with respect to
the purchase or sale of any securities. All trademarks,
service marks and trade names appearing in this report
are the property of their respective owners, and are
likewise used for identification purposes only.
This report is a service available
only to active Paid Premium Members.
You may opt-out of receiving report notifications
at any time. Questions or comments may be submitted
by writing to Premium Membership Services 665 S.E. 10 Street, Suite 201 Deerfield Beach, FL 33441-5634 or by calling 1-800-965-8307
or 954-785-1121.
|
|
|


