You are not logged in.
This means you
CAN ONLY VIEW reports that were published prior to Monday, April 14, 2025.
You
MUST UPGRADE YOUR MEMBERSHIP if you want to see any current reports.
AFTER MARKET UPDATE - TUESDAY, DECEMBER 15TH, 2009
Previous After Market Report Next After Market Report >>>
|
|
|
|
DOW |
-49.05 |
10,452.00 |
-0.47% |
|
Volume |
1,177,574,380 |
+10% |
|
Volume |
2,003,349,090 |
+7% |
|
NASDAQ |
-11.05 |
2,201.05 |
-0.50% |
|
Advancers |
1,213 |
39% |
|
Advancers |
1,043 |
36% |
|
S&P 500 |
-6.18 |
1,107.93 |
-0.55% |
|
Decliners |
1,812 |
58% |
|
Decliners |
1,705 |
59% |
|
Russell 2000 |
-3.48 |
606.31 |
-0.57% |
|
52 Wk Highs |
220 |
|
|
52 Wk Highs |
130 |
|
|
S&P 600 |
-1.18 |
321.52 |
-0.37% |
|
52 Wk Lows |
3 |
|
|
52 Wk Lows |
18 |
|
|
 |
Distributional Action As Indices Challenge Recent Resistance
Adam Sarhan, Contributing Writer,
The major averages closed lower as investors digested the latest round of disconcerting economic data. Volume, an important indicator of institutional sponsorship, was reported higher than Monday's totals on the NYSE and on the Nasdaq exchange which marked another distribution day for the major averages. Decliners led advancers by about a 3-to-2 ratio on the NYSE and on the Nasdaq exchange. There were 42 high-ranked companies from the CANSLIM.net Leaders List that made a new 52-week high and appeared on the CANSLIM.net BreakOuts Page, lower than the total of 51 issues that appeared on the prior session. New 52-week highs substantially outnumbered new 52-week lows on the NYSE and on the Nasdaq exchange.
Before Tuesday's opening bell, two tepid economic reports were released which suggested stagflation may be on the horizon (higher inflation coupled with low economic activity). The producer price index (PPI) surged while the Empire State manufacturing index plunged. Surging energy prices played a primary role in sending the headline PPI number higher in November but investors were concerned when core prices (which exclude food and energy) also rose. The headline number jumped +1.8% after increasing by +0.3% in October. Not only was the reading sharply higher than October's reading but it also smashed the Street's estimate for a +1% increase and was the first year on year increase in several quarters. Elsewhere, manufacturing in the New York region fell short of analysts' estimates and barely came in above zero for December. In addition, the 2.55 reading was way below November's reading of 23.51 and October's total of 34.57, suggesting lackluster growth.
At 1:00pm EST, the National Association of Home Builders released their housing market index. The index, which rates the overall economy and housing market conditions, fell 1 point in December to 16 which is a very low reading. Respondents are still concerned that credit conditions remain very tight which hinders the buyer's ability to make new purchases. All this data sent the US dollar higher which put additional pressure on US stocks.
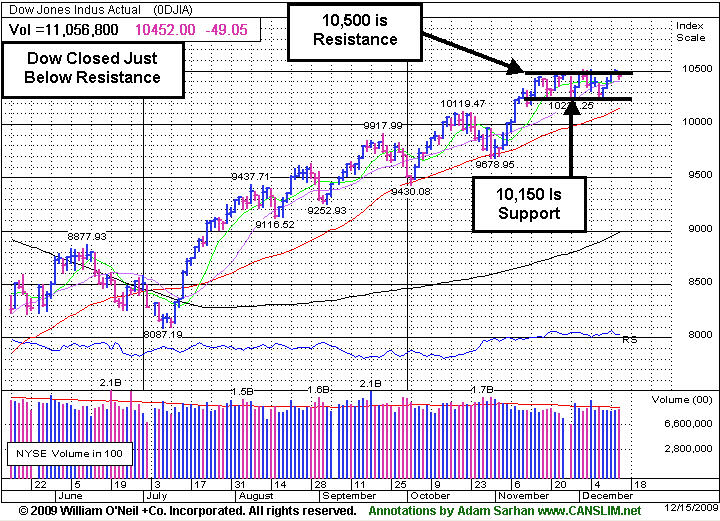
On Tuesday, each of the major averages pulled back from logical resistance levels. The Dow Jones Industrial Average and benchmark S&P 500 index closed just below 10,500 and 1,115, their respective levels of resistance. The Nasdaq Composite Index closed just above 2,200 which has served as an important level of resistance for the tech-heavy index. At this point, the action remains healthy as long as the major averages remain above their respective 50-day moving average lines. A slew of economic data is slated to be released this week and, as always, it will be very important to see how the market reacts to that news. On Wednesday, the Federal Reserve will conclude its 2-day meeting on interest rates. In addition, the consumer price index (CPI) and the latest housing starts are slated to be released.
PICTURED: The Dow Jones Industrial Average closed just below resistance (10,500) today.
|
|
|
 |
Financial Groups' Sputtering Remains A Concern
Kenneth J. Gruneisen - Passed the CAN SLIM® Master's Exam
The influential financial indices continued struggling on Tuesday. There was a negative bias for the Bank Index ($BKX -2.90%) and Broker/Dealer Index ($XBD -1.29%), and the Retail Index ($RLX -1.18%) also added pressure on the major averages. The loss for the Gold & Silver Index ($XAU -1.85%) erased more than the prior session's gain while sending it further below its 50-day moving average (DMA) line. Tech shares also had a negative bias as the Networking Index ($NWX -0.94%), Biotechnology Index ($BTK -0.44%), Internet Index ($IIX -0.39%), and Semiconductor Index ($SOX -0.38%) ended unanimously lower. The Integrated Oil Index ($XOI -0.17%) closed with a slight loss, meanwhile the Healthcare Index ($HMO +0.77%) and Oil Services Index ($OSX +1.38%) were standout gainers.
Charts courtesy www.stockcharts.com

PICTURED: The Bank Index ($BKX -2.90%) has struggled below its 50-day moving average (DMA) line since turning downward in October, and its recent chart lows are now a support level to watch above its 200 DMA line.
|
|
|
 |
Strength Continues As Buying Demand Remains Warm
Kenneth J. Gruneisen - Passed the CAN SLIM® Master's Exam
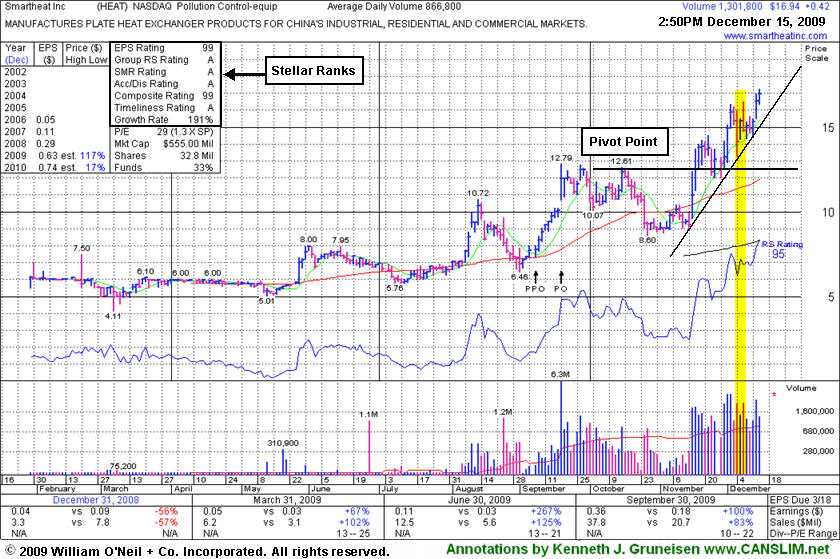
Smartheat Inc (HEAT +$0.07 or +0.42% to $16.59) has risen well beyond its "may buy" level after enduring some distributional pressure last week including negative reversals on 12/04/09 and 12/08/09. A steep upward trendline connecting recent chart lows helps define an initial support level to watch. It rose more than 20% in the first 2-3 weeks, so an investment system rule designed to help investors capture exceptional gains from the market's biggest winners now suggests to hold for a minimum of 8 weeks.
The number of top-rated funds owning an interest in its shares rose from 3 in Jun '09 to 26 in Sept '09, which is reassuring concerning the I criteria. The 3 latest quarters show sales revenues and earnings increases well above the +25% guideline, satisfying the C criteria. There is limited history for this small Chinese firm in the Pollution Control - Equipment group, however its reported annual earnings (A criteria) history has been strong. HEAT was first featured at $12.00 in yellow in the 11/17/09 mid-day report (read here) when technically rising from a "double bottom" base, reaching a new all-time high.
|
|
|
Color Codes Explained :
Y - Better candidates highlighted by our
staff of experts.
G - Previously featured
in past reports as yellow but may no longer be buyable under the
guidelines.
***Last / Change / Volume quote data in this table corresponds with the timestamp on the note***
Symbol/Exchange
Company Name
Industry Group |
Last |
Chg. |
Vol
% DAV |
Date Featured |
Price Featured |
Latest Pivot Point
Featured |
Status |
| Latest Max Buy Price |
ARST
-
|
$24.34
|
+0.23
|
621,477
113% DAV
548,000
|
9/1/2009
(Date
Featured) |
$19.91
(Price
Featured) |
PP = $20.90 |
G |
| MB = $21.95 |
Most Recent Note - 12/15/2009 4:44:29 PM
G - After trading above its 50 DMA line intra-day it reversed and closed below that important short-term average near the session low. Deterioration below its recent chart lows ($22.15) would raise more serious concerns. Its outlook is increasingly questionable the longer it continues to struggle below its 50 DMA line. ARST was first featured in yellow at $19.91 in the 9/01/09 mid-day report with an annotated daily graph (read here).
>>> The latest Featured Stock Update with an annotated graph appeared on 12/3/2009. click here.
|
|
C
A
S
I |
News |
Chart |
SEC
View all notes Alert
me of new notes
Company
Profile
|
ASIA
-
|
$30.99
|
-1.17
|
1,176,921
87% DAV
1,347,400
|
10/14/2009
(Date
Featured) |
$23.05
(Price
Featured) |
PP = $22.19 |
G |
| MB = $23.30 |
Most Recent Note - 12/15/2009 4:48:22 PM
G - Gapped down today from the 52-week high it reached on the prior session. It is extended from any sound base after its considerable gap up gain on 12/07/09 with almost 8 times average volume. Featured 10/14/09 in the mid-day report (read here) as it gapped up for a new 52-week high with 5 times average volume, triggering a technical buy signal by blasting above its pivot point. First featured in the August 2009 CANSLIM.net News (read here).
>>> The latest Featured Stock Update with an annotated graph appeared on 12/7/2009. click here.
|
|
C
A
S
I |
News |
Chart |
SEC
View all notes Alert
me of new notes
Company
Profile
|
BIDU
- NASDAQ
Baidu Inc Ads
INTERNET - Internet Information Providers
|
$424.00
|
-0.51
|
1,057,009
52% DAV
2,043,100
|
9/8/2009
(Date
Featured) |
$351.80
(Price
Featured) |
PP = $440.00 |
Y |
| MB = $462.00 |
Most Recent Note - 12/15/2009 4:50:25 PM
Y - Volume has been drying up while consolidating in a tight trading range near all-time highs and just above its 50 DMA line. Color code was changed to yellow with new pivot point cited. Technically, it has built a sloppy base over almost 8 weeks. Since quietly rallying to new highs in November it has stalled. BIDU traded up as much as +23% from its price when featured in yellow in the 9/08/09 Mid-Day BreakOuts Report (read here).
>>> The latest Featured Stock Update with an annotated graph appeared on 12/9/2009. click here.
|
|
C
A
S
I |
News |
Chart |
SEC
View all notes Alert
me of new notes
Company
Profile
|
CAAS
- NASDAQ
China Automotive Systems
AUTOMOTIVE - Auto Parts
|
$20.05
|
-0.86
|
1,164,809
199% DAV
586,100
|
11/30/2009
(Date
Featured) |
$18.84
(Price
Featured) |
PP = $17.62 |
G |
| MB = $18.50 |
Most Recent Note - 12/15/2009 4:51:37 PM
G - Negatively reversed today, closing near the session low while trading down on heavier volume that is indicative of distributional pressure. It has been hovering near all-time highs, yet it is still extended from a sound base under the investment system rules. The Chinese maker of power steering systems was rising from an advanced "3-weeks tight" type of chart pattern as it showed up in yellow in the 11/30/09 mid-day report (read here). Recent quarters show accelerating sales revenues and earnings increases, and it has a good annual earnings history.
>>> The latest Featured Stock Update with an annotated graph appeared on 12/11/2009. click here.
|
|
C
A
S
I |
News |
Chart |
SEC
View all notes Alert
me of new notes
Company
Profile
|
CACC
- NASDAQ
Credit Acceptance Corp
FINANCIAL SERVICES - Credit Services
|
$36.00
|
+0.77
|
83,926
257% DAV
32,700
|
9/29/2009
(Date
Featured) |
$33.48
(Price
Featured) |
PP = $37.10 |
Y |
| MB = $38.96 |
Most Recent Note - 12/15/2009 4:53:38 PM
Y - Solid gain today with more than 2 times average volume has it approaching its pivot point. Near its 50 DMA line it was resilient while building on an 8-week flat base. Recent chart lows in the $33 area are an important support level to watch now. The Finance - Consumer/Commercial Loans firm has maintained a great track record of annual and quarterly sales revenues and earnings increases. It was featured on 9/29/09 in yellow in the mid-day report (read here
>>> The latest Featured Stock Update with an annotated graph appeared on 12/10/2009. click here.
|
|
C
A
S
I |
News |
Chart |
SEC
View all notes Alert
me of new notes
Company
Profile
|
CRM
- NYSE
Salesforce.com Inc
INTERNET - Internet Software & Services
|
$65.07
|
+0.15
|
877,086
54% DAV
1,618,600
|
8/16/2009
(Date
Featured) |
$47.12
(Price
Featured) |
PP = $45.59 |
G |
| MB = $47.87 |
Most Recent Note - 12/15/2009 4:54:28 PM
G - Small gain today on lighter volume. Last week it tested support at its 50 DMA line. It has been consolidating for the past 4 weeks above important support at that short-term average line, yet hovering within close striking distance of its 52 week high.
>>> The latest Featured Stock Update with an annotated graph appeared on 12/8/2009. click here.
|
|
C
A
S
I |
News |
Chart |
SEC
View all notes Alert
me of new notes
Company
Profile
|
CTRP
- NASDAQ
Ctrip.com Intl Ltd Adr
LEISURE - Resorts & Casinos
|
$74.09
|
-0.53
|
390,793
36% DAV
1,088,100
|
12/1/2009
(Date
Featured) |
$75.38
(Price
Featured) |
PP = $73.91 |
Y |
| MB = $77.61 |
Most Recent Note - 12/15/2009 4:55:11 PM
Y - Quietly perched near its pivot point now, it encountered some distributional pressure when recently rallying above its "max buy" price of $77.60. Featured on 12/01/09 in yellow in the mid-day report (read here). It triggered a technical buy signal as it rose with more than +50% above average volume from a brief consolidation resembling a "high-tight-flag" pattern which it formed after repairing a late-October breach of its 50 DMA line. Fundamentally, its sales revenues and earnings increases have shown acceleration in the 3 most recent quarterly comparisons and rose above the +25% guideline. Based on weak technical action it was dropped from the Featured Stocks list on 6/10/08, when it closed at $49.84, yet it has rebounded very impressively from subsequent lows in the $16 area.
>>> The latest Featured Stock Update with an annotated graph appeared on 12/14/2009. click here.
|
|
C
A
S
I |
News |
Chart |
SEC
View all notes Alert
me of new notes
Company
Profile
|
HEAT
-
|
$16.59
|
+0.07
|
1,626,668
188% DAV
866,800
|
11/17/2009
(Date
Featured) |
$12.00
(Price
Featured) |
PP = $12.61 |
G |
| MB = $13.24 |
Most Recent Note - 12/15/2009 4:55:56 PM
G - Hit another a new 52-week high today. Extended from its prior base after 3 weekly gains on above average volume in the past 4 weeks. The investment system rules say a stock should be held a minimum of 8 weeks after rising more than +20% in the first 2-3 weeks from being bought. First featured in yellow in the 11/17/09 mid-day report (read here) when technically rising from a "double bottom" base, reaching a new all-time high.
>>> The latest Featured Stock Update with an annotated graph appeared on 12/15/2009. click here.
|
|
C
A
S
I |
News |
Chart |
SEC
View all notes Alert
me of new notes
Company
Profile
|
LFT
-
|
$36.52
|
+0.48
|
366,829
83% DAV
440,900
|
11/17/2009
(Date
Featured) |
$31.77
(Price
Featured) |
PP = $33.04 |
G |
| MB = $34.69 |
Most Recent Note - 12/15/2009 4:56:34 PM
G - Gain today on below average volume leaves it perched near all-time highs, extended after recently rising from a choppy 14-week base. Prior chart highs in the $31 area are an initial support level to watch. A proposed offering of additional shares on 11/16/09 seems well received by the market. Its fundamentals remain strong.
>>> The latest Featured Stock Update with an annotated graph appeared on 12/4/2009. click here.
|
|
C
A
S
I |
News |
Chart |
SEC
View all notes Alert
me of new notes
Company
Profile
|
|
|
|
THESE ARE NOT BUY RECOMMENDATIONS!
Comments contained in the body of this report are technical
opinions only. The material herein has been obtained
from sources believed to be reliable and accurate, however,
its accuracy and completeness cannot be guaranteed.
This site is not an investment advisor, hence it does
not endorse or recommend any securities or other investments.
Any recommendation contained in this report may not
be suitable for all investors and it is not to be deemed
an offer or solicitation on our part with respect to
the purchase or sale of any securities. All trademarks,
service marks and trade names appearing in this report
are the property of their respective owners, and are
likewise used for identification purposes only.
This report is a service available
only to active Paid Premium Members.
You may opt-out of receiving report notifications
at any time. Questions or comments may be submitted
by writing to Premium Membership Services 665 S.E. 10 Street, Suite 201 Deerfield Beach, FL 33441-5634 or by calling 1-800-965-8307
or 954-785-1121.
|
|
|


