You are not logged in.
This means you
CAN ONLY VIEW reports that were published prior to Saturday, March 22, 2025.
You
MUST UPGRADE YOUR MEMBERSHIP if you want to see any current reports.
AFTER MARKET UPDATE - FRIDAY, DECEMBER 14TH, 2012
Previous After Market Report Next After Market Report >>>
|
|
|
|
DOW |
-35.71 |
13,135.01 |
-0.27% |
|
Volume |
674,321,860 |
+2% |
|
Volume |
1,739,835,810 |
-2% |
|
NASDAQ |
-20.83 |
2,971.33 |
-0.70% |
|
Advancers |
1,380 |
44% |
|
Advancers |
1,195 |
47% |
|
S&P 500 |
-5.87 |
1,413.58 |
-0.41% |
|
Decliners |
1,603 |
51% |
|
Decliners |
1,244 |
48% |
|
Russell 2000 |
-0.53 |
823.51 |
-0.06% |
|
52 Wk Highs |
55 |
|
|
52 Wk Highs |
33 |
|
|
S&P 600 |
-0.96 |
461.40 |
-0.21% |
|
52 Wk Lows |
25 |
|
|
52 Wk Lows |
39 |
|
|
 |
Major Averages Encounter Late-Week Pressure
Kenneth J. Gruneisen - Passed the CAN SLIM® Master's Exam
On the week, the Dow Jones Industrial Average was down -0.1%, the S&P 500 Index fell -0.3%, and the Nasdaq Composite Index lost -0.2%. The major averages lost ground on Friday while the volume totals were reported mixed, slightly higher than the prior session on the NYSE but lower on the Nasdaq exchange. Breadth was slightly negative as decliners led advancers by an 8-7 margin on the NYSE and by a narrower margin on the Nasdaq exchange. The total number of stocks hitting new 52-week highs still outnumbered new 52-week lows on the NYSE but new lows outnumbered new highs on the Nasdaq exchange. There were 18 high-ranked companies from the CANSLIM.net Leaders List making new 52-week highs and appearing on the CANSLIM.net BreakOuts Page, up a couple of notches from the prior session total of 16 stocks. Any sustainable rally requires a healthy crop of companies hitting new 52-week highs, so it remains important to see meaningful leadership. There were losses for 9 of the 13 high-ranked companies currently included on the Featured Stocks Page, again a disconcertingly negative bias versus the broader market.
Concerns over the looming fiscal cliff are holding markets back. President Obama and House Speaker Boehner continued negotiations last night but the two parties remain divided on taxes and spending. The political impasse is overshadowing positive economic data. Industrial production increased by the most in two years as output rose +1.1% in November. In addition, the consumer price index fell for the first time since May as the gauge fell -0.3% in November. Meanwhile in Asia, China's manufacturing expanded at a faster pace this month.
On the earnings front, Adobe Systems Inc (ADBE +5.71%) rallied after posting sales and profit above expectations. Overall, most sectors are losing ground. Technology is pacing the decline as Apple Inc (AAPL -3.76%) sank near a 10-month low. Energy stocks are also weighing on markets led by Schlumberger Ltd's (SLB -5.03%) decline. However, a rally in material shares is helping limit losses as PPG Industries Inc (PPG +3.77%) advanced.
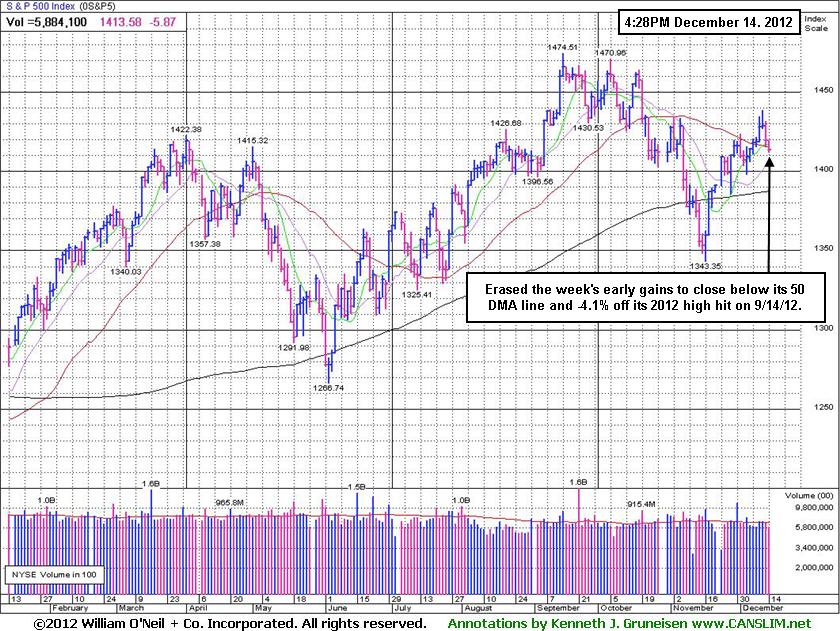
Technically, the market direction (M criteria) remains in a confirmed uptrend, however that uptrend has come under recent pressure. The damage brought on by 2 conscutive losses led the Nasdaq Composite Index to end the week slumping back under its 50-day moving average (DMA) line and also undercutting its 200 DMA line. The benchmark S&P 500 Index undercut its 50 DMA line as well. The Dow Jones Industrial Average stayed above its 50 DMA line. New buying efforts may be justified only in worthy high-ranked leaders. See the noteworthy companies included on the Featured Stocks Page.
Watch for an announcement via email concerning the next WEBCAST. The webcast will also be available via an updated link highlighted at the top of the Premium Member Homepage.
PICTURED: The S&P 500 Index slumped to a close below its 50 DMA line, finishing -4.1% off its 2012 high.
|
 Kenneth J. Gruneisen started out as a licensed stockbroker in August 1987, a couple of months prior to the historic stock market crash that took the Dow Jones Industrial Average down -22.6% in a single day. He has published daily fact-based fundamental and technical analysis on high-ranked stocks online for two decades. Through FACTBASEDINVESTING.COM, Kenneth provides educational articles, news, market commentary, and other information regarding proven investment systems that work in good times and bad.
Comments contained in the body of this report are technical opinions only and are not necessarily those of Gruneisen Growth Corp. The material herein has been obtained from sources believed to be reliable and accurate, however, its accuracy and completeness cannot be guaranteed. Our firm, employees, and customers may effect transactions, including transactions contrary to any recommendation herein, or have positions in the securities mentioned herein or options with respect thereto. Any recommendation contained in this report may not be suitable for all investors and it is not to be deemed an offer or solicitation on our part with respect to the purchase or sale of any securities. |
|
 |
Networking index Led Tech Sector; Healthcare Group Pulls Back
Kenneth J. Gruneisen - Passed the CAN SLIM® Master's Exam
The Networking Index ($NWX +1.45%) was a standout gainer on Friday while the Semiconductor Index ($SOX -0.69%) and the Biotechnology Index ($BTK -0.62%) created a drag on the tech sector while the Internet Index ($IIX -0.10%) did a better job of holding its ground. The Oil Services Index ($OSX -1.16%) faced pressure while the Integrated Oil Index ($XOI +0.38%) and the Gold & Silver Index ($XAU +0.66%) posted small gains. The Retail Index ($RLX -0.60%) added a negative influence on the major averages while the Broker/Dealer Index ($XBD +0.05%) finished flat while the Bank Index ($BKX -0.32%) edged lower.
Charts courtesy www.stockcharts.com
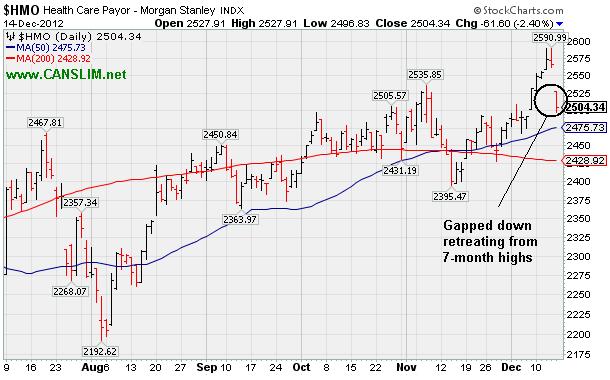
PICTURED: The Healthcare Index ($HMO -2.40%) gapped down, retreating from 7-month highs.
| Oil Services |
$OSX |
214.40 |
-2.51 |
-1.16% |
-0.87% |
| Healthcare |
$HMO |
2,504.34 |
-61.60 |
-2.40% |
+9.76% |
| Integrated Oil |
$XOI |
1,237.44 |
+4.68 |
+0.38% |
+0.68% |
| Semiconductor |
$SOX |
381.03 |
-2.64 |
-0.69% |
+4.55% |
| Networking |
$NWX |
220.11 |
+3.15 |
+1.45% |
+2.30% |
| Internet |
$IIX |
325.19 |
-0.33 |
-0.10% |
+15.42% |
| Broker/Dealer |
$XBD |
88.21 |
+0.05 |
+0.05% |
+5.94% |
| Retail |
$RLX |
651.45 |
-3.90 |
-0.60% |
+24.51% |
| Gold & Silver |
$XAU |
164.75 |
+1.08 |
+0.66% |
-8.80% |
| Bank |
$BKX |
49.26 |
-0.16 |
-0.32% |
+25.09% |
| Biotech |
$BTK |
1,534.61 |
-9.50 |
-0.62% |
+40.61% |
|
|
|
 |
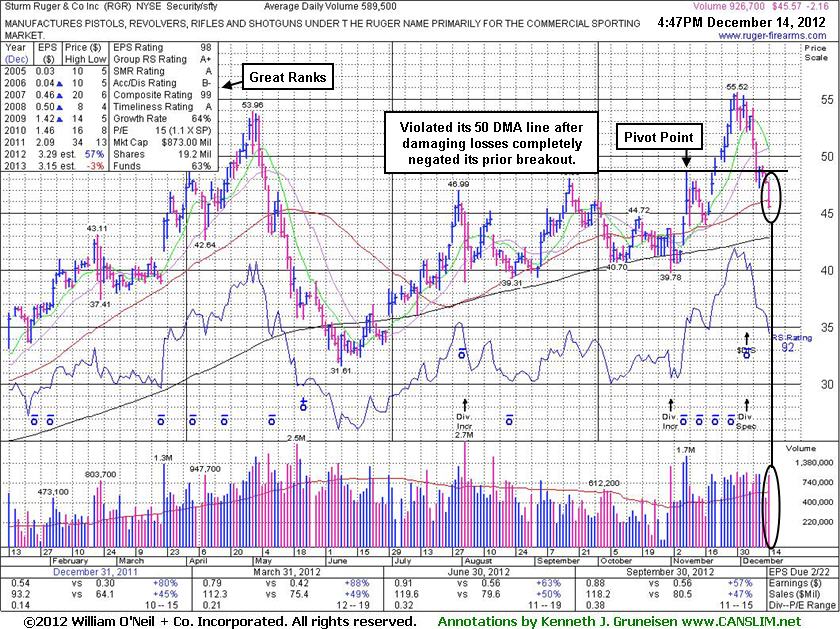
Violated 50-Day Average After Damaging Losses Negated Prior Breakout
Kenneth J. Gruneisen - Passed the CAN SLIM® Master's Exam
Sturm Ruger & Co Inc (RGR -$2.16 or -4.53% to $45.57) was down again today with above average volume, triggering a technical sell signal while violating its 50-day moving average (DMA) line and enduring more distributional pressure. Recent damaging losses completely negated its prior breakout raising concerns. It was last shown in this FSU section on 11/21/12 with an annotated graph under the headline, "Bullish Action in Outlier While Market Remains in a Correction", as it rallied and closed above its pivot point with volume +75% above average triggering a technical buy signal. The prior article cautioned members - "Its steep decline from its May high urges caution, even though it has rebounded impressively."
In the 11/20/12 mid-day report (read here) it was highlighted in yellow with pivot point cited based on its 11/08/12 high after a cup-with-handle base with an annotated graph. The way it encountered resistance near prior highs was a concern following the breakout. Disciplined investors always limit losses if ever any stock falls more than -7% from where it was purchased.
It reported earnings +57% on +47% sales revenues for the quarter ended September 30, 2012 versus the year ago period, the 6th consecutive quarterly comparison with a strong earnings increase well above the +25% minimum guideline (C criteria) backed by strong sales revenues growth. It also has a good annual earnings (A criteria) history. The number of top-rated funds owning its shares rose from 282 in Mar '12 to 290 in Sep '12, a slightly reassuring sign concerning the I criteria. Keep in mind that some mutual fund managers are also restricted by their fund family's rules from buying companies that make firearms, tobacco, or alcohol products.
See additional details in the article "Ken's Mailbag Q&A 12/10/12 - Challenges of when to lock in a profit or accumulate more shares".
|
|
|
Color Codes Explained :
Y - Better candidates highlighted by our
staff of experts.
G - Previously featured
in past reports as yellow but may no longer be buyable under the
guidelines.
***Last / Change / Volume data in this table is the closing quote data***
Symbol/Exchange
Company Name
Industry Group |
PRICE |
CHANGE
(%Change) |
Day High |
Volume
(% DAV)
(% 50 day avg vol) |
52 Wk Hi
% From Hi |
Featured
Date |
Price
Featured |
Pivot Featured |
|
Max Buy |
CELG
-
NASDAQ
Celgene Corp
DRUGS - Drug Manufacturers - Major
|
$79.36
|
-0.48
-0.60% |
$80.34
|
2,349,977
83.81% of 50 DAV
50 DAV is 2,803,900
|
$82.78
-4.13%
|
12/11/2012
|
$82.24
|
PP = $81.34
|
|
MB = $85.41
|
Most Recent Note - 12/12/2012 6:50:26 PM
Y - Pulled back today and finished just below its pivot point. Triggered a technical buy signal on the prior session. Disciplined investors always limit losses if any stock falls -7% from their purchase price. See the latest FSU analysis for more details and a new annotated graph.
>>> The latest Featured Stock Update with an annotated graph appeared on 12/12/2012. Click here.
View all notes |
Alert me of new notes |
CANSLIM.net Company Profile |
SEC |
Zacks Reports |
StockTalk |
News |
Chart |
Request a new note
C
A N
S L
I M


|
CFNL
-
NASDAQ
Cardinal Financial Corp
BANKING - Regional - Southeast Banks
|
$15.73
|
-0.07
-0.44% |
$15.79
|
104,397
51.81% of 50 DAV
50 DAV is 201,500
|
$16.21
-2.96%
|
12/3/2012
|
$15.20
|
PP = $16.31
|
|
MB = $17.13
|
Most Recent Note - 12/11/2012 6:33:40 PM
Y - Traded above average volume today, but the gain was not big enough to help it rally above its pivot point to trigger a proper new (or add-on) technical buy signal.
>>> The latest Featured Stock Update with an annotated graph appeared on 12/10/2012. Click here.
View all notes |
Alert me of new notes |
CANSLIM.net Company Profile |
SEC |
Zacks Reports |
StockTalk |
News |
Chart |
Request a new note
C
A N
S L
I M
|
CMCSA
-
NASDAQ
Comcast Corp Cl A
MEDIA - CATV Systems
|
$36.54
|
-0.40
-1.08% |
$36.90
|
12,332,627
105.23% of 50 DAV
50 DAV is 11,719,900
|
$37.96
-3.74%
|
12/3/2012
|
$37.08
|
PP = $38.06
|
|
MB = $39.96
|
 Most Recent Note - 12/14/2012 3:58:39 PM
Y - Pulled back near its 50 DMA line today, yet it remains only -3.6% off its 52-week high. Disciplined investors will watch for gains above the pivot point backed by at least the bare minimum +40% above average volume threshold to trigger a proper new (or add-on) technical buy signal before taking action.
>>> The latest Featured Stock Update with an annotated graph appeared on 12/7/2012. Click here.
View all notes |
Alert me of new notes |
CANSLIM.net Company Profile |
SEC |
Zacks Reports |
StockTalk |
News |
Chart |
Request a new note
C
A N
S L
I M
|
LKQ
-
NASDAQ
L K Q Corp
WHOLESALE - Auto Parts
|
$20.70
|
-0.23
-1.10% |
$20.93
|
1,776,677
83.62% of 50 DAV
50 DAV is 2,124,800
|
$22.29
-7.11%
|
8/9/2012
|
$18.97
|
PP = $18.72
|
|
MB = $19.66
|
Most Recent Note - 12/14/2012 3:56:33 PM
Violated its 50 DMA line today with a 4th consecutive loss. Previously noted a worrisome "negative reversal" on 11/26/12. Results below the +25% minimum earnings guideline (C criteria) for Sep '12 recently raised fundamental concerns. Due to fundamental and technical weakness it will be dropped from the Featured Stocks list tonight.
>>> The latest Featured Stock Update with an annotated graph appeared on 11/30/2012. Click here.
View all notes |
Alert me of new notes |
CANSLIM.net Company Profile |
SEC |
Zacks Reports |
StockTalk |
News |
Chart |
Request a new note
C
A N
S L
I M
|
MIDD
-
NASDAQ
Middleby Corp
MANUFACTURING - Diversified Machinery
|
$128.41
|
+1.25
0.98% |
$129.44
|
69,461
90.33% of 50 DAV
50 DAV is 76,900
|
$129.99
-1.22%
|
10/8/2012
|
$118.46
|
PP = $122.67
|
|
MB = $128.80
|
Most Recent Note - 12/11/2012 7:00:05 PM
G - Color code is changed to green after a volume-driven gain today above its "max buy" level. Earnings +23% on +18% sales for the Sep '12 quarter, below the +25% minimum earnings guideline (C criteria), raised concerns.
>>> The latest Featured Stock Update with an annotated graph appeared on 12/6/2012. Click here.
View all notes |
Alert me of new notes |
CANSLIM.net Company Profile |
SEC |
Zacks Reports |
StockTalk |
News |
Chart |
Request a new note
C
A N
S L
I M
|
Symbol/Exchange
Company Name
Industry Group |
PRICE |
CHANGE
(%Change) |
Day High |
Volume
(% DAV)
(% 50 day avg vol) |
52 Wk Hi
% From Hi |
Featured
Date |
Price
Featured |
Pivot Featured |
|
Max Buy |
N
-
NYSE
Netsuite Inc
DIVERSIFIED SERVICES - Business/Management Services
|
$64.42
|
+0.56
0.88% |
$64.73
|
395,816
83.28% of 50 DAV
50 DAV is 475,300
|
$67.02
-3.88%
|
12/12/2012
|
$64.75
|
PP = $67.12
|
|
MB = $70.48
|
Most Recent Note - 12/13/2012 5:36:00 PM
Y - Fundamentals (C and A criteria) remain strong and it was highlighted in yellow with new pivot point cited based on its 10/26/12 high plus 10 cents. Disciplined investors will watch for subsequent volume-driven gains above the pivot point which may trigger a technical buy signal before taking action. See the latest FSU analysis for more details and a new annotated graph.
>>> The latest Featured Stock Update with an annotated graph appeared on 12/13/2012. Click here.
View all notes |
Alert me of new notes |
CANSLIM.net Company Profile |
SEC |
Zacks Reports |
StockTalk |
News |
Chart |
Request a new note
C
A N
S L
I M
|
NSR
-
NYSE
Neustar Inc
TELECOMMUNICATIONS - Diversified Communication Serv
|
$41.70
|
-0.42
-1.00% |
$42.31
|
349,596
102.31% of 50 DAV
50 DAV is 341,700
|
$43.29
-3.67%
|
12/11/2012
|
$41.85
|
PP = $41.41
|
|
MB = $43.48
|
Most Recent Note - 12/12/2012 12:40:43 PM
Y - Off earlier highs after rallying near its "max buy" level today. Its strong finish on heavy volume clinched a technical buy signal on the prior session as it hit new 52-week highs and rallied from a 10-week base. Quarterly comparisons through Sep '12 showed 3 consecutive increases of more than the +25% minimum earnings guideline (C criteria). See the latest FSU analysis for more details and a new annotated graph.
>>> The latest Featured Stock Update with an annotated graph appeared on 12/11/2012. Click here.
View all notes |
Alert me of new notes |
CANSLIM.net Company Profile |
SEC |
Zacks Reports |
StockTalk |
News |
Chart |
Request a new note
C
A N
S L
I M
|
RAX
-
NYSE
Rackspace Hosting Inc
INTERNET - Internet Software and; Services
|
$68.73
|
+1.70
2.54% |
$69.12
|
1,151,053
77.41% of 50 DAV
50 DAV is 1,487,000
|
$70.00
-1.81%
|
11/26/2012
|
$66.26
|
PP = $67.18
|
|
MB = $70.54
|
Most Recent Note - 12/14/2012 4:00:36 PM
Y - Wedged up toward its 52-week high today, but gains have lacked volume conviction while it has inched its pivot point. Previously noted - "Confirming gains above its pivot point with at least +40% above average volume would be a welcome reassurance. Disciplined investors may be wise to use a tactic called 'pyramiding' to allow the market action to dictate their weighting in new buys while always limiting losses by selling if any stock ever falls more than -7% from their purchase price."
>>> The latest Featured Stock Update with an annotated graph appeared on 11/27/2012. Click here.
View all notes |
Alert me of new notes |
CANSLIM.net Company Profile |
SEC |
Zacks Reports |
StockTalk |
News |
Chart |
Request a new note
C
A N
S L
I M
|
RGR
-
NYSE
Sturm Ruger & Co Inc
CONSUMER DURABLES - Sporting Goods
|
$45.57
|
-2.16
-4.53% |
$47.72
|
927,133
178.91% of 50 DAV
50 DAV is 518,200
|
$55.66
-18.12%
|
11/20/2012
|
$52.23
|
PP = $52.65
|
|
MB = $55.28
|
Most Recent Note - 12/14/2012 4:56:03 PM
G - Down today with above average volume, slumping near its 50 DMA line while enduring more distributional pressure. See the latest FSU analysis for more details and a new annotated graph.
>>> The latest Featured Stock Update with an annotated graph appeared on 12/14/2012. Click here.
View all notes |
Alert me of new notes |
CANSLIM.net Company Profile |
SEC |
Zacks Reports |
StockTalk |
News |
Chart |
Request a new note
C
A N
S L
I M
|
RNF
-
NYSE
Rentech Nitrogen Ptnr Lp
CHEMICALS - Agricultural Chemicals
|
$37.50
|
-0.47
-1.24% |
$38.20
|
272,029
80.17% of 50 DAV
50 DAV is 339,300
|
$41.15
-8.87%
|
11/1/2012
|
$39.11
|
PP = $40.15
|
|
MB = $42.16
|
Most Recent Note - 12/13/2012 1:00:48 PM
Y - Slumping near its 50 DMA line today with volume picking up while retreating from its 52-week high. Recent gains with below average volume indicated lackluster buying demand from the institutional crowd. Disciplined investors may watch for volume-driven gains for a new high close to trigger a technical buy signal.
>>> The latest Featured Stock Update with an annotated graph appeared on 11/26/2012. Click here.
View all notes |
Alert me of new notes |
CANSLIM.net Company Profile |
SEC |
Zacks Reports |
StockTalk |
News |
Chart |
Request a new note
C
A N
S L
I M
|
Symbol/Exchange
Company Name
Industry Group |
PRICE |
CHANGE
(%Change) |
Day High |
Volume
(% DAV)
(% 50 day avg vol) |
52 Wk Hi
% From Hi |
Featured
Date |
Price
Featured |
Pivot Featured |
|
Max Buy |
ULTA
-
NASDAQ
Ulta Salon Cosm & Frag
SPECIALTY RETAIL - Specialty Retail, Other
|
$95.00
|
+0.75
0.80% |
$95.33
|
739,160
94.62% of 50 DAV
50 DAV is 781,200
|
$103.52
-8.23%
|
12/4/2012
|
$100.29
|
PP = $103.62
|
|
MB = $108.80
|
Most Recent Note - 12/11/2012 7:05:33 PM
Y - Damaging loss today on higher volume indicated distributional pressure against a mostly positive market backdrop, retreating from new its 52-week high. Disciplined investors will watch for volume-driven gains above the pivot point to trigger a new technical buy signal.
>>> The latest Featured Stock Update with an annotated graph appeared on 12/4/2012. Click here.
View all notes |
Alert me of new notes |
CANSLIM.net Company Profile |
SEC |
Zacks Reports |
StockTalk |
News |
Chart |
Request a new note
C
A N
S L
I M
|
VSI
-
NYSE
Vitamin Shoppe Inc
SPECIALTY RETAIL - Specialty Retail, Other
|
$55.68
|
-0.84
-1.49% |
$56.89
|
321,255
133.74% of 50 DAV
50 DAV is 240,200
|
$61.89
-10.03%
|
12/3/2012
|
$59.06
|
PP = $61.99
|
|
MB = $65.09
|
Most Recent Note - 12/13/2012 1:02:47 PM
G - Still sputtering below its 50 DMA line today. Technically, the longer it lingers below its important short-term average the worse its outlook gets. The $61 area has been a stubborn resistance level in recent months.
>>> The latest Featured Stock Update with an annotated graph appeared on 12/3/2012. Click here.
View all notes |
Alert me of new notes |
CANSLIM.net Company Profile |
SEC |
Zacks Reports |
StockTalk |
News |
Chart |
Request a new note
C
A N
S L
I M
|
WPI
-
NYSE
Watson Pharmaceuticals
DRUGS - Drugs - Generic
|
$87.74
|
-0.42
-0.48% |
$88.28
|
700,197
92.09% of 50 DAV
50 DAV is 760,300
|
$90.39
-2.93%
|
8/24/2012
|
$82.90
|
PP = $81.10
|
|
MB = $85.16
|
Most Recent Note - 12/11/2012 6:26:59 PM
G - Challenged its 52-week high today and finished at a best-ever close with a solid gain on slightly above average volume. No resistance remains due to overhead supply. Quarterly comparisons for sales revenues and earnings increases have shown sequential deceleration in its growth rate raising some fundamental concerns, as recently noted.
>>> The latest Featured Stock Update with an annotated graph appeared on 11/23/2012. Click here.
View all notes |
Alert me of new notes |
CANSLIM.net Company Profile |
SEC |
Zacks Reports |
StockTalk |
News |
Chart |
Request a new note
C
A N
S L
I M
|
|
|
|
THESE ARE NOT BUY RECOMMENDATIONS!
Comments contained in the body of this report are technical
opinions only. The material herein has been obtained
from sources believed to be reliable and accurate, however,
its accuracy and completeness cannot be guaranteed.
This site is not an investment advisor, hence it does
not endorse or recommend any securities or other investments.
Any recommendation contained in this report may not
be suitable for all investors and it is not to be deemed
an offer or solicitation on our part with respect to
the purchase or sale of any securities. All trademarks,
service marks and trade names appearing in this report
are the property of their respective owners, and are
likewise used for identification purposes only.
This report is a service available
only to active Paid Premium Members.
You may opt-out of receiving report notifications
at any time. Questions or comments may be submitted
by writing to Premium Membership Services 665 S.E. 10 Street, Suite 201 Deerfield Beach, FL 33441-5634 or by calling 1-800-965-8307
or 954-785-1121.
|
|
|

