***Last / Change / Volume data in this table is the closing quote data***
Symbol/Exchange
Company Name
Industry Group |
PRICE |
CHANGE
(%Change) |
Day High |
Volume
(% DAV)
(% 50 day avg vol) |
52 Wk Hi
% From Hi |
Featured
Date |
Price
Featured |
Pivot Featured |
|
Max Buy |
ABV
-
NYSE
Comp De Bebidas Adr
FOOD and BEVERAGE - Beverages - Brewers
|
$142.95
|
+0.63
0.44% |
$143.64
|
360,630
57.30% of 50 DAV
50 DAV is 629,400
|
$145.36
-1.66%
|
12/10/2010
|
$139.87
|
PP = $145.46
|
|
MB = $152.73
|
Most Recent Note - 12/10/2010 1:49:21 PM
Y - Volume totals have been drying up while consolidating just above its 50 DMA line. Color code remains yellow while a slightly higher pivot point is cited today after a longer orderly base has been formed. A gain into new high territory with great volume conviction may trigger a new (or add-on) buy signal. Recent lows in the $133 area define important chart support to watch.
>>> The latest Featured Stock Update with an annotated graph appeared on 12/3/2010. Click here.
View all notes |
Alert me of new notes |
CANSLIM.net Company Profile |
SEC |
Zacks Reports |
StockTalk |
News |
Chart |
Request a new note
C
A N
S L
I M


|
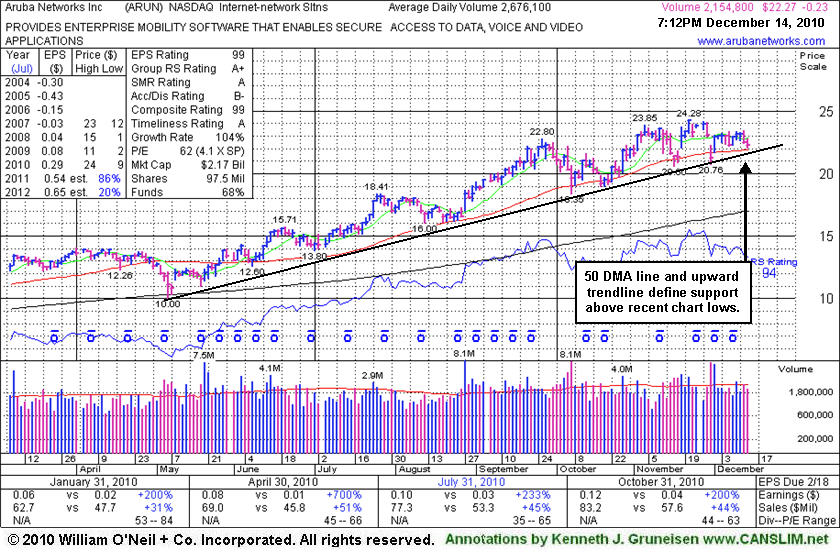
ARUN
-
NASDAQ
Aruba Networks Inc
COMPUTER HARDWARE - Networking andamp; Communication Dev
|
$22.27
|
-0.23
-1.02% |
$22.75
|
2,154,787
80.46% of 50 DAV
50 DAV is 2,678,100
|
$24.28
-8.28%
|
8/30/2010
|
$18.12
|
PP = $18.51
|
|
MB = $19.44
|
 Most Recent Note - 12/14/2010 7:19:36 PM
G - Perched -8.3% off its 52-week high, consolidating near its 50 DMA line and an upward trendline. See the latest FSU analysis for more details and an annotated graph.
>>> The latest Featured Stock Update with an annotated graph appeared on 12/14/2010. Click here.
View all notes |
Alert me of new notes |
CANSLIM.net Company Profile |
SEC |
Zacks Reports |
StockTalk |
News |
Chart |
Request a new note
C
A N
S L
I M
|
BIDU
-
NASDAQ
Baidu Inc Ads
INTERNET - Internet Information Providers
|
$106.62
|
-1.69
-1.56% |
$108.74
|
7,128,868
63.78% of 50 DAV
50 DAV is 11,177,900
|
$115.04
-7.32%
|
12/10/2010
|
$108.00
|
PP = $115.14
|
|
MB = $120.90
|
Most Recent Note - 12/10/2010 1:53:27 PM
Y - Consolidating above important support at its 50 DMA line, a new pivot point is cited and its color code is changed to yellow. BIDU has been noted as a riskier "late stage" candidate, yet could trigger a new (or add-on) buy signal and go on to produce more climactic gains. Meanwhile, any damaging violation of its short-term average or recent chart low ($103.11 on 11/16/10) would raise concerns and trigger technical sell signals.
>>> The latest Featured Stock Update with an annotated graph appeared on 11/30/2010. Click here.
View all notes |
Alert me of new notes |
CANSLIM.net Company Profile |
SEC |
Zacks Reports |
StockTalk |
News |
Chart |
Request a new note
C
A N
S L
I M
|
CACC
-
NASDAQ
Credit Acceptance Corp
FINANCIAL SERVICES - Credit Services
|
$61.65
|
+0.34
0.55% |
$61.75
|
20,316
84.65% of 50 DAV
50 DAV is 24,000
|
$63.45
-2.84%
|
11/22/2010
|
$59.97
|
PP = $62.00
|
|
MB = $65.10
|
Most Recent Note - 12/9/2010 5:33:26 PM
Y - Hovering only -2.4% off its 52-week high, stubbornly holding its ground since the 11/29/10 gain with +69% above average volume triggered a technical buy signal. Additional volume-driven gains into new high territory would be a reassuring sign.
>>> The latest Featured Stock Update with an annotated graph appeared on 10/29/2010. Click here.
View all notes |
Alert me of new notes |
CANSLIM.net Company Profile |
SEC |
Zacks Reports |
StockTalk |
News |
Chart |
Request a new note
C
A N
S L
I M
|
CIS
-
NYSE
Camelot Info Systems Ads
COMPUTER SOFTWARE andamp; SERVICES - Information Technology Service
|
$20.25
|
-0.75
-3.57% |
$21.10
|
538,375
149.92% of 50 DAV
50 DAV is 359,100
|
$24.89
-18.64%
|
11/26/2010
|
$18.93
|
PP = $19.72
|
|
MB = $20.71
|
Most Recent Note - 12/14/2010 4:31:38 PM
G - Consolidating above its 50 DMA line since it priced a Secondary Offering on 12/10/10 in which the company received no proceeds from the sale by existing shareholders. Following a couple of damaging distribution days, it found support near prior highs in the $19.50 area previously noted as chart support to watch.
>>> The latest Featured Stock Update with an annotated graph appeared on 11/26/2010. Click here.
View all notes |
Alert me of new notes |
CANSLIM.net Company Profile |
SEC |
Zacks Reports |
StockTalk |
News |
Chart |
Request a new note
C
A N
S L
I M
|
Symbol/Exchange
Company Name
Industry Group |
PRICE |
CHANGE
(%Change) |
Day High |
Volume
(% DAV)
(% 50 day avg vol) |
52 Wk Hi
% From Hi |
Featured
Date |
Price
Featured |
Pivot Featured |
|
Max Buy |
CMG
-
NYSE
Chipotle Mexican Grill
LEISURE - Restaurants
|
$227.90
|
+1.79
0.79% |
$230.60
|
1,316,830
128.22% of 50 DAV
50 DAV is 1,027,000
|
$262.78
-13.27%
|
9/1/2010
|
$158.31
|
PP = $155.52
|
|
MB = $163.30
|
Most Recent Note - 12/13/2010 3:41:48 PM
G - Higher volume is behind today's considerable loss following a small gain on very light volume. It is slumping toward its 50 DMA line previously noted as a chart support level to watch
>>> The latest Featured Stock Update with an annotated graph appeared on 10/28/2010. Click here.
View all notes |
Alert me of new notes |
CANSLIM.net Company Profile |
SEC |
Zacks Reports |
StockTalk |
News |
Chart |
Request a new note
C
A N
S L
I M
|
DECK
-
NASDAQ
Deckers Outdoor Corp
CONSUMER NON-DURABLES - Textile - Apparel Footwear
|
$79.92
|
-0.66
-0.82% |
$80.99
|
1,389,629
79.11% of 50 DAV
50 DAV is 1,756,600
|
$85.00
-5.98%
|
10/27/2010
|
$54.16
|
PP = $54.86
|
|
MB = $57.60
|
Most Recent Note - 12/10/2010 1:42:14 PM
G - Up today after distributional losses this week including a negative reversal at an all-time high. It has been noted as very extended from any sound base, while its 50 DMA line defines the nearest chart support.
>>> The latest Featured Stock Update with an annotated graph appeared on 10/27/2010. Click here.
View all notes |
Alert me of new notes |
CANSLIM.net Company Profile |
SEC |
Zacks Reports |
StockTalk |
News |
Chart |
Request a new note
C
A N
S L
I M
|
EZCH
-
NASDAQ
Ezchip Semiconductor Ltd
ELECTRONICS - Semiconductor - Specialized
|
$27.41
|
-1.19
-4.16% |
$28.94
|
342,460
125.21% of 50 DAV
50 DAV is 273,500
|
$29.73
-7.80%
|
12/2/2010
|
$27.53
|
PP = $26.00
|
|
MB = $27.30
|
Most Recent Note - 12/14/2010 4:28:46 PM
G - Loss today with slightly above average volume, slumping toward prior chart highs in the $26 area that define an important technical support level to watch.
>>> The latest Featured Stock Update with an annotated graph appeared on 12/2/2010. Click here.
View all notes |
Alert me of new notes |
CANSLIM.net Company Profile |
SEC |
Zacks Reports |
StockTalk |
News |
Chart |
Request a new note
C
A N
S L
I M
|
EZPW
-
NASDAQ
Ezcorp Inc Cl A
SPECIALTY RETAIL - Specialty Retail, Other
|
$27.59
|
-0.17
-0.61% |
$28.07
|
210,681
64.06% of 50 DAV
50 DAV is 328,900
|
$28.27
-2.41%
|
11/5/2010
|
$24.02
|
PP = $23.85
|
|
MB = $25.04
|
Most Recent Note - 12/8/2010 6:01:40 PM
G - Gain today with above average volume for a new all-time high. Extended from a sound base pattern, its prior highs in the $22-23 area define chart support to watch coinciding with its 50 DMA line.
>>> The latest Featured Stock Update with an annotated graph appeared on 11/6/2010. Click here.
View all notes |
Alert me of new notes |
CANSLIM.net Company Profile |
SEC |
Zacks Reports |
StockTalk |
News |
Chart |
Request a new note
C
A N
S L
I M
|
FFIV
-
NASDAQ
F 5 Networks Inc
INTERNET - Internet Software and Services
|
$133.65
|
-5.41
-3.89% |
$140.22
|
3,474,345
117.11% of 50 DAV
50 DAV is 2,966,800
|
$143.75
-7.03%
|
6/16/2010
|
$74.50
|
PP = $74.10
|
|
MB = $77.81
|
Most Recent Note - 12/14/2010 2:17:38 PM
G - Pulling back from its all-time high, it has been repeatedly noted as extended from any sound base pattern. Its 50 DMA line and prior highs define chart support levels to watch.
>>> The latest Featured Stock Update with an annotated graph appeared on 11/15/2010. Click here.
View all notes |
Alert me of new notes |
CANSLIM.net Company Profile |
SEC |
Zacks Reports |
StockTalk |
News |
Chart |
Request a new note
C
A N
S L
I M
|
Symbol/Exchange
Company Name
Industry Group |
PRICE |
CHANGE
(%Change) |
Day High |
Volume
(% DAV)
(% 50 day avg vol) |
52 Wk Hi
% From Hi |
Featured
Date |
Price
Featured |
Pivot Featured |
|
Max Buy |
FOSL
-
NASDAQ
Fossil Inc
CONSUMER DURABLES - Recreational Goods, Other
|
$72.79
|
-0.40
-0.55% |
$73.74
|
341,613
42.06% of 50 DAV
50 DAV is 812,200
|
$74.34
-2.09%
|
11/26/2010
|
$69.10
|
PP = $70.17
|
|
MB = $73.68
|
Most Recent Note - 12/9/2010 5:34:29 PM
Y - Gain today with light volume for a new high close. It rallied to a new all-time high above its pivot point with volume +147% above average behind its considerable 12/02/10 gain, triggering a technical buy signal after an advanced "3-weeks tight" pattern.
>>> The latest Featured Stock Update with an annotated graph appeared on 11/29/2010. Click here.
View all notes |
Alert me of new notes |
CANSLIM.net Company Profile |
SEC |
Zacks Reports |
StockTalk |
News |
Chart |
Request a new note
C
A N
S L
I M
|
HMSY
-
NASDAQ
H M S Holdings Corp
COMPUTER SOFTWARE and SERVICES - Healthcare Information Service
|
$65.17
|
-0.01
-0.02% |
$65.51
|
127,771
64.01% of 50 DAV
50 DAV is 199,600
|
$67.01
-2.75%
|
11/19/2010
|
$61.89
|
PP = $63.01
|
|
MB = $66.16
|
Most Recent Note - 12/10/2010 2:10:54 PM
G - Consolidating after a streak of gains with below average volume. Prior highs near $62 define initial chart support to watch above its 50 DMA line.
>>> The latest Featured Stock Update with an annotated graph appeared on 11/19/2010. Click here.
View all notes |
Alert me of new notes |
CANSLIM.net Company Profile |
SEC |
Zacks Reports |
StockTalk |
News |
Chart |
Request a new note
C
A N
S L
I M
|
HS
-
NYSE
Healthspring Inc
HEALTH SERVICES - Health Care Plans
|
$27.93
|
+0.73
2.68% |
$28.08
|
551,744
98.35% of 50 DAV
50 DAV is 561,000
|
$29.80
-6.28%
|
8/27/2010
|
$19.91
|
PP = $19.75
|
|
MB = $20.74
|
Most Recent Note - 12/13/2010 3:46:33 PM
G - Higher volume is behind today's considerable loss following a small gain on very light volume. It is slumping toward its 50 DMA line previously noted as a chart support level to watch. A violation of its recent low ($26.47 on 11/29/10) would raise greater concerns and trigger a technical sell signal. See the latest FSU analysis for more details and an annotated graph.
>>> The latest Featured Stock Update with an annotated graph appeared on 12/10/2010. Click here.
View all notes |
Alert me of new notes |
CANSLIM.net Company Profile |
SEC |
Zacks Reports |
StockTalk |
News |
Chart |
Request a new note
C
A N
S L
I M
|
JOBS
-
NASDAQ
Fifty One Job Inc Ads
DIVERSIFIED SERVICES - Staffing and; Outsourcing Service
|
$50.30
|
-0.71
-1.39% |
$51.00
|
172,546
90.86% of 50 DAV
50 DAV is 189,900
|
$55.50
-9.37%
|
10/13/2010
|
$42.07
|
PP = $40.60
|
|
MB = $42.63
|
Most Recent Note - 12/13/2010 1:48:40 PM
G - Pulling back today after recently challenging its all-time high near $55 from 2004. It is extended from any sound base, and a steep upward trendline defines initial support to watch above its 50 DMA line.
>>> The latest Featured Stock Update with an annotated graph appeared on 11/16/2010. Click here.
View all notes |
Alert me of new notes |
CANSLIM.net Company Profile |
SEC |
Zacks Reports |
StockTalk |
News |
Chart |
Request a new note
C
A N
S L
I M
|
LULU
-
NASDAQ
Lululemon Athletica
MANUFACTURING - Textile Manufacturing
|
$67.80
|
-2.07
-2.96% |
$70.25
|
2,599,330
185.95% of 50 DAV
50 DAV is 1,397,900
|
$73.48
-7.73%
|
10/8/2010
|
$47.66
|
PP = $46.67
|
|
MB = $49.00
|
Most Recent Note - 12/13/2010 12:48:27 PM
G - Up considerably today for a 3rd consecutive gap up gain and new all-time high. Since blasting above its 2007 high it has gotten very extended from any sound base.
>>> The latest Featured Stock Update with an annotated graph appeared on 12/1/2010. Click here.
View all notes |
Alert me of new notes |
CANSLIM.net Company Profile |
SEC |
Zacks Reports |
StockTalk |
News |
Chart |
Request a new note
C
A N
S L
I M
|
Symbol/Exchange
Company Name
Industry Group |
PRICE |
CHANGE
(%Change) |
Day High |
Volume
(% DAV)
(% 50 day avg vol) |
52 Wk Hi
% From Hi |
Featured
Date |
Price
Featured |
Pivot Featured |
|
Max Buy |
MWIV
-
NASDAQ
M W I Veterinary Supply
HEALTH SERVICES - Medical Instruments and; Supplies
|
$61.50
|
+1.17
1.94% |
$61.54
|
40,055
71.78% of 50 DAV
50 DAV is 55,800
|
$63.94
-3.82%
|
11/4/2010
|
$61.79
|
PP = $59.60
|
|
MB = $62.58
|
Most Recent Note - 12/14/2010 4:45:05 PM
Y - Rising from support at its 50 DMA line, now -3.8% off its 52-week high. Volume totals have been drying up since hitting its all-time high on 11/04/10. Its short-term average and an upward trendline connecting its May - August lows define chart support levels to watch.
>>> The latest Featured Stock Update with an annotated graph appeared on 11/2/2010. Click here.
View all notes |
Alert me of new notes |
CANSLIM.net Company Profile |
SEC |
Zacks Reports |
StockTalk |
News |
Chart |
Request a new note
C
A N
S L
I M
|
NEOG
-
NASDAQ
Neogen Corp
DRUGS - Diagnostic Substances
|
$39.97
|
+0.37
0.93% |
$39.99
|
72,612
98.26% of 50 DAV
50 DAV is 73,900
|
$40.27
-0.74%
|
9/1/2010
|
$30.79
|
PP = $30.49
|
|
MB = $32.01
|
Most Recent Note - 12/13/2010 6:07:54 PM
G - Broke a streak of 5 consecutive gains today with a negative reversal for a loss with above average volume after hitting a new all-time high. Extended from any sound base after steadily advancing. Its 50 DMA line has been a reliable support level.
>>> The latest Featured Stock Update with an annotated graph appeared on 12/6/2010. Click here.
View all notes |
Alert me of new notes |
CANSLIM.net Company Profile |
SEC |
Zacks Reports |
StockTalk |
News |
Chart |
Request a new note
C
A N
S L
I M
|
NFLX
-
NASDAQ
Netflix Inc
SPECIALTY RETAIL - Music and Video Stores
|
$178.45
|
-5.35
-2.91% |
$182.70
|
9,076,219
152.22% of 50 DAV
50 DAV is 5,962,600
|
$206.80
-13.71%
|
11/9/2010
|
$173.10
|
PP = $184.84
|
|
MB = $194.08
|
Most Recent Note - 12/13/2010 1:49:45 PM
G - Holding its ground above prior highs in the $184 area after recent negative reversals and distributional pressure raised concerns. An upward trendline connecting its July - November lows defines initial support to watch above its 50 DMA line.
>>> The latest Featured Stock Update with an annotated graph appeared on 11/24/2010. Click here.
View all notes |
Alert me of new notes |
CANSLIM.net Company Profile |
SEC |
Zacks Reports |
StockTalk |
News |
Chart |
Request a new note
C
A N
S L
I M
|
NTAP
-
NASDAQ
Netapp Inc
COMPUTER HARDWARE - Data Storage Devices
|
$53.49
|
-2.09
-3.76% |
$55.51
|
7,712,130
115.59% of 50 DAV
50 DAV is 6,671,700
|
$57.96
-7.71%
|
9/8/2010
|
$46.98
|
PP = $44.99
|
|
MB = $47.24
|
Most Recent Note - 12/14/2010 4:34:13 PM
G - Consolidating above its 50 DMA line, working on a new base.
>>> The latest Featured Stock Update with an annotated graph appeared on 11/3/2010. Click here.
View all notes |
Alert me of new notes |
CANSLIM.net Company Profile |
SEC |
Zacks Reports |
StockTalk |
News |
Chart |
Request a new note
C
A N
S L
I M
|
ORCL
-
NASDAQ
Oracle Corp
COMPUTER SOFTWARE and SERVICES - Application Software
|
$30.51
|
+0.10
0.31% |
$30.75
|
25,351,723
80.15% of 50 DAV
50 DAV is 31,629,500
|
$30.72
-0.67%
|
12/7/2010
|
$29.05
|
PP = $29.92
|
|
MB = $31.42
|
Most Recent Note - 12/14/2010 4:37:06 PM
Y - Up today on lighter volume, while +42% above average volume was behind the prior session's gain for a new 52-week high above the new pivot point recently cited. Volume should be at least +40-50% above average behind gains, preferably even greater, to trigger a convincing new (or add-on) technical buy signal.
>>> The latest Featured Stock Update with an annotated graph appeared on 11/18/2010. Click here.
View all notes |
Alert me of new notes |
CANSLIM.net Company Profile |
SEC |
Zacks Reports |
StockTalk |
News |
Chart |
Request a new note
C
A N
S L
I M
|
Symbol/Exchange
Company Name
Industry Group |
PRICE |
CHANGE
(%Change) |
Day High |
Volume
(% DAV)
(% 50 day avg vol) |
52 Wk Hi
% From Hi |
Featured
Date |
Price
Featured |
Pivot Featured |
|
Max Buy |
PAY
-
NYSE
Verifone Systems Inc
COMPUTER HARDWARE - Transaction Automation Systems
|
$41.27
|
+0.92
2.28% |
$41.33
|
2,212,100
151.46% of 50 DAV
50 DAV is 1,460,500
|
$40.91
0.88%
|
11/29/2010
|
$33.96
|
PP = $36.04
|
|
MB = $37.84
|
Most Recent Note - 12/14/2010 4:43:27 PM
G - Gain today with above average volume for a new high, getting more extended from a sound base. Prior high in the $36 area defines initial chart support to watch above its 50 DMA line.
>>> The latest Featured Stock Update with an annotated graph appeared on 10/25/2010. Click here.
View all notes |
Alert me of new notes |
CANSLIM.net Company Profile |
SEC |
Zacks Reports |
StockTalk |
News |
Chart |
Request a new note
C
A N
S L
I M
|
RAX
-
NYSE
Rackspace Hosting Inc
INTERNET - Internet Software and; Services
|
$31.49
|
-0.04
-0.13% |
$32.15
|
2,091,053
98.46% of 50 DAV
50 DAV is 2,123,800
|
$32.69
-3.67%
|
9/21/2010
|
$22.84
|
PP = $23.61
|
|
MB = $24.79
|
Most Recent Note - 12/13/2010 3:53:24 PM
G - Volume was almost 3 times its average daily volume total on the prior session as it hit a new all-time high, and it is poised for another new high close today. No resistance remains due to overhead supply, but it is extended from any sound base.
>>> The latest Featured Stock Update with an annotated graph appeared on 11/17/2010. Click here.
View all notes |
Alert me of new notes |
CANSLIM.net Company Profile |
SEC |
Zacks Reports |
StockTalk |
News |
Chart |
Request a new note
C
A N
S L
I M
|
ROVI
-
NASDAQ
Rovi Corp
COMPUTER SOFTWARE andamp; SERVICES - Security Software andamp; Services
|
$56.16
|
-1.06
-1.85% |
$57.35
|
984,014
89.23% of 50 DAV
50 DAV is 1,102,800
|
$58.68
-4.29%
|
10/29/2010
|
$49.99
|
PP = $53.10
|
|
MB = $55.76
|
Most Recent Note - 12/13/2010 5:58:32 PM
G - Extended from its latest base after wedging to highs without great volume conviction. Prior chart highs and its 50 DMA line define important support to watch. See the latest FSU analysis for more details and an annotated graph.
>>> The latest Featured Stock Update with an annotated graph appeared on 12/13/2010. Click here.
View all notes |
Alert me of new notes |
CANSLIM.net Company Profile |
SEC |
Zacks Reports |
StockTalk |
News |
Chart |
Request a new note
C
A N
S L
I M
|
SHOO
-
NASDAQ
Steven Madden Limited
CONSUMER NON-DURABLES - Textile - Apparel Footwear
|
$45.33
|
-0.37
-0.81% |
$46.04
|
265,263
71.95% of 50 DAV
50 DAV is 368,700
|
$47.69
-4.95%
|
11/23/2010
|
$44.61
|
PP = $44.95
|
|
MB = $47.20
|
Most Recent Note - 12/10/2010 2:23:05 PM
G - Holding its ground above prior highs since its solid gain on 12/07/10 with +90% above average volume. Prior highs in the $44 area define initial support to watch on pullbacks.
>>> The latest Featured Stock Update with an annotated graph appeared on 11/23/2010. Click here.
View all notes |
Alert me of new notes |
CANSLIM.net Company Profile |
SEC |
Zacks Reports |
StockTalk |
News |
Chart |
Request a new note
C
A N
S L
I M
|
SLW
-
NYSE
Silver Wheaton Corp
METALS and; MINING - Silver
|
$39.16
|
-0.17
-0.43% |
$39.71
|
7,790,118
77.19% of 50 DAV
50 DAV is 10,092,500
|
$42.34
-7.51%
|
8/25/2010
|
$21.40
|
PP = $21.99
|
|
MB = $23.09
|
Most Recent Note - 12/13/2010 10:32:29 AM
G - Gapped up today. Extended from any sound base, its prior chart highs in the $36-37 area define initial support well above its 50 DMA line.
>>> The latest Featured Stock Update with an annotated graph appeared on 12/8/2010. Click here.
View all notes |
Alert me of new notes |
CANSLIM.net Company Profile |
SEC |
Zacks Reports |
StockTalk |
News |
Chart |
Request a new note
C
A N
S L
I M
|
Symbol/Exchange
Company Name
Industry Group |
PRICE |
CHANGE
(%Change) |
Day High |
Volume
(% DAV)
(% 50 day avg vol) |
52 Wk Hi
% From Hi |
Featured
Date |
Price
Featured |
Pivot Featured |
|
Max Buy |
UA
-
NYSE
Under Armour Inc Cl A
CONSUMER NON-DURABLES - Textile - Apparel Clothing
|
$56.75
|
-2.96
-4.96% |
$59.84
|
1,368,333
195.48% of 50 DAV
50 DAV is 700,000
|
$60.14
-5.64%
|
9/9/2010
|
$39.99
|
PP = $40.10
|
|
MB = $42.11
|
Most Recent Note - 12/14/2010 4:23:56 PM
G - Considerable loss today with almost 2 times average volume was a sign of distributional pressure. The high-ranked Apparel - Clothing firm is extended from any sound base and well above support at its 50 DMA line.
>>> The latest Featured Stock Update with an annotated graph appeared on 11/4/2010. Click here.
View all notes |
Alert me of new notes |
CANSLIM.net Company Profile |
SEC |
Zacks Reports |
StockTalk |
News |
Chart |
Request a new note
C
A N
S L
I M
|
ULTA
-
NASDAQ
Ulta Salon Cosm & Frag
SPECIALTY RETAIL - Specialty Retail, Other
|
$33.16
|
-0.85
-2.50% |
$34.21
|
616,837
120.19% of 50 DAV
50 DAV is 513,200
|
$37.24
-10.96%
|
9/3/2010
|
$26.36
|
PP = $25.89
|
|
MB = $27.18
|
Most Recent Note - 12/14/2010 4:25:54 PM
G - Today's 3rd consecutive loss has it slumping toward its 50 DMA line which defines initial support to watch.
>>> The latest Featured Stock Update with an annotated graph appeared on 11/1/2010. Click here.
View all notes |
Alert me of new notes |
CANSLIM.net Company Profile |
SEC |
Zacks Reports |
StockTalk |
News |
Chart |
Request a new note
C
A N
S L
I M
|
VIT
-
NYSE
Vanceinfo Tech Inc Ads
COMPUTER SOFTWARE and SERVICES - Business Software and Services
|
$35.01
|
-1.17
-3.23% |
$36.44
|
498,618
76.37% of 50 DAV
50 DAV is 652,900
|
$41.06
-14.73%
|
7/8/2010
|
$25.20
|
PP = $26.58
|
|
MB = $27.91
|
Most Recent Note - 12/14/2010 4:27:27 PM
G - Loss on light volume today, slumping back under its 50 DMA line. Endured heavy distributional pressure last week. Completed a Public Offering on 11/23/10. See the latest FSU analysis for more details and an annotated graph.
>>> The latest Featured Stock Update with an annotated graph appeared on 12/9/2010. Click here.
View all notes |
Alert me of new notes |
CANSLIM.net Company Profile |
SEC |
Zacks Reports |
StockTalk |
News |
Chart |
Request a new note
C
A N
S L
I M
|