You are not logged in.
This means you
CAN ONLY VIEW reports that were published prior to Monday, April 14, 2025.
You
MUST UPGRADE YOUR MEMBERSHIP if you want to see any current reports.
AFTER MARKET UPDATE - FRIDAY, DECEMBER 13TH, 2013
Previous After Market Report Next After Market Report >>>
|
|
|
|
DOW |
+15.93 |
15,755.36 |
+0.10% |
|
Volume |
627,325,270 |
-15% |
|
Volume |
1,506,953,300 |
-14% |
|
NASDAQ |
+2.57 |
4,000.98 |
+0.06% |
|
Advancers |
1,720 |
55% |
|
Advancers |
1,495 |
56% |
|
S&P 500 |
-0.18 |
1,775.32 |
-0.01% |
|
Decliners |
1,280 |
41% |
|
Decliners |
1,044 |
39% |
|
Russell 2000 |
+3.78 |
1,107.05 |
+0.34% |
|
52 Wk Highs |
54 |
|
|
52 Wk Highs |
51 |
|
|
S&P 600 |
+2.17 |
636.78 |
+0.34% |
|
52 Wk Lows |
114 |
|
|
52 Wk Lows |
33 |
|
|
 |
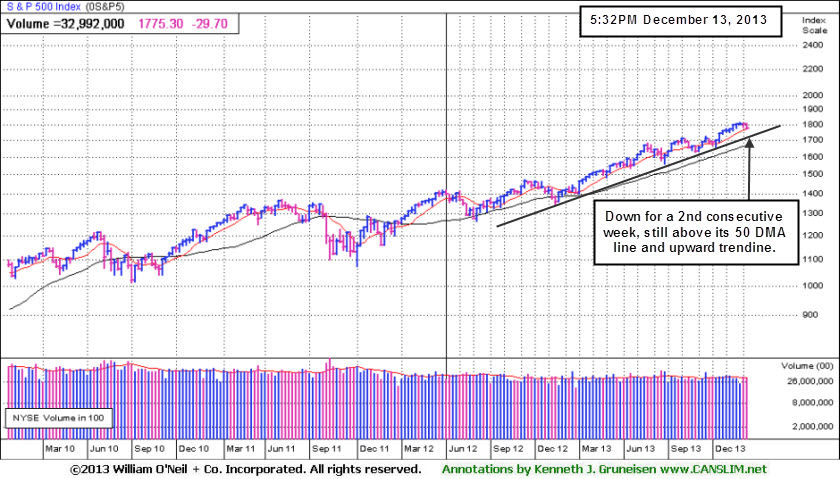
Major Indices Ended Lower For 2nd Consecutive Week
Kenneth J. Gruneisen - Passed the CAN SLIM® Master's Exam
For the week, the Dow fell -1.6%, the S&P 500 shed -1.6% and the NASDAQ was off -1.5%. The major averages ended mixed on Friday. The volume totals were reported lighter on the NYSE and on the Nasdaq exchange. Breadth was positive as advancers led decliners by nearly 3-2 on the NYSE and on the Nasdaq exchange. There were 20 high-ranked companies from the CANSLIM.net Leaders List that made new 52-week highs and appeared on the CANSLIM.net BreakOuts Page, up from a total of 10 stocks on the prior session. The list of stocks hitting new 52-week highs outnumbered new lows on the Nasdaq exchange, however new lows again outnumbered new highs on the NYSE. There were gains for 8 of the 16 high-ranked companies currently included on the Featured Stocks Page.
Stocks toggled between gains and losses throughout the session. Investors remain cautious ahead of next week's FOMC meeting which may reveal the future of the Fed's bond-buying program. On the earnings front, Adobe Systems (ADBE +12.78%) rose following their quarterly report. In other news, Anadarko Petroleum (APC -6.42%) fell after a U.S. bankruptcy judge ruled that the company may be liable for between $5 billion and $14 billion in environmental cleanup costs related to their 2005 spin-off of Tronox.
Turning to fixed income markets, Treasuries ended higher along the curve. The benchmark 10-year note was up 1/16 of a point to yield 2.87% and the 30-year bond advanced 11/32 to yield 3.88%.
The Market (M criteria) rally has come under more worrisome distributional pressure while leadership (stocks hitting new highs) has waned. Any new buying efforts should be selective. The CANSLIM.net Featured Stocks Page shows the most action-worthy candidates and their latest notes and a new Headline Link directs members to the latest detailed analysis with data-packed graphs annotated by a Certified expert along with links to additional resources. The Premium Member Homepage - includes "dynamic archives" to all prior pay reports published. Watch for an announcement via email concerning the next WEBCAST.
PICTURED: The S&P 500 Index pulled back for a 2nd consecutive week. It is still above its 50-day moving average (DMA) line and well above an upward trendline defining important support levels to watch.
|
 Kenneth J. Gruneisen started out as a licensed stockbroker in August 1987, a couple of months prior to the historic stock market crash that took the Dow Jones Industrial Average down -22.6% in a single day. He has published daily fact-based fundamental and technical analysis on high-ranked stocks online for two decades. Through FACTBASEDINVESTING.COM, Kenneth provides educational articles, news, market commentary, and other information regarding proven investment systems that work in good times and bad.
Comments contained in the body of this report are technical opinions only and are not necessarily those of Gruneisen Growth Corp. The material herein has been obtained from sources believed to be reliable and accurate, however, its accuracy and completeness cannot be guaranteed. Our firm, employees, and customers may effect transactions, including transactions contrary to any recommendation herein, or have positions in the securities mentioned herein or options with respect thereto. Any recommendation contained in this report may not be suitable for all investors and it is not to be deemed an offer or solicitation on our part with respect to the purchase or sale of any securities. |
|
 |
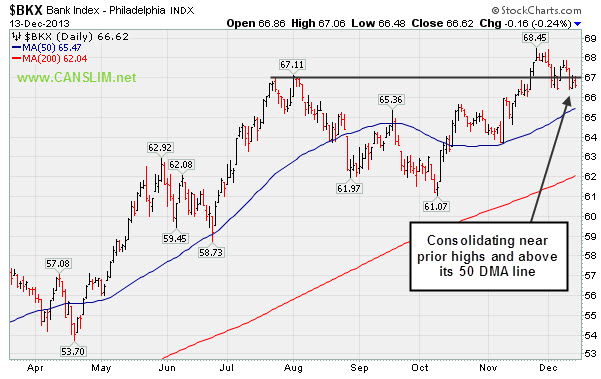
Group Indices Friday Showed No Decisiveness
Kenneth J. Gruneisen - Passed the CAN SLIM® Master's Exam
The Retail Index ($RLX +0.19%) had a slightly positive bias while the Bank Index ($BKX -0.24%) edged lower and the Broker/Dealer Index ($XBD +0.07%) finished flat. The tech sector showed little direction as the Semiconductor Index ($SOX -0.06%), Biotechnology Index ($BTK +0.01%), and the Networking Index ($NWX +0.06%) each ended virtually unchanged. Commodity-linked groups were mixed as the Integrated Oil Index ($XOI -0.78%) lost ground and the Oil Services Index ($OSX -0.09%) finished flat while the Gold & Silver Index ($XAU +0.45%) posted a modest gain.
Charts courtesy www.stockcharts.com
PICTURED: The
| Oil Services |
$OSX |
272.68 |
-0.25 |
-0.09% |
+23.86% |
| Integrated Oil |
$XOI |
1,432.38 |
-11.27 |
-0.78% |
+15.34% |
| Semiconductor |
$SOX |
505.52 |
-0.32 |
-0.06% |
+31.63% |
| Networking |
$NWX |
302.08 |
+0.19 |
+0.06% |
+33.34% |
| Broker/Dealer |
$XBD |
153.31 |
+0.10 |
+0.07% |
+62.53% |
| Retail |
$RLX |
914.40 |
+1.71 |
+0.19% |
+40.02% |
| Gold & Silver |
$XAU |
82.15 |
+0.37 |
+0.45% |
-50.39% |
| Bank |
$BKX |
66.62 |
-0.16 |
-0.24% |
+29.91% |
| Biotech |
$BTK |
2,221.98 |
+0.18 |
+0.01% |
+43.63% |
|
|
|
 |
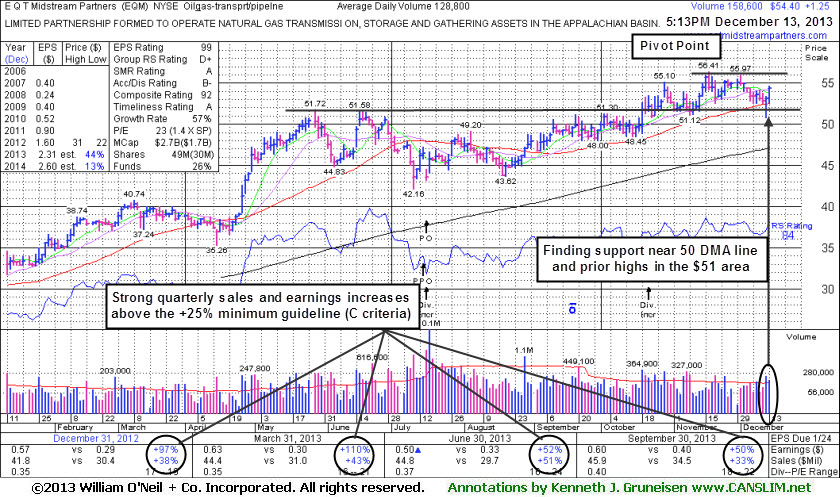
Finding Support Near 50-Day Moving Average While Perched Near Highs
Kenneth J. Gruneisen - Passed the CAN SLIM® Master's Exam
E Q T Midstream Partners (EQM +$1.25 or +2.35% to $54.40) was highlighted in yellow in the 12/12/13 mid-day report (read here) with new pivot point cited based on its 11/18/13 high plus 10 cents. Disciplined investors know there is no advantage to buying "early" and subsequent volume-driven gains for new highs are still needed to trigger a proper technical buy signal before action may be justified under the fact-based investment system. It has been finding support at its 50-day moving average (DMA) line and near prior highs in the $51 area.
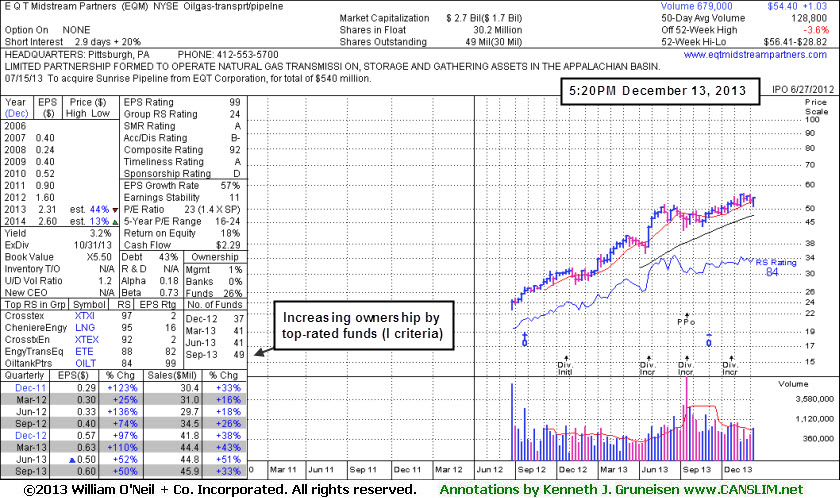
Recently it reported earnings +50% on +33% sales revenues for the Sep '13 quarter, continuing its strong earnings history (good C and A criteria). Its last appearance in this FSU section was on 7/01/13 under the headline, "Forming New Base While Awaiting New Confirmed Market Rally". It was then dropped from the Featured Stocks list on 7/10/13 and completed a new Public Offering on 7/16/13, then made gradual progress afterward.
This MLP in the Natural Gas business has seen the number of top-rated funds owning its shares rose from 20 in Jun '12 to 49 in Sep '13, a reassuring sign concerning the I criteria.
|
|
|
Color Codes Explained :
Y - Better candidates highlighted by our
staff of experts.
G - Previously featured
in past reports as yellow but may no longer be buyable under the
guidelines.
***Last / Change / Volume data in this table is the closing quote data***
Symbol/Exchange
Company Name
Industry Group |
PRICE |
CHANGE
(%Change) |
Day High |
Volume
(% DAV)
(% 50 day avg vol) |
52 Wk Hi
% From Hi |
Featured
Date |
Price
Featured |
Pivot Featured |
|
Max Buy |
CELG
-
NASDAQ
Celgene Corp
DRUGS - Drug Manufacturers - Major
|
$164.90
|
-0.62
-0.37% |
$166.85
|
2,702,048
93.82% of 50 DAV
50 DAV is 2,880,100
|
$173.80
-5.12%
|
9/12/2013
|
$149.50
|
PP = $150.02
|
|
MB = $157.52
|
Most Recent Note - 12/11/2013 6:00:39 PM
G - Retreated from its 52-week and all-time highs with today's loss after 5 consecutive gains. Prior highs in the $161 area define initial support to watch above its 50 DMA line.
>>> FEATURED STOCK ARTICLE : Cooling Volume Totals While Hovering Near Highs - 12/4/2013
View all notes |
Set NEW NOTE alert |
CANSLIM.net Company Profile |
SEC
News |
Chart |
Request a new note
C
A N
S L
I M


|
EGOV
-
NASDAQ
N I C Inc
INTERNET - Internet Software and Services
|
$22.49
|
-0.40
-1.75% |
$23.11
|
324,955
115.56% of 50 DAV
50 DAV is 281,200
|
$25.99
-13.47%
|
10/18/2013
|
$25.17
|
PP = $23.66
|
|
MB = $24.84
|
 Most Recent Note - 12/13/2013 5:50:36 PM
G - Slumped below its 50 DMA line this week with a streak of 5 consecutive losses raising concerns. Only a prompt rebound above that important short-term average would help its outlook improve. Disciplined investors always limit losses by selling any stock that falls more than -7% from their purchase price.
>>> FEATURED STOCK ARTICLE : Finding Support Near 50-Day Average During Distributional Pressure - 11/25/2013
View all notes |
Set NEW NOTE alert |
CANSLIM.net Company Profile |
SEC
News |
Chart |
Request a new note
C
A N
S L
I M
|
EQM
-
NYSE
E Q T Midstream Partners
ENERGY - Oil and Gas Pipelines
|
$54.40
|
+1.25
2.35% |
$54.69
|
158,690
123.21% of 50 DAV
50 DAV is 128,800
|
$56.41
-3.56%
|
12/12/2013
|
$53.17
|
PP = $56.51
|
|
MB = $59.34
|
Most Recent Note - 12/13/2013 5:48:19 PM
Y - Rallying from support at its 50 DMA line and prior highs in the $51 area after highlighted in yellow in the 12/12/13 mid-day report with new pivot point cited based on its 11/18/13 high plus 10 cents. Subsequent volume-driven gains for new highs are needed to trigger a proper technical buy signal. See the latest FSU analysis for more details and a new annotated graph.
>>> FEATURED STOCK ARTICLE : Finding Support Near 50-Day Moving Average While Perched Near Highs - 12/13/2013
View all notes |
Set NEW NOTE alert |
CANSLIM.net Company Profile |
SEC
News |
Chart |
Request a new note
C
A N
S L
I M
|
FB
-
NASDAQ
Facebook Inc Cl A
INTERNET
|
$53.32
|
+1.49
2.87% |
$53.50
|
82,517,555
110.83% of 50 DAV
50 DAV is 74,451,500
|
$54.83
-2.75%
|
12/12/2013
|
$51.40
|
PP = $54.93
|
|
MB = $57.68
|
Most Recent Note - 12/12/2013 5:00:04 PM
Y - Posted a gain today with +25% above average volume while rallying further above its 50 DMA line, still working on a 9-week cup shaped base. Highlighted in yellow with pivot point cited based on its 10/18/13 high plus 10 cents in the earlier mid-day report (read here). Disciplined investors may watch for subsequent volume-driven gains above its pivot point which are necessary to trigger a proper technical buy signal. Reported earnings +108% on +60% sales revenues for the Sep '13 quarter versus the year ago period, its 2nd quarterly comparison with earnings above the +25% minimum. Sequential acceleration in quarterly sales and earnings increases helps it look like a better match with the fact-based investment system's winning models. See the latest FSU analysis for more details and a new annotated graph.
>>> FEATURED STOCK ARTICLE : Well Known Social Media Firm on Watch List While Still Base Building - 12/12/2013
View all notes |
Set NEW NOTE alert |
CANSLIM.net Company Profile |
SEC
News |
Chart |
Request a new note
C
A N
S L
I M
|
FLT
-
NYSE
Fleetcor Technologies
DIVERSIFIED SERVICES - Business/Management Services
|
$118.12
|
+1.53
1.31% |
$118.51
|
506,693
59.30% of 50 DAV
50 DAV is 854,500
|
$123.96
-4.71%
|
8/19/2013
|
$99.01
|
PP = $100.97
|
|
MB = $106.02
|
Most Recent Note - 12/12/2013 5:48:00 PM
G - Slumping toward its 50 DMA line since gapping down on 12/06/13 while retreating from all-time highs. A subsequent violation of that important near-term support level may trigger a technical sell signal.
>>> FEATURED STOCK ARTICLE : Perched Near All-Time High Tallying Quiet Gains - 11/13/2013
View all notes |
Set NEW NOTE alert |
CANSLIM.net Company Profile |
SEC
News |
Chart |
Request a new note
C
A N
S L
I M
|
Symbol/Exchange
Company Name
Industry Group |
PRICE |
CHANGE
(%Change) |
Day High |
Volume
(% DAV)
(% 50 day avg vol) |
52 Wk Hi
% From Hi |
Featured
Date |
Price
Featured |
Pivot Featured |
|
Max Buy |
GNRC
-
NYSE
Generac Hldgs Inc
CONSUMER DURABLES - Electronic Equipment
|
$51.98
|
-0.54
-1.03% |
$52.88
|
370,232
44.96% of 50 DAV
50 DAV is 823,500
|
$54.00
-3.74%
|
11/26/2013
|
$53.02
|
PP = $52.42
|
|
MB = $55.04
|
Most Recent Note - 12/12/2013 5:49:21 PM
Y - Hovering near its 52-week high, still quietly consolidating above prior highs in the $52 area defining initial support to watch.
>>> FEATURED STOCK ARTICLE : Following Latest Breakout Prior Highs Define Support - 11/29/2013
View all notes |
Set NEW NOTE alert |
CANSLIM.net Company Profile |
SEC
News |
Chart |
Request a new note
C
A N
S L
I M
|
HLF
-
NYSE
Herbalife Ltd
DRUGS - Nutrition and Weight Management
|
$68.38
|
-0.22
-0.32% |
$69.28
|
1,746,680
68.72% of 50 DAV
50 DAV is 2,541,800
|
$77.39
-11.64%
|
11/22/2013
|
$72.21
|
PP = $75.04
|
|
MB = $78.79
|
Most Recent Note - 12/11/2013 5:13:51 PM
Y - Its 50 DMA line (now $67.10) defines near-term support to watch. Slumped back into its prior base with higher volume Friday indicative of distributional pressure, and it fell further today with light volume. Stalled after volume-driven gains helped it rally above its pivot point to trigger a technical buy signal last week.
>>> FEATURED STOCK ARTICLE : Perched Near Highs Following Rebound - 11/22/2013
View all notes |
Set NEW NOTE alert |
CANSLIM.net Company Profile |
SEC
News |
Chart |
Request a new note
C
A N
S L
I M
|
JAZZ
-
NASDAQ
Jazz Pharmaceuticals Plc
DRUGS - Biotechnology
|
$114.53
|
-0.86
-0.75% |
$115.99
|
568,732
73.64% of 50 DAV
50 DAV is 772,300
|
$121.15
-5.46%
|
9/30/2013
|
$93.20
|
PP = $89.10
|
|
MB = $93.56
|
Most Recent Note - 12/11/2013 6:03:09 PM
G - Retreated from its 52-week high hit on the prior session. It is extended from any sound base and well above support at its 50 DMA line (now $99.45).
>>> FEATURED STOCK ARTICLE : Technically Extended Stock May Be a Dangerous Chase - 12/10/2013
View all notes |
Set NEW NOTE alert |
CANSLIM.net Company Profile |
SEC
News |
Chart |
Request a new note
C
A N
S L
I M
|
KORS
-
NYSE
Michael Kors Hldgs Ltd
RETAIL - Apparel Stores
|
$82.27
|
-0.38
-0.46% |
$83.91
|
4,186,412
91.81% of 50 DAV
50 DAV is 4,559,800
|
$83.13
-1.04%
|
8/6/2013
|
$69.66
|
PP = $66.28
|
|
MB = $69.59
|
Most Recent Note - 12/12/2013 5:51:31 PM
G - Rallied toward its 52-week high for a best-ever close with near average volume behind today's gain. Prior highs in the $78 area define near-term support coinciding with its 50 DMA line.
>>> FEATURED STOCK ARTICLE : Consolidation Too Brief To Note New Pivot - 12/6/2013
View all notes |
Set NEW NOTE alert |
CANSLIM.net Company Profile |
SEC
News |
Chart |
Request a new note
C
A N
S L
I M
|
PCLN
-
NASDAQ
Priceline.Com Inc
INTERNET - Internet Software and Services
|
$1,171.27
|
-3.97
-0.34% |
$1,182.05
|
485,284
77.51% of 50 DAV
50 DAV is 626,100
|
$1,198.75
-2.29%
|
9/13/2013
|
$966.82
|
PP = $995.08
|
|
MB = $1,044.83
|
Most Recent Note - 12/11/2013 5:58:50 PM
G - Still hovering at its 52-week high. It may go on to produce more climactic gains but is currently extended from any sound base pattern. Reported earnings +40% on +33% sales revenues for the Sep '13 quarter versus the year-ago period, improving after a slightly sub par Jun '13 report.
>>> FEATURED STOCK ARTICLE : Extended From Any Sound Base Pattern - 12/3/2013
View all notes |
Set NEW NOTE alert |
CANSLIM.net Company Profile |
SEC
News |
Chart |
Request a new note
C
A N
S L
I M
|
Symbol/Exchange
Company Name
Industry Group |
PRICE |
CHANGE
(%Change) |
Day High |
Volume
(% DAV)
(% 50 day avg vol) |
52 Wk Hi
% From Hi |
Featured
Date |
Price
Featured |
Pivot Featured |
|
Max Buy |
SFUN
-
NYSE
Soufun Hldgs Ltd Ads A
INTERNET - Internet Information Providers
|
$73.28
|
+1.46
2.03% |
$74.35
|
993,245
67.38% of 50 DAV
50 DAV is 1,474,200
|
$77.45
-5.38%
|
10/17/2013
|
$58.02
|
PP = $53.87
|
|
MB = $56.56
|
Most Recent Note - 12/11/2013 5:15:22 PM
G - Volume was light behind today's loss while still consolidating from its all-time high hit last week. It is extended from any sound base pattern yet may produce more climactic gains. Prior highs and its 50 DMA line coincide in the $59 area defining important support to watch.
>>> FEATURED STOCK ARTICLE : Extended From Base Yet May Produce More Climactic Gains - 12/9/2013
View all notes |
Set NEW NOTE alert |
CANSLIM.net Company Profile |
SEC
News |
Chart |
Request a new note
C
A N
S L
I M
|
SSNC
-
NASDAQ
S S & C Technologies
COMPUTER SOFTWARE and SERVICES - Application Software
|
$39.39
|
-0.06
-0.15% |
$40.50
|
511,803
164.09% of 50 DAV
50 DAV is 311,900
|
$43.80
-10.07%
|
10/22/2013
|
$39.17
|
PP = $40.04
|
|
MB = $42.04
|
Most Recent Note - 12/13/2013 12:17:14 PM
G - Color code was changed to green and today's 6th consecutive loss with higher volume has it trading even further below its 50 DMA line after triggering a technical sell signal. Only a prompt rebound above that short-term average would help its outlook improve.
>>> FEATURED STOCK ARTICLE : Volume Totals Cooling Following Recent Volume-Driven Breakout - 11/12/2013
View all notes |
Set NEW NOTE alert |
CANSLIM.net Company Profile |
SEC
News |
Chart |
Request a new note
C
A N
S L
I M
|
SSYS
-
NASDAQ
Stratasys Ltd
COMPUTER HARDWARE - Computer Peripherals
|
$119.99
|
+0.48
0.40% |
$122.90
|
718,172
60.40% of 50 DAV
50 DAV is 1,189,100
|
$134.00
-10.46%
|
10/11/2013
|
$102.94
|
PP = $105.38
|
|
MB = $110.65
|
Most Recent Note - 12/10/2013 4:40:00 PM
G - Still quietly consolidating well above support at its 50 DMA line. More damaging losses would raise greater concerns and trigger worrisome technical sell signals. Previously noted with caution - "Reported earnings +13% on +153% sales revenues, below the +25% minimum earnings guideline (C criteria) raising fundamental concerns."
>>> FEATURED STOCK ARTICLE : Rallying For New Highs Despite Fundamental Flaw Raising Concern - 11/18/2013
View all notes |
Set NEW NOTE alert |
CANSLIM.net Company Profile |
SEC
News |
Chart |
Request a new note
C
A N
S L
I M
|
ULTI
-
NASDAQ
Ultimate Software Group
INTERNET - Internet Software and Services
|
$147.67
|
+2.36
1.62% |
$149.06
|
152,539
107.35% of 50 DAV
50 DAV is 142,100
|
$162.88
-9.34%
|
10/16/2013
|
$142.95
|
PP = $151.18
|
|
MB = $158.74
|
Most Recent Note - 12/11/2013 5:56:22 PM
G - Color code is changed to green after violating its 50 DMA line and prior highs near $151 with today's 3rd consecutive loss triggering a technical sell signal. Only a prompt rebound above its 50 DMA line would help its outlook.
>>> FEATURED STOCK ARTICLE : Consolidating Above 50 DMA Line and Prior Highs Defining Support - 11/21/2013
View all notes |
Set NEW NOTE alert |
CANSLIM.net Company Profile |
SEC
News |
Chart |
Request a new note
C
A N
S L
I M
|
VRX
-
NYSE
Valeant Pharmaceuticals
DRUGS - Drug Manufacturers - Other
|
$106.83
|
+0.59
0.56% |
$107.16
|
798,070
70.62% of 50 DAV
50 DAV is 1,130,100
|
$115.40
-7.42%
|
9/11/2013
|
$100.26
|
PP = $105.50
|
|
MB = $110.78
|
Most Recent Note - 12/11/2013 5:57:48 PM
G - Slumped below its 50 DMA line with higher but near average volume today and its color code is changed to green. Recent lows in the $102 area define near-term support where a violation may trigger a technical sell signal. Resilient after it reported earnings +24% on +74% sales revenues for the Sep '13 quarter, a notch below the +25% minimum guideline (C criteria).
>>> FEATURED STOCK ARTICLE : Recent Lows Define Support to Watch Below 50 Day Average - 11/15/2013
View all notes |
Set NEW NOTE alert |
CANSLIM.net Company Profile |
SEC
News |
Chart |
Request a new note
C
A N
S L
I M
|
Symbol/Exchange
Company Name
Industry Group |
PRICE |
CHANGE
(%Change) |
Day High |
Volume
(% DAV)
(% 50 day avg vol) |
52 Wk Hi
% From Hi |
Featured
Date |
Price
Featured |
Pivot Featured |
|
Max Buy |
YNDX
-
NASDAQ
Yandex N V Class A
INTERNET - Internet Information Providers
|
$38.21
|
+0.05
0.13% |
$39.06
|
2,743,478
98.90% of 50 DAV
50 DAV is 2,774,100
|
$42.00
-9.02%
|
11/27/2013
|
$39.61
|
PP = $42.10
|
|
MB = $44.21
|
Most Recent Note - 12/12/2013 1:09:11 PM
G - Rebounding near its 50 DMA line with a solid gain backed by above average volume today. On the prior session it violated its 50 DMA line triggering a technical sell signal and it was noted - "Only a prompt rebound above its 50 DMA line would help its outlook improve. Challenged its 52-week high recently but did not produce the required volume-driven gains above the pivot point to trigger a proper new technical buy signal."
>>> FEATURED STOCK ARTICLE : Forming New Base Pattern With Little Resistance Remaining - 11/27/2013
View all notes |
Set NEW NOTE alert |
CANSLIM.net Company Profile |
SEC
News |
Chart |
Request a new note
C
A N
S L
I M
|
|
|
|
THESE ARE NOT BUY RECOMMENDATIONS!
Comments contained in the body of this report are technical
opinions only. The material herein has been obtained
from sources believed to be reliable and accurate, however,
its accuracy and completeness cannot be guaranteed.
This site is not an investment advisor, hence it does
not endorse or recommend any securities or other investments.
Any recommendation contained in this report may not
be suitable for all investors and it is not to be deemed
an offer or solicitation on our part with respect to
the purchase or sale of any securities. All trademarks,
service marks and trade names appearing in this report
are the property of their respective owners, and are
likewise used for identification purposes only.
This report is a service available
only to active Paid Premium Members.
You may opt-out of receiving report notifications
at any time. Questions or comments may be submitted
by writing to Premium Membership Services 665 S.E. 10 Street, Suite 201 Deerfield Beach, FL 33441-5634 or by calling 1-800-965-8307
or 954-785-1121.
|
|
|

