You are not logged in.
This means you
CAN ONLY VIEW reports that were published prior to Monday, April 14, 2025.
You
MUST UPGRADE YOUR MEMBERSHIP if you want to see any current reports.
AFTER MARKET UPDATE - THURSDAY, DECEMBER 13TH, 2012
Previous After Market Report Next After Market Report >>>
|
|
|
|
DOW |
-74.73 |
13,170.72 |
-0.56% |
|
Volume |
663,186,330 |
-5% |
|
Volume |
1,779,076,070 |
+5% |
|
NASDAQ |
-21.65 |
2,992.16 |
-0.72% |
|
Advancers |
911 |
29% |
|
Advancers |
929 |
36% |
|
S&P 500 |
-9.03 |
1,419.45 |
-0.63% |
|
Decliners |
2,120 |
67% |
|
Decliners |
1,546 |
60% |
|
Russell 2000 |
-5.19 |
824.20 |
-0.63% |
|
52 Wk Highs |
48 |
|
|
52 Wk Highs |
39 |
|
|
S&P 600 |
-2.74 |
462.36 |
-0.59% |
|
52 Wk Lows |
28 |
|
|
52 Wk Lows |
34 |
|
|
 |
Breadth Negative as Major Averages Pulled Back
Kenneth J. Gruneisen - Passed the CAN SLIM® Master's Exam
The major averages lost ground on Thursday while the volume totals were again reported mixed, slightly higher than the prior session on the Nasdaq exchange but lower on the NYSE. Breadth was negative as decliners led advancers by more than a 2-1 margin on the NYSE and by a 3-2 margin on the Nasdaq exchange. The total number of stocks hitting new 52-week highs still outnumbered new 52-week lows on the NYSE and on the Nasdaq exchange. There were 16 high-ranked companies from the CANSLIM.net Leaders List making new 52-week highs and appearing on the CANSLIM.net BreakOuts Page, down from the prior session total of 47 stocks. Any sustainable rally requires a healthy crop of companies hitting new 52-week highs, so it remains important to see meaningful leadership. However, coupled with waning leadership, there were losses for 12 of the 13 high-ranked companies currently included on the Featured Stocks Page, disconcertingly more negative than the broader market's bias.
Stocks gave up ground amid stalled budget negotiations. The fiscal cliff concerns intensified after House Speaker Boehner said President Obama is not serious about cutting spending. The political wrangling overshadowed a batch of economic data. Initial jobless claims dropped to the lowest level since early October as applications fell by 29,000 to 343,000. In a separate report, retail sales rose by 0.3% in November thanks to holiday shopping and a rebound in auto sales. Meanwhile, the producer price index declined by the most since May and business inventories climbed at a slower pace in October.
Overall, nearly all sectors were lower. Energy and healthcare stocks were among the leading decliners with Halliburton Co (HAL -1.59%) and Merck & Co (MRK -1.96%) both slumping. SolarCity Corp (SCTY +47.38%) received a warm welcome after its IPO price was substantially reduced from the planned price range.
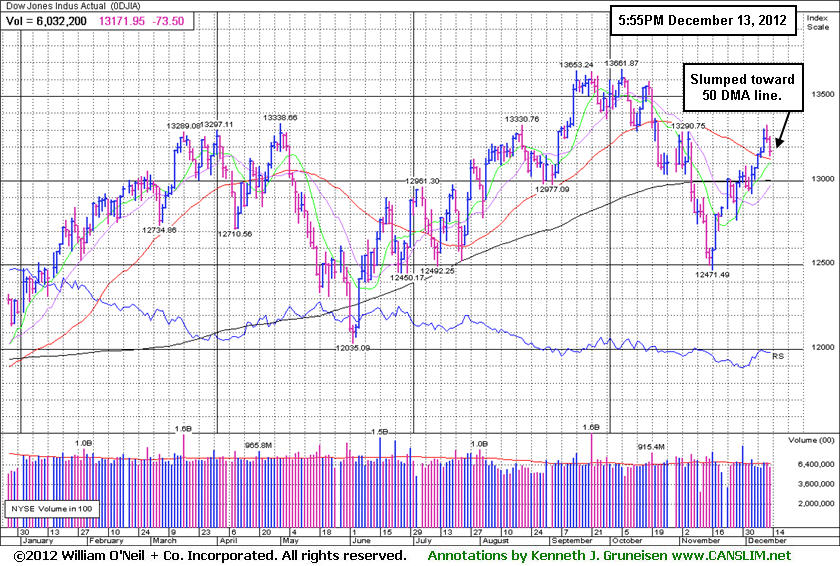
The Nasdaq Composite Index slipped under its 50-day moving average (DMA) line today, however the Dow Jones Industrial Average and the S&P 500 Index remain consolidating above their respective 50-day moving average (DMA) lines in healthy shape, technically, and the market direction (M criteria) remains in a "confirmed uptrend". New buying efforts may be justified only in worthy high-ranked leaders. See the noteworthy companies included on the Featured Stocks Page.
Watch for an announcement via email concerning the next WEBCAST. The webcast will also be available via an updated link highlighted at the top of the Premium Member Homepage.
PICTURED: The Dow Jones Industrial Average slumped toward its 50 DMA line, finishing -3.6% off its 2012 high.
|
 Kenneth J. Gruneisen started out as a licensed stockbroker in August 1987, a couple of months prior to the historic stock market crash that took the Dow Jones Industrial Average down -22.6% in a single day. He has published daily fact-based fundamental and technical analysis on high-ranked stocks online for two decades. Through FACTBASEDINVESTING.COM, Kenneth provides educational articles, news, market commentary, and other information regarding proven investment systems that work in good times and bad.
Comments contained in the body of this report are technical opinions only and are not necessarily those of Gruneisen Growth Corp. The material herein has been obtained from sources believed to be reliable and accurate, however, its accuracy and completeness cannot be guaranteed. Our firm, employees, and customers may effect transactions, including transactions contrary to any recommendation herein, or have positions in the securities mentioned herein or options with respect thereto. Any recommendation contained in this report may not be suitable for all investors and it is not to be deemed an offer or solicitation on our part with respect to the purchase or sale of any securities. |
|
 |
Commodity-Linked Groups and Tech Sector Led Losses
Kenneth J. Gruneisen - Passed the CAN SLIM® Master's Exam
The Gold & Silver Index ($XAU -2.47%) was a standout decliner on Thursday as it erased the prior session's big gain. Weakness in energy-related shares dragged the Oil Services Index ($OSX -1.66%) and the Integrated Oil Index ($XOI -0.71%) lower. The Biotechnology Index ($BTK -1.12%) and Semiconductor Index ($SOX -1.05%) led the tech sector lower while the Internet Index ($IIX -0.22%) ended with a smaller loss, yet the Networking Index ($NWX +0.32%) eked out a small gain. Financial shares were mixed as the Broker/Dealer Index ($XBD +0.28%) posted a small gain while the Bank Index ($BKX -0.58%) edged lower. The Retail Index ($RLX -0.20%) and Healthcare Index ($HMO -0.30%) rounded out the mostly negative session with small losses.
Charts courtesy www.stockcharts.com
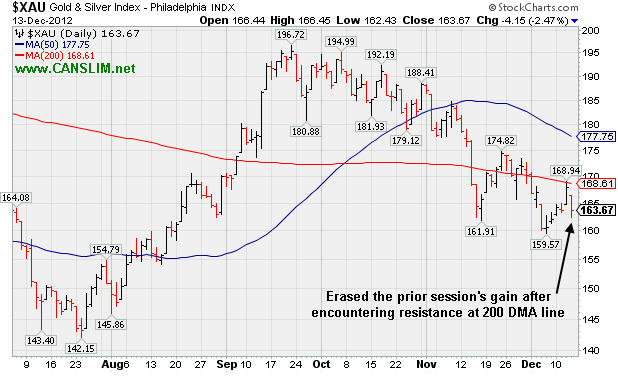
PICTURED: The Gold & Silver Index ($XAU -2.47%) was a standout decliner as it erased the prior session's gain after encountering resistance at its 200-day moving average (DMA) line.
| Oil Services |
$OSX |
216.91 |
-3.66 |
-1.66% |
+0.29% |
| Healthcare |
$HMO |
2,565.93 |
-7.72 |
-0.30% |
+12.46% |
| Integrated Oil |
$XOI |
1,232.76 |
-8.80 |
-0.71% |
+0.30% |
| Semiconductor |
$SOX |
383.67 |
-4.07 |
-1.05% |
+5.28% |
| Networking |
$NWX |
216.96 |
+0.68 |
+0.32% |
+0.84% |
| Internet |
$IIX |
325.52 |
-0.72 |
-0.22% |
+15.54% |
| Broker/Dealer |
$XBD |
88.17 |
+0.24 |
+0.28% |
+5.88% |
| Retail |
$RLX |
655.35 |
-1.30 |
-0.20% |
+25.26% |
| Gold & Silver |
$XAU |
163.67 |
-4.15 |
-2.47% |
-9.39% |
| Bank |
$BKX |
49.42 |
-0.29 |
-0.58% |
+25.50% |
| Biotech |
$BTK |
1,544.11 |
-17.46 |
-1.12% |
+41.48% |
|
|
|
 |
Still Forming New Base Awaiting Fresh Technical Breakout
Kenneth J. Gruneisen - Passed the CAN SLIM® Master's Exam
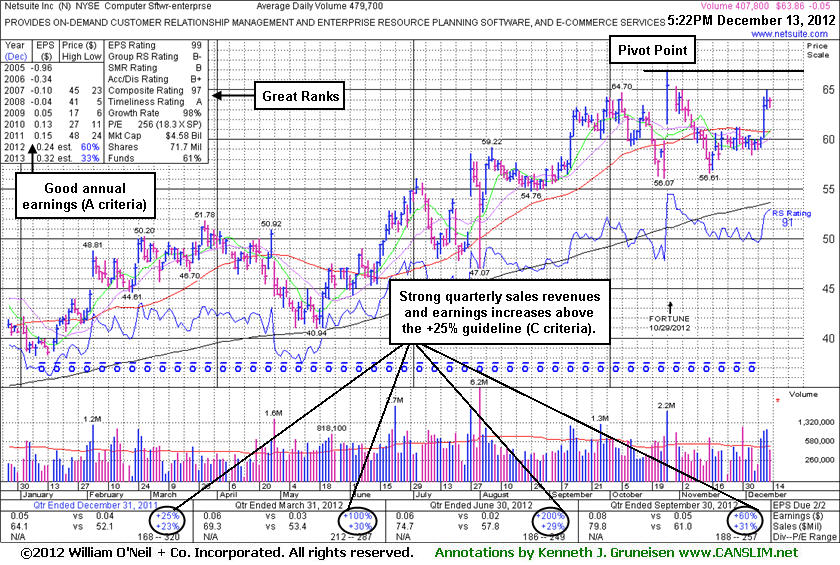
Netsuite Inc (N -$0.05 or -0.08% to $63.86) was highlighted in yellow in the 12/12/12 mid-day report with a new pivot point cited based on its 10/26/12 high plus 10 cents (read here). Its fundamentals (C and A criteria) remain strong and it has been resilient since dropped from the Featured Stocks list on 11/15/12. It rallied above its 50-day moving average (DMA) line with 3 consecutive volume-driven gains this week while working up toward prior highs. However, it still faces resistance, and disciplined investors will watch for subsequent volume-driven gains above the pivot point which may trigger a technical buy signal before taking action.
It was last shown in this FSU section on 10/26/12 with an annotated graph under the headline, "Sputtering Software Firm Rebounds for New 52-Week High Following Earnings", as it gapped up from below its 50-day moving average(DMA) line and blasted to new 52-week and all-time highs, however, it stalled afterward. The high-ranked Computer Software -Enterprise firm reported earnings +60% on +31% sales revenues for the quarter ended September 30, 2012 versus the year ago period. Earnings above the +25% guideline (C criteria) in the 5 latest quarterly comparisons through Sep '12. Its annual earnings (A criteria) history improved from losses prior to FY '09. The number of top-rated funds owning its shares rose from 201 in Jun '11 to 275 in Sep '12, a reassuring sign concerning the I criteria. The Computer Software -Enterprise group has a Group Relative Strength Rating of B-, a reassuring sign concerning the L criteria.
Disciplined investors always limit losses by selling if any stock falls more than -7% from their purchase price. If a stock strengthens after it is sold it can always be bought back, but following strict selling rules is what keeps an investor from letting small losses become large losses. In a bullish market environment, leading stocks often flash numerous buy signals from multiple-bases.
|
|
|
Color Codes Explained :
Y - Better candidates highlighted by our
staff of experts.
G - Previously featured
in past reports as yellow but may no longer be buyable under the
guidelines.
***Last / Change / Volume data in this table is the closing quote data***
Symbol/Exchange
Company Name
Industry Group |
PRICE |
CHANGE
(%Change) |
Day High |
Volume
(% DAV)
(% 50 day avg vol) |
52 Wk Hi
% From Hi |
Featured
Date |
Price
Featured |
Pivot Featured |
|
Max Buy |
CELG
-
NASDAQ
Celgene Corp
DRUGS - Drug Manufacturers - Major
|
$79.84
|
-1.35
-1.66% |
$81.28
|
2,873,551
103.41% of 50 DAV
50 DAV is 2,778,700
|
$82.78
-3.55%
|
12/11/2012
|
$82.24
|
PP = $81.34
|
|
MB = $85.41
|
Most Recent Note - 12/12/2012 6:50:26 PM
Y - Pulled back today and finished just below its pivot point. Triggered a technical buy signal on the prior session. Disciplined investors always limit losses if any stock falls -7% from their purchase price. See the latest FSU analysis for more details and a new annotated graph.
>>> The latest Featured Stock Update with an annotated graph appeared on 12/12/2012. Click here.
View all notes |
Alert me of new notes |
CANSLIM.net Company Profile |
SEC |
Zacks Reports |
StockTalk |
News |
Chart |
Request a new note
C
A N
S L
I M


|
CFNL
-
NASDAQ
Cardinal Financial Corp
BANKING - Regional - Southeast Banks
|
$15.80
|
+0.07
0.45% |
$15.90
|
74,025
36.39% of 50 DAV
50 DAV is 203,400
|
$16.21
-2.53%
|
12/3/2012
|
$15.20
|
PP = $16.31
|
|
MB = $17.13
|
Most Recent Note - 12/11/2012 6:33:40 PM
Y - Traded above average volume today, but the gain was not big enough to help it rally above its pivot point to trigger a proper new (or add-on) technical buy signal.
>>> The latest Featured Stock Update with an annotated graph appeared on 12/10/2012. Click here.
View all notes |
Alert me of new notes |
CANSLIM.net Company Profile |
SEC |
Zacks Reports |
StockTalk |
News |
Chart |
Request a new note
C
A N
S L
I M
|
CMCSA
-
NASDAQ
Comcast Corp Cl A
MEDIA - CATV Systems
|
$36.94
|
-0.48
-1.28% |
$37.56
|
10,663,473
90.87% of 50 DAV
50 DAV is 11,734,400
|
$37.96
-2.69%
|
12/3/2012
|
$37.08
|
PP = $38.06
|
|
MB = $39.96
|
Most Recent Note - 12/12/2012 1:02:24 PM
Y - Perched only -0.8% off its 52-week high today, quietly wedging higher without great volume conviction. Disciplined investors will watch for gains above the pivot point backed by at least the bare minimum +40% above average volume threshold to trigger a proper new (or add-on) technical buy signal before taking action.
>>> The latest Featured Stock Update with an annotated graph appeared on 12/7/2012. Click here.
View all notes |
Alert me of new notes |
CANSLIM.net Company Profile |
SEC |
Zacks Reports |
StockTalk |
News |
Chart |
Request a new note
C
A N
S L
I M
|
LKQ
-
NASDAQ
L K Q Corp
WHOLESALE - Auto Parts
|
$20.93
|
-0.33
-1.55% |
$21.44
|
1,623,201
75.69% of 50 DAV
50 DAV is 2,144,500
|
$22.29
-6.08%
|
8/9/2012
|
$18.97
|
PP = $18.72
|
|
MB = $19.66
|
Most Recent Note - 12/11/2012 6:25:18 PM
G - Volume totals have been cooling while consolidating. Previously noted a worrisome "negative reversal" on 11/26/12 followed by additional losses on above average volume. Results below the +25% minimum earnings guideline (C criteria) for Sep '12 recently raised fundamental concerns.
>>> The latest Featured Stock Update with an annotated graph appeared on 11/30/2012. Click here.
View all notes |
Alert me of new notes |
CANSLIM.net Company Profile |
SEC |
Zacks Reports |
StockTalk |
News |
Chart |
Request a new note
C
A N
S L
I M
|
MIDD
-
NASDAQ
Middleby Corp
MANUFACTURING - Diversified Machinery
|
$127.16
|
-0.08
-0.06% |
$129.48
|
88,341
114.88% of 50 DAV
50 DAV is 76,900
|
$129.99
-2.18%
|
10/8/2012
|
$118.46
|
PP = $122.67
|
|
MB = $128.80
|
Most Recent Note - 12/11/2012 7:00:05 PM
G - Color code is changed to green after a volume-driven gain today above its "max buy" level. Earnings +23% on +18% sales for the Sep '12 quarter, below the +25% minimum earnings guideline (C criteria), raised concerns.
>>> The latest Featured Stock Update with an annotated graph appeared on 12/6/2012. Click here.
View all notes |
Alert me of new notes |
CANSLIM.net Company Profile |
SEC |
Zacks Reports |
StockTalk |
News |
Chart |
Request a new note
C
A N
S L
I M
|
Symbol/Exchange
Company Name
Industry Group |
PRICE |
CHANGE
(%Change) |
Day High |
Volume
(% DAV)
(% 50 day avg vol) |
52 Wk Hi
% From Hi |
Featured
Date |
Price
Featured |
Pivot Featured |
|
Max Buy |
N
-
NYSE
Netsuite Inc
DIVERSIFIED SERVICES - Business/Management Services
|
$63.86
|
-0.05
-0.08% |
$64.21
|
407,883
85.03% of 50 DAV
50 DAV is 479,700
|
$67.02
-4.72%
|
12/12/2012
|
$64.75
|
PP = $67.12
|
|
MB = $70.48
|
 Most Recent Note - 12/13/2012 5:36:00 PM
Y - Fundamentals (C and A criteria) remain strong and it was highlighted in yellow with new pivot point cited based on its 10/26/12 high plus 10 cents. Disciplined investors will watch for subsequent volume-driven gains above the pivot point which may trigger a technical buy signal before taking action. See the latest FSU analysis for more details and a new annotated graph.
>>> The latest Featured Stock Update with an annotated graph appeared on 12/13/2012. Click here.
View all notes |
Alert me of new notes |
CANSLIM.net Company Profile |
SEC |
Zacks Reports |
StockTalk |
News |
Chart |
Request a new note
C
A N
S L
I M
|
NSR
-
NYSE
Neustar Inc
TELECOMMUNICATIONS - Diversified Communication Serv
|
$42.12
|
-0.22
-0.52% |
$42.77
|
333,516
95.62% of 50 DAV
50 DAV is 348,800
|
$43.29
-2.70%
|
12/11/2012
|
$41.85
|
PP = $41.41
|
|
MB = $43.48
|
Most Recent Note - 12/12/2012 12:40:43 PM
Y - Off earlier highs after rallying near its "max buy" level today. Its strong finish on heavy volume clinched a technical buy signal on the prior session as it hit new 52-week highs and rallied from a 10-week base. Quarterly comparisons through Sep '12 showed 3 consecutive increases of more than the +25% minimum earnings guideline (C criteria). See the latest FSU analysis for more details and a new annotated graph.
>>> The latest Featured Stock Update with an annotated graph appeared on 12/11/2012. Click here.
View all notes |
Alert me of new notes |
CANSLIM.net Company Profile |
SEC |
Zacks Reports |
StockTalk |
News |
Chart |
Request a new note
C
A N
S L
I M
|
RAX
-
NYSE
Rackspace Hosting Inc
INTERNET - Internet Software and; Services
|
$67.03
|
-0.82
-1.21% |
$68.60
|
1,030,291
68.70% of 50 DAV
50 DAV is 1,499,600
|
$70.00
-4.24%
|
11/26/2012
|
$66.26
|
PP = $67.18
|
|
MB = $70.54
|
Most Recent Note - 12/12/2012 1:06:25 PM
Y - Still quietly perched -2.6% off its 52-week high today, holding its ground just above its pivot point. Previously noted - "Confirming gains above its pivot point with at least +40% above average volume would be a welcome reassurance. Disciplined investors may be wise to use a tactic called 'pyramiding' to allow the market action to dictate their weighting in new buys while always limiting losses by selling if any stock ever falls more than -7% from their purchase price."
>>> The latest Featured Stock Update with an annotated graph appeared on 11/27/2012. Click here.
View all notes |
Alert me of new notes |
CANSLIM.net Company Profile |
SEC |
Zacks Reports |
StockTalk |
News |
Chart |
Request a new note
C
A N
S L
I M
|
RGR
-
NYSE
Sturm Ruger & Co Inc
CONSUMER DURABLES - Sporting Goods
|
$47.73
|
-0.82
-1.69% |
$48.53
|
466,107
90.70% of 50 DAV
50 DAV is 513,900
|
$55.66
-14.24%
|
11/20/2012
|
$52.23
|
PP = $52.65
|
|
MB = $55.28
|
Most Recent Note - 12/11/2012 7:02:18 PM
G - Managed a positive reversal today after early weakness. The current pullback may be a high handle forming on its larger 7-month cup shaped base, but the volume is supposed to be light in the handle portion of a cup-with-handle base. Instead, it has been enduring distributional pressure in recent days since trading ex-dividend 12/05/12 following its previously noted $4.50/sh special dividend. Prior highs and its 50 DMA line define near-term chart support. Patience may allow for an ideal new base and breakout to be noted. See additional details in the article "Ken's Mailbag Q&A 12/10/12 - Challenges of when to lock in a profit or accumulate more shares"
>>> The latest Featured Stock Update with an annotated graph appeared on 11/21/2012. Click here.
View all notes |
Alert me of new notes |
CANSLIM.net Company Profile |
SEC |
Zacks Reports |
StockTalk |
News |
Chart |
Request a new note
C
A N
S L
I M
|
RNF
-
NYSE
Rentech Nitrogen Ptnr Lp
CHEMICALS - Agricultural Chemicals
|
$37.97
|
-0.83
-2.14% |
$39.00
|
335,549
98.34% of 50 DAV
50 DAV is 341,200
|
$41.15
-7.73%
|
11/1/2012
|
$39.11
|
PP = $40.15
|
|
MB = $42.16
|
Most Recent Note - 12/13/2012 1:00:48 PM
Y - Slumping near its 50 DMA line today with volume picking up while retreating from its 52-week high. Recent gains with below average volume indicated lackluster buying demand from the institutional crowd. Disciplined investors may watch for volume-driven gains for a new high close to trigger a technical buy signal.
>>> The latest Featured Stock Update with an annotated graph appeared on 11/26/2012. Click here.
View all notes |
Alert me of new notes |
CANSLIM.net Company Profile |
SEC |
Zacks Reports |
StockTalk |
News |
Chart |
Request a new note
C
A N
S L
I M
|
Symbol/Exchange
Company Name
Industry Group |
PRICE |
CHANGE
(%Change) |
Day High |
Volume
(% DAV)
(% 50 day avg vol) |
52 Wk Hi
% From Hi |
Featured
Date |
Price
Featured |
Pivot Featured |
|
Max Buy |
ULTA
-
NASDAQ
Ulta Salon Cosm & Frag
SPECIALTY RETAIL - Specialty Retail, Other
|
$94.25
|
-1.15
-1.21% |
$96.23
|
1,002,647
130.16% of 50 DAV
50 DAV is 770,300
|
$103.52
-8.95%
|
12/4/2012
|
$100.29
|
PP = $103.62
|
|
MB = $108.80
|
Most Recent Note - 12/11/2012 7:05:33 PM
Y - Damaging loss today on higher volume indicated distributional pressure against a mostly positive market backdrop, retreating from new its 52-week high. Disciplined investors will watch for volume-driven gains above the pivot point to trigger a new technical buy signal.
>>> The latest Featured Stock Update with an annotated graph appeared on 12/4/2012. Click here.
View all notes |
Alert me of new notes |
CANSLIM.net Company Profile |
SEC |
Zacks Reports |
StockTalk |
News |
Chart |
Request a new note
C
A N
S L
I M
|
VSI
-
NYSE
Vitamin Shoppe Inc
SPECIALTY RETAIL - Specialty Retail, Other
|
$56.52
|
-0.12
-0.21% |
$57.39
|
222,668
92.28% of 50 DAV
50 DAV is 241,300
|
$61.89
-8.68%
|
12/3/2012
|
$59.06
|
PP = $61.99
|
|
MB = $65.09
|
Most Recent Note - 12/13/2012 1:02:47 PM
G - Still sputtering below its 50 DMA line today. Technically, the longer it lingers below its important short-term average the worse its outlook gets. The $61 area has been a stubborn resistance level in recent months.
>>> The latest Featured Stock Update with an annotated graph appeared on 12/3/2012. Click here.
View all notes |
Alert me of new notes |
CANSLIM.net Company Profile |
SEC |
Zacks Reports |
StockTalk |
News |
Chart |
Request a new note
C
A N
S L
I M
|
WPI
-
NYSE
Watson Pharmaceuticals
DRUGS - Drugs - Generic
|
$88.16
|
-0.76
-0.85% |
$88.96
|
663,129
86.47% of 50 DAV
50 DAV is 766,900
|
$90.39
-2.47%
|
8/24/2012
|
$82.90
|
PP = $81.10
|
|
MB = $85.16
|
Most Recent Note - 12/11/2012 6:26:59 PM
G - Challenged its 52-week high today and finished at a best-ever close with a solid gain on slightly above average volume. No resistance remains due to overhead supply. Quarterly comparisons for sales revenues and earnings increases have shown sequential deceleration in its growth rate raising some fundamental concerns, as recently noted.
>>> The latest Featured Stock Update with an annotated graph appeared on 11/23/2012. Click here.
View all notes |
Alert me of new notes |
CANSLIM.net Company Profile |
SEC |
Zacks Reports |
StockTalk |
News |
Chart |
Request a new note
C
A N
S L
I M
|
|
|
|
THESE ARE NOT BUY RECOMMENDATIONS!
Comments contained in the body of this report are technical
opinions only. The material herein has been obtained
from sources believed to be reliable and accurate, however,
its accuracy and completeness cannot be guaranteed.
This site is not an investment advisor, hence it does
not endorse or recommend any securities or other investments.
Any recommendation contained in this report may not
be suitable for all investors and it is not to be deemed
an offer or solicitation on our part with respect to
the purchase or sale of any securities. All trademarks,
service marks and trade names appearing in this report
are the property of their respective owners, and are
likewise used for identification purposes only.
This report is a service available
only to active Paid Premium Members.
You may opt-out of receiving report notifications
at any time. Questions or comments may be submitted
by writing to Premium Membership Services 665 S.E. 10 Street, Suite 201 Deerfield Beach, FL 33441-5634 or by calling 1-800-965-8307
or 954-785-1121.
|
|
|

