You are not logged in.
This means you
CAN ONLY VIEW reports that were published prior to Monday, April 14, 2025.
You
MUST UPGRADE YOUR MEMBERSHIP if you want to see any current reports.
AFTER MARKET UPDATE - THURSDAY, DECEMBER 12TH, 2013
Previous After Market Report Next After Market Report >>>
|
|
|
|
DOW |
-104.10 |
15,739.43 |
-0.66% |
|
Volume |
740,155,270 |
+2% |
|
Volume |
1,761,483,370 |
-2% |
|
NASDAQ |
-5.41 |
3,998.40 |
-0.14% |
|
Advancers |
1,263 |
40% |
|
Advancers |
1,250 |
47% |
|
S&P 500 |
-6.72 |
1,775.50 |
-0.38% |
|
Decliners |
1,746 |
56% |
|
Decliners |
1,309 |
49% |
|
Russell 2000 |
+1.77 |
1,103.27 |
+0.16% |
|
52 Wk Highs |
32 |
|
|
52 Wk Highs |
46 |
|
|
S&P 600 |
+1.38 |
634.61 |
+0.22% |
|
52 Wk Lows |
268 |
|
|
52 Wk Lows |
46 |
|
|
 |
Major Averages Fell For Third Consecutive Session
Kenneth J. Gruneisen - Passed the CAN SLIM® Master's Exam
Stocks declined for the third straight session on Thursday. The volume totals were reported mixed, higher on the NYSE while volume was lighter on the Nasdaq exchange. Breadth was negative as decliners led advancers by nearly 3-2 on the NYSE and by a narrow margin on the Nasdaq exchange. There were 10 high-ranked companies from the CANSLIM.net Leaders List that made new 52-week highs and appeared on the CANSLIM.net BreakOuts Page, down from a total of 24 stocks on the prior session. The list of stocks hitting new 52-week highs matched new lows on the Nasdaq exchange, however new lows solidly outnumbered new highs on the NYSE. There were gains for 8 of the 16 high-ranked companies currently included on the Featured Stocks Page.
The major averages extended their recent losing streak as investors digested a batch of mixed economic data. Jobless claims unexpectedly rose more than anticipated to a two-month high of 368,000 and retail sales increased in November by the most in five months. Other data showed business inventories posted the largest advance in nine months and the import price index fell for the second consecutive month.
Overall, eight of the 10 S&P 500 sectors ended lower. The consumer staples sector was the worst performing group, led by Procter & Gamble's (PG -2.1%) decline. Johnson & Johnson (JNJ -2.1%) and Oracle (ORCL -2.9%) fell while losses in the health care and technology groups also weighed on the market. Energy paced the day's advancers as crude stockpiles dropped and Mexico opened its oil industry to private investment. Exxon Mobil Corp (XOM +1.3%) and Schlumberger (SLB +1%) rose.
NYSE Composite volume totaled more than 3.3 billion shares. On the NYSE, decliners beat advancers by 7-5 on issues and on volume. The NASDAQ was even on issues and 5-4 negative on volume.
Treasury prices declined for a second day. The 10-year note fell 7/32 to yield 2.88%. The 30-year bond lost 6/32 to yield 3.90%.
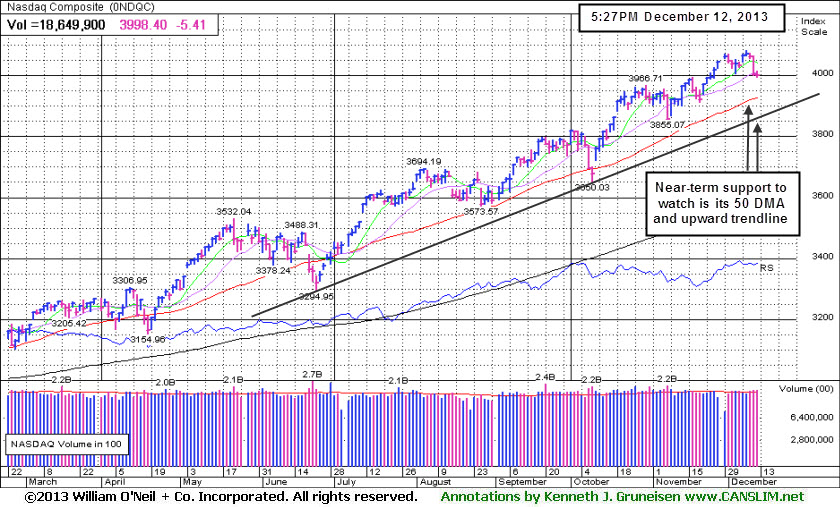
The Market (M criteria) rally has come under more worrisome distributional pressure while leadership (stocks hitting new highs) has waned. Any new buying efforts should be selective. The CANSLIM.net Featured Stocks Page shows the most action-worthy candidates and their latest notes and a new Headline Link directs members to the latest detailed analysis with data-packed graphs annotated by a Certified expert along with links to additional resources. The Premium Member Homepage - includes "dynamic archives" to all prior pay reports published. Watch for an announcement via email concerning the next WEBCAST.
PICTURED: The Nasdaq Composite Index is pulling back toward its 50-day moving average (DMA) line and upward trendline defining important support levels to watch.
|
 Kenneth J. Gruneisen started out as a licensed stockbroker in August 1987, a couple of months prior to the historic stock market crash that took the Dow Jones Industrial Average down -22.6% in a single day. He has published daily fact-based fundamental and technical analysis on high-ranked stocks online for two decades. Through FACTBASEDINVESTING.COM, Kenneth provides educational articles, news, market commentary, and other information regarding proven investment systems that work in good times and bad.
Comments contained in the body of this report are technical opinions only and are not necessarily those of Gruneisen Growth Corp. The material herein has been obtained from sources believed to be reliable and accurate, however, its accuracy and completeness cannot be guaranteed. Our firm, employees, and customers may effect transactions, including transactions contrary to any recommendation herein, or have positions in the securities mentioned herein or options with respect thereto. Any recommendation contained in this report may not be suitable for all investors and it is not to be deemed an offer or solicitation on our part with respect to the purchase or sale of any securities. |
|
 |
Financial Group Gains Partially Offset Other Losses
Kenneth J. Gruneisen - Passed the CAN SLIM® Master's Exam
Modest gains from financial stocks helped partially offset broader weakness as the Broker/Dealer Index ($XBD +0.33%) and the Bank Index ($BKX +0.45%) fell. The Retail Index ($RLX -0.35%) created a drag on the major averages and in the tech sector the Networking Index ($NWX -1.50%) and the Semiconductor Index ($SOX -0.85%) lost ground, meanwhile the Biotechnology Index ($BTK +0.93%) tallied a gain. Energy-related shares werer mixed as the Oil Services Index ($OSX +0.70%) posted a modest gain while the Integrated Oil Index ($XOI -0.18%) edged lower. The Gold & Silver Index ($XAU -1.27%) retreated again.
Charts courtesy www.stockcharts.com
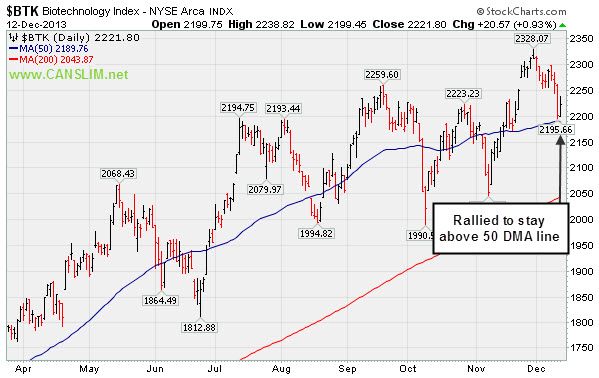
PICTURED: The Biotechnology Index ($BTK +0.93%) rallied to stay above its 50-day moving average (DMA) line.
| Oil Services |
$OSX |
272.93 |
+1.91 |
+0.70% |
+23.97% |
| Integrated Oil |
$XOI |
1,443.65 |
-2.59 |
-0.18% |
+16.25% |
| Semiconductor |
$SOX |
505.84 |
-4.33 |
-0.85% |
+31.71% |
| Networking |
$NWX |
301.89 |
-4.61 |
-1.50% |
+33.25% |
| Broker/Dealer |
$XBD |
153.21 |
+0.50 |
+0.33% |
+62.42% |
| Retail |
$RLX |
912.69 |
-3.22 |
-0.35% |
+39.76% |
| Gold & Silver |
$XAU |
81.78 |
-1.05 |
-1.27% |
-50.62% |
| Bank |
$BKX |
66.78 |
+0.30 |
+0.45% |
+30.23% |
| Biotech |
$BTK |
2,221.80 |
+20.57 |
+0.93% |
+43.62% |
|
|
|
 |
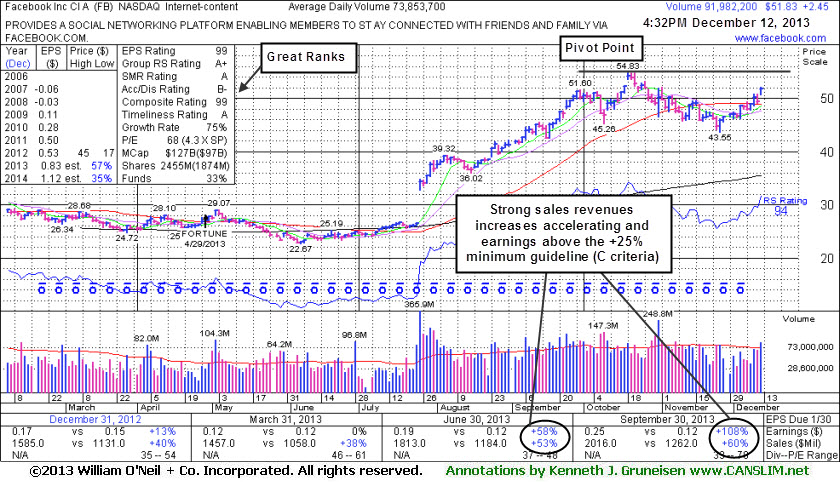
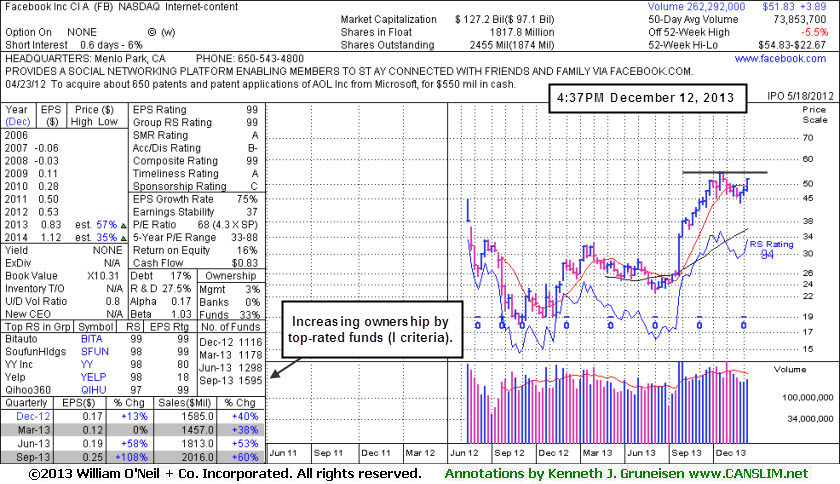
Well Known Social Media Firm on Watch List While Still Base Building
Kenneth J. Gruneisen - Passed the CAN SLIM® Master's Exam
Facebook Inc (FB +$2.45 or +4.96% to $51.83) posted a gain today with +25% above average volume and finished the session -5.5% off its 52-week high. It wedged back above its 50-day moving average (DMA) line this week with gains lacking great volume conviction while working on a 9-week cup shaped base. In today's mid-day report (read here) it was highlighted in yellow with a pivot point cited based on its 10/18/13 high plus 10 cents while noted with caution - "Disciplined investors may watch for subsequent volume-driven gains above its pivot point which are necessary to trigger a proper technical buy signal."
FB reported earnings +108% on +60% sales revenues for the Sep '13 quarter versus the year ago period, its 2nd quarterly comparison with earnings above the +25% minimum (C criteria). Sequential acceleration in quarterly sales and earnings increases helps it look like a better match with the fact-based investment system's winning models.
The number of top-rated funds owning its shares rose from 1,116 in Dec '12 to 1,595 in Sep '13, a reassuring sign concerning the I criteria. Keep in mind that its large supply of 1.87 billion shares in the public float makes it an unlikely sprinter, especially as it is already well known by the institutional crowd and the general public.
|
|
|
Color Codes Explained :
Y - Better candidates highlighted by our
staff of experts.
G - Previously featured
in past reports as yellow but may no longer be buyable under the
guidelines.
***Last / Change / Volume data in this table is the closing quote data***
Symbol/Exchange
Company Name
Industry Group |
PRICE |
CHANGE
(%Change) |
Day High |
Volume
(% DAV)
(% 50 day avg vol) |
52 Wk Hi
% From Hi |
Featured
Date |
Price
Featured |
Pivot Featured |
|
Max Buy |
CELG
-
NASDAQ
Celgene Corp
DRUGS - Drug Manufacturers - Major
|
$165.52
|
-0.53
-0.32% |
$168.32
|
2,120,238
73.78% of 50 DAV
50 DAV is 2,873,600
|
$173.80
-4.76%
|
9/12/2013
|
$149.50
|
PP = $150.02
|
|
MB = $157.52
|
Most Recent Note - 12/11/2013 6:00:39 PM
G - Retreated from its 52-week and all-time highs with today's loss after 5 consecutive gains. Prior highs in the $161 area define initial support to watch above its 50 DMA line.
>>> FEATURED STOCK ARTICLE : Cooling Volume Totals While Hovering Near Highs - 12/4/2013
View all notes |
Set NEW NOTE alert |
CANSLIM.net Company Profile |
SEC
News |
Chart |
Request a new note
C
A N
S L
I M


|
EGOV
-
NASDAQ
N I C Inc
INTERNET - Internet Software and Services
|
$22.89
|
-0.07
-0.30% |
$23.11
|
227,140
80.29% of 50 DAV
50 DAV is 282,900
|
$25.99
-11.93%
|
10/18/2013
|
$25.17
|
PP = $23.66
|
|
MB = $24.84
|
Most Recent Note - 12/9/2013 7:09:23 PM
G - Still holding its ground stubbonrly, consolidating in a tight range just above its 50 DMA line. Disciplined investors always limit losses by selling any stock that falls more than -7% from their purchase price.
>>> FEATURED STOCK ARTICLE : Finding Support Near 50-Day Average During Distributional Pressure - 11/25/2013
View all notes |
Set NEW NOTE alert |
CANSLIM.net Company Profile |
SEC
News |
Chart |
Request a new note
C
A N
S L
I M
|
EQM
-
NYSE
E Q T Midstream Partners
ENERGY - Oil and Gas Pipelines
|
$53.15
|
+0.37
0.70% |
$53.43
|
226,508
177.51% of 50 DAV
50 DAV is 127,600
|
$56.41
-5.78%
|
12/12/2013
|
$53.17
|
PP = $56.51
|
|
MB = $59.34
|
 Most Recent Note - 12/12/2013 12:39:54 PM
Y - Color code is changed to yellow with new pivot point cited based on its 11/18/13 high plus 10 cents. Subsequent volume-driven gains for new highs are needed to trigger a proper technical buy signal. Finding support at its 50 DMA line and near prior highs in the $51 area. Reported earnings +50% on +33% sales revenues for the Sep '13 quarter, continuing its strong earnings history (good C and A criteria). Completed a new Public Offering on 7/16/13 and made gradual progress afterward since dropped from the Featured Stocks list 7/10/13.
>>> FEATURED STOCK ARTICLE : Forming New Base While Awaiting New Confirmed Market Rally - 7/1/2013
View all notes |
Set NEW NOTE alert |
CANSLIM.net Company Profile |
SEC
News |
Chart |
Request a new note
C
A N
S L
I M
|
FB
-
NASDAQ
Facebook Inc Cl A
INTERNET
|
$51.83
|
+2.45
4.96% |
$52.07
|
92,481,997
125.22% of 50 DAV
50 DAV is 73,853,700
|
$54.83
-5.46%
|
12/12/2013
|
$51.40
|
PP = $54.93
|
|
MB = $57.68
|
Most Recent Note - 12/12/2013 5:00:04 PM
Y - Posted a gain today with +25% above average volume while rallying further above its 50 DMA line, still working on a 9-week cup shaped base. Highlighted in yellow with pivot point cited based on its 10/18/13 high plus 10 cents in the earlier mid-day report (read here). Disciplined investors may watch for subsequent volume-driven gains above its pivot point which are necessary to trigger a proper technical buy signal. Reported earnings +108% on +60% sales revenues for the Sep '13 quarter versus the year ago period, its 2nd quarterly comparison with earnings above the +25% minimum. Sequential acceleration in quarterly sales and earnings increases helps it look like a better match with the fact-based investment system's winning models. See the latest FSU analysis for more details and a new annotated graph.
>>> FEATURED STOCK ARTICLE : Well Known Social Media Firm on Watch List While Still Base Building - 12/12/2013
View all notes |
Set NEW NOTE alert |
CANSLIM.net Company Profile |
SEC
News |
Chart |
Request a new note
C
A N
S L
I M
|
FLT
-
NYSE
Fleetcor Technologies
DIVERSIFIED SERVICES - Business/Management Services
|
$116.59
|
-0.19
-0.16% |
$117.46
|
487,581
56.74% of 50 DAV
50 DAV is 859,300
|
$123.96
-5.95%
|
8/19/2013
|
$99.01
|
PP = $100.97
|
|
MB = $106.02
|
Most Recent Note - 12/12/2013 5:48:00 PM
G - Slumping toward its 50 DMA line since gapping down on 12/06/13 while retreating from all-time highs. A subsequent violation of that important near-term support level may trigger a technical sell signal.
>>> FEATURED STOCK ARTICLE : Perched Near All-Time High Tallying Quiet Gains - 11/13/2013
View all notes |
Set NEW NOTE alert |
CANSLIM.net Company Profile |
SEC
News |
Chart |
Request a new note
C
A N
S L
I M
|
Symbol/Exchange
Company Name
Industry Group |
PRICE |
CHANGE
(%Change) |
Day High |
Volume
(% DAV)
(% 50 day avg vol) |
52 Wk Hi
% From Hi |
Featured
Date |
Price
Featured |
Pivot Featured |
|
Max Buy |
GNRC
-
NYSE
Generac Hldgs Inc
CONSUMER DURABLES - Electronic Equipment
|
$52.52
|
+0.64
1.23% |
$52.62
|
378,651
46.02% of 50 DAV
50 DAV is 822,800
|
$54.00
-2.74%
|
11/26/2013
|
$53.02
|
PP = $52.42
|
|
MB = $55.04
|
Most Recent Note - 12/12/2013 5:49:21 PM
Y - Hovering near its 52-week high, still quietly consolidating above prior highs in the $52 area defining initial support to watch.
>>> FEATURED STOCK ARTICLE : Following Latest Breakout Prior Highs Define Support - 11/29/2013
View all notes |
Set NEW NOTE alert |
CANSLIM.net Company Profile |
SEC
News |
Chart |
Request a new note
C
A N
S L
I M
|
HLF
-
NYSE
Herbalife Ltd
DRUGS - Nutrition and Weight Management
|
$68.60
|
-1.07
-1.54% |
$70.23
|
1,713,536
66.94% of 50 DAV
50 DAV is 2,559,900
|
$77.39
-11.36%
|
11/22/2013
|
$72.21
|
PP = $75.04
|
|
MB = $78.79
|
Most Recent Note - 12/11/2013 5:13:51 PM
Y - Its 50 DMA line (now $67.10) defines near-term support to watch. Slumped back into its prior base with higher volume Friday indicative of distributional pressure, and it fell further today with light volume. Stalled after volume-driven gains helped it rally above its pivot point to trigger a technical buy signal last week.
>>> FEATURED STOCK ARTICLE : Perched Near Highs Following Rebound - 11/22/2013
View all notes |
Set NEW NOTE alert |
CANSLIM.net Company Profile |
SEC
News |
Chart |
Request a new note
C
A N
S L
I M
|
JAZZ
-
NASDAQ
Jazz Pharmaceuticals Plc
DRUGS - Biotechnology
|
$115.39
|
+0.17
0.15% |
$117.33
|
467,478
60.32% of 50 DAV
50 DAV is 775,000
|
$121.15
-4.75%
|
9/30/2013
|
$93.20
|
PP = $89.10
|
|
MB = $93.56
|
Most Recent Note - 12/11/2013 6:03:09 PM
G - Retreated from its 52-week high hit on the prior session. It is extended from any sound base and well above support at its 50 DMA line (now $99.45).
>>> FEATURED STOCK ARTICLE : Technically Extended Stock May Be a Dangerous Chase - 12/10/2013
View all notes |
Set NEW NOTE alert |
CANSLIM.net Company Profile |
SEC
News |
Chart |
Request a new note
C
A N
S L
I M
|
KORS
-
NYSE
Michael Kors Hldgs Ltd
RETAIL - Apparel Stores
|
$82.65
|
+2.07
2.57% |
$82.77
|
3,852,742
85.09% of 50 DAV
50 DAV is 4,527,600
|
$83.13
-0.58%
|
8/6/2013
|
$69.66
|
PP = $66.28
|
|
MB = $69.59
|
Most Recent Note - 12/12/2013 5:51:31 PM
G - Rallied toward its 52-week high for a best-ever close with near average volume behind today's gain. Prior highs in the $78 area define near-term support coinciding with its 50 DMA line.
>>> FEATURED STOCK ARTICLE : Consolidation Too Brief To Note New Pivot - 12/6/2013
View all notes |
Set NEW NOTE alert |
CANSLIM.net Company Profile |
SEC
News |
Chart |
Request a new note
C
A N
S L
I M
|
PCLN
-
NASDAQ
Priceline.Com Inc
INTERNET - Internet Software and Services
|
$1,175.24
|
-2.87
-0.24% |
$1,183.47
|
404,006
63.02% of 50 DAV
50 DAV is 641,100
|
$1,198.75
-1.96%
|
9/13/2013
|
$966.82
|
PP = $995.08
|
|
MB = $1,044.83
|
Most Recent Note - 12/11/2013 5:58:50 PM
G - Still hovering at its 52-week high. It may go on to produce more climactic gains but is currently extended from any sound base pattern. Reported earnings +40% on +33% sales revenues for the Sep '13 quarter versus the year-ago period, improving after a slightly sub par Jun '13 report.
>>> FEATURED STOCK ARTICLE : Extended From Any Sound Base Pattern - 12/3/2013
View all notes |
Set NEW NOTE alert |
CANSLIM.net Company Profile |
SEC
News |
Chart |
Request a new note
C
A N
S L
I M
|
Symbol/Exchange
Company Name
Industry Group |
PRICE |
CHANGE
(%Change) |
Day High |
Volume
(% DAV)
(% 50 day avg vol) |
52 Wk Hi
% From Hi |
Featured
Date |
Price
Featured |
Pivot Featured |
|
Max Buy |
SFUN
-
NYSE
Soufun Hldgs Ltd Ads A
INTERNET - Internet Information Providers
|
$71.82
|
+2.80
4.06% |
$72.34
|
919,936
62.39% of 50 DAV
50 DAV is 1,474,600
|
$77.45
-7.27%
|
10/17/2013
|
$58.02
|
PP = $53.87
|
|
MB = $56.56
|
Most Recent Note - 12/11/2013 5:15:22 PM
G - Volume was light behind today's loss while still consolidating from its all-time high hit last week. It is extended from any sound base pattern yet may produce more climactic gains. Prior highs and its 50 DMA line coincide in the $59 area defining important support to watch.
>>> FEATURED STOCK ARTICLE : Extended From Base Yet May Produce More Climactic Gains - 12/9/2013
View all notes |
Set NEW NOTE alert |
CANSLIM.net Company Profile |
SEC
News |
Chart |
Request a new note
C
A N
S L
I M
|
SSNC
-
NASDAQ
S S & C Technologies
COMPUTER SOFTWARE and SERVICES - Application Software
|
$39.45
|
-0.81
-2.01% |
$40.26
|
359,656
116.28% of 50 DAV
50 DAV is 309,300
|
$43.80
-9.93%
|
10/22/2013
|
$39.17
|
PP = $40.04
|
|
MB = $42.04
|
Most Recent Note - 12/12/2013 5:54:36 PM
G - Color code is changed to green after today's 5th consecutive loss came on higher volume while violating its 50 DMA line and triggering a technical sell signal. Only a prompt rebound above that short-term average would help its outlook improve.
>>> FEATURED STOCK ARTICLE : Volume Totals Cooling Following Recent Volume-Driven Breakout - 11/12/2013
View all notes |
Set NEW NOTE alert |
CANSLIM.net Company Profile |
SEC
News |
Chart |
Request a new note
C
A N
S L
I M
|
SSYS
-
NASDAQ
Stratasys Ltd
COMPUTER HARDWARE - Computer Peripherals
|
$119.51
|
+0.75
0.63% |
$121.48
|
647,249
54.52% of 50 DAV
50 DAV is 1,187,100
|
$134.00
-10.81%
|
10/11/2013
|
$102.94
|
PP = $105.38
|
|
MB = $110.65
|
Most Recent Note - 12/10/2013 4:40:00 PM
G - Still quietly consolidating well above support at its 50 DMA line. More damaging losses would raise greater concerns and trigger worrisome technical sell signals. Previously noted with caution - "Reported earnings +13% on +153% sales revenues, below the +25% minimum earnings guideline (C criteria) raising fundamental concerns."
>>> FEATURED STOCK ARTICLE : Rallying For New Highs Despite Fundamental Flaw Raising Concern - 11/18/2013
View all notes |
Set NEW NOTE alert |
CANSLIM.net Company Profile |
SEC
News |
Chart |
Request a new note
C
A N
S L
I M
|
ULTI
-
NASDAQ
Ultimate Software Group
INTERNET - Internet Software and Services
|
$145.31
|
-1.21
-0.83% |
$146.48
|
130,529
91.99% of 50 DAV
50 DAV is 141,900
|
$162.88
-10.79%
|
10/16/2013
|
$142.95
|
PP = $151.18
|
|
MB = $158.74
|
Most Recent Note - 12/11/2013 5:56:22 PM
G - Color code is changed to green after violating its 50 DMA line and prior highs near $151 with today's 3rd consecutive loss triggering a technical sell signal. Only a prompt rebound above its 50 DMA line would help its outlook.
>>> FEATURED STOCK ARTICLE : Consolidating Above 50 DMA Line and Prior Highs Defining Support - 11/21/2013
View all notes |
Set NEW NOTE alert |
CANSLIM.net Company Profile |
SEC
News |
Chart |
Request a new note
C
A N
S L
I M
|
VRX
-
NYSE
Valeant Pharmaceuticals
DRUGS - Drug Manufacturers - Other
|
$106.24
|
-0.25
-0.23% |
$107.18
|
1,008,785
88.45% of 50 DAV
50 DAV is 1,140,500
|
$115.40
-7.93%
|
9/11/2013
|
$100.26
|
PP = $105.50
|
|
MB = $110.78
|
Most Recent Note - 12/11/2013 5:57:48 PM
G - Slumped below its 50 DMA line with higher but near average volume today and its color code is changed to green. Recent lows in the $102 area define near-term support where a violation may trigger a technical sell signal. Resilient after it reported earnings +24% on +74% sales revenues for the Sep '13 quarter, a notch below the +25% minimum guideline (C criteria).
>>> FEATURED STOCK ARTICLE : Recent Lows Define Support to Watch Below 50 Day Average - 11/15/2013
View all notes |
Set NEW NOTE alert |
CANSLIM.net Company Profile |
SEC
News |
Chart |
Request a new note
C
A N
S L
I M
|
Symbol/Exchange
Company Name
Industry Group |
PRICE |
CHANGE
(%Change) |
Day High |
Volume
(% DAV)
(% 50 day avg vol) |
52 Wk Hi
% From Hi |
Featured
Date |
Price
Featured |
Pivot Featured |
|
Max Buy |
YNDX
-
NASDAQ
Yandex N V Class A
INTERNET - Internet Information Providers
|
$38.16
|
+0.74
1.98% |
$39.04
|
6,561,816
245.82% of 50 DAV
50 DAV is 2,669,400
|
$42.00
-9.14%
|
11/27/2013
|
$39.61
|
PP = $42.10
|
|
MB = $44.21
|
Most Recent Note - 12/12/2013 1:09:11 PM
G - Rebounding near its 50 DMA line with a solid gain backed by above average volume today. On the prior session it violated its 50 DMA line triggering a technical sell signal and it was noted - "Only a prompt rebound above its 50 DMA line would help its outlook improve. Challenged its 52-week high recently but did not produce the required volume-driven gains above the pivot point to trigger a proper new technical buy signal."
>>> FEATURED STOCK ARTICLE : Forming New Base Pattern With Little Resistance Remaining - 11/27/2013
View all notes |
Set NEW NOTE alert |
CANSLIM.net Company Profile |
SEC
News |
Chart |
Request a new note
C
A N
S L
I M
|
|
|
|
THESE ARE NOT BUY RECOMMENDATIONS!
Comments contained in the body of this report are technical
opinions only. The material herein has been obtained
from sources believed to be reliable and accurate, however,
its accuracy and completeness cannot be guaranteed.
This site is not an investment advisor, hence it does
not endorse or recommend any securities or other investments.
Any recommendation contained in this report may not
be suitable for all investors and it is not to be deemed
an offer or solicitation on our part with respect to
the purchase or sale of any securities. All trademarks,
service marks and trade names appearing in this report
are the property of their respective owners, and are
likewise used for identification purposes only.
This report is a service available
only to active Paid Premium Members.
You may opt-out of receiving report notifications
at any time. Questions or comments may be submitted
by writing to Premium Membership Services 665 S.E. 10 Street, Suite 201 Deerfield Beach, FL 33441-5634 or by calling 1-800-965-8307
or 954-785-1121.
|
|
|

