You are not logged in.
This means you
CAN ONLY VIEW reports that were published prior to Monday, April 14, 2025.
You
MUST UPGRADE YOUR MEMBERSHIP if you want to see any current reports.
AFTER MARKET UPDATE - WEDNESDAY, DECEMBER 11TH, 2013
Previous After Market Report Next After Market Report >>>
|
|
|
|
DOW |
-129.60 |
15,843.53 |
-0.81% |
|
Volume |
727,226,410 |
+17% |
|
Volume |
1,789,430,070 |
+5% |
|
NASDAQ |
-56.68 |
4,003.81 |
-1.40% |
|
Advancers |
599 |
19% |
|
Advancers |
597 |
23% |
|
S&P 500 |
-20.40 |
1,782.22 |
-1.13% |
|
Decliners |
2,473 |
79% |
|
Decliners |
1,959 |
74% |
|
Russell 2000 |
-18.19 |
1,101.50 |
-1.62% |
|
52 Wk Highs |
49 |
|
|
52 Wk Highs |
55 |
|
|
S&P 600 |
-9.04 |
633.23 |
-1.41% |
|
52 Wk Lows |
166 |
|
|
52 Wk Lows |
42 |
|
|
 |
Negative Breadth as Major Averages Retreat From Record Highs
Kenneth J. Gruneisen - Passed the CAN SLIM® Master's Exam
Stocks declined for the second straight session on Wednesday. The volume totals were reported mixed, lighter on the NYSE while volume was higher on the Nasdaq exchange. Breadth was negative as decliners led advancers by a 4-1 margin on the NYSE and 7-2 on the Nasdaq exchange. There were 24 high-ranked companies from the CANSLIM.net Leaders List that made new 52-week highs and appeared on the CANSLIM.net BreakOuts Page, down from a total of 44 stocks on the prior session. The list of stocks hitting new 52-week highs outnumbered new lows on the Nasdaq exchange, however new lows solidly outnumbered new highs on the NYSE. There were losses for all of the 15 high-ranked companies currently included on the Featured Stocks Page, a more negative bias in that group of leading stocks versus the broader market's negative breadth.
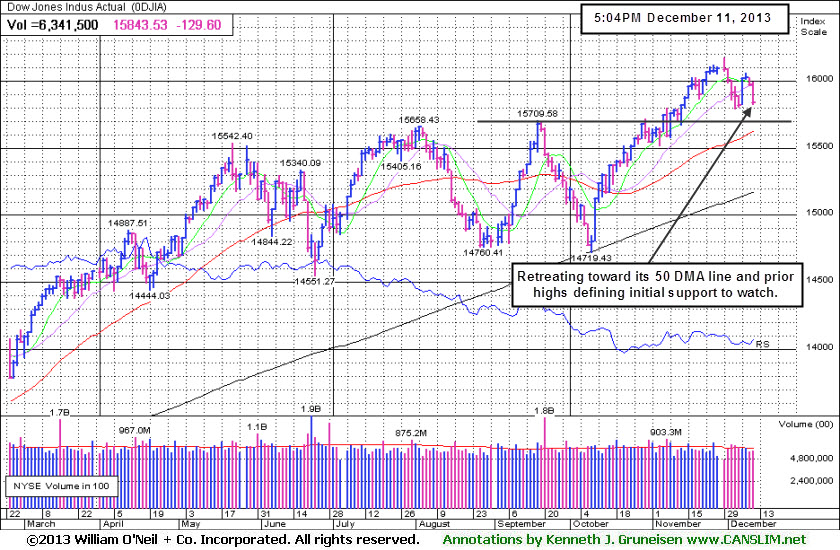
The Dow lost 129 points to 15,843. The S&P 500 Index suffered the biggest one-day retreat in nearly five-weeks as it fell 20 points to 1,782. The NASDAQ was down 56 points to 4,003. The major averages dropped as a budget deal in Washington intensified concerns that the Fed may soon begin scaling back its stimulus measures.
All 10 S&P 500 sectors closed in negative territory. The materials group paced the decline as DuPont (DD -1.87%) and PPG Industries Inc (PPG -2.67%) fell. Health care also weighed on the market. Laboratory Corp of America (LH -10.99%) tumbled after delivering disappointing 2014 earnings projections. In the industrials sector, General Electric Co (GE -2.06%) fell and weighed the most on the S&P 500. On the upside, MasterCard Inc (MA +3.53%) rallied following the announcement of a stock split and a boost to its quarterly dividend.
Treasury prices fell and held losses after a government auction of 10-year debt drew tepid demand. The 10-year note was down 11/32 to yield 2.84%. The 30-year bond lost 21/32 to yield 3.88%.
The Market (M criteria) rally has come under more worrisome distributional pressure while leadership (stocks hitting new highs) has waned. Any new buying efforts should be selective. The CANSLIM.net Featured Stocks Page shows the most action-worthy candidates and their latest notes and a new Headline Link directs members to the latest detailed analysis with data-packed graphs annotated by a Certified expert along with links to additional resources. The Premium Member Homepage - includes "dynamic archives" to all prior pay reports published. Watch for an announcement via email concerning the next WEBCAST.
PICTURED: The Dow Jones Industrial Average is pulling back toward its 50-day moving average (DMA) line and prior highs defining important support to watch.
|
 Kenneth J. Gruneisen started out as a licensed stockbroker in August 1987, a couple of months prior to the historic stock market crash that took the Dow Jones Industrial Average down -22.6% in a single day. He has published daily fact-based fundamental and technical analysis on high-ranked stocks online for two decades. Through FACTBASEDINVESTING.COM, Kenneth provides educational articles, news, market commentary, and other information regarding proven investment systems that work in good times and bad.
Comments contained in the body of this report are technical opinions only and are not necessarily those of Gruneisen Growth Corp. The material herein has been obtained from sources believed to be reliable and accurate, however, its accuracy and completeness cannot be guaranteed. Our firm, employees, and customers may effect transactions, including transactions contrary to any recommendation herein, or have positions in the securities mentioned herein or options with respect thereto. Any recommendation contained in this report may not be suitable for all investors and it is not to be deemed an offer or solicitation on our part with respect to the purchase or sale of any securities. |
|
 |
Widespread Losses Weighed All Groups Down
Kenneth J. Gruneisen - Passed the CAN SLIM® Master's Exam
The Gold & Silver Index ($XAU -3.45%) was a standout decliner on Wednesday. Energy-related groups pulled back as the Integrated Oil Index ($XOI -1.27%) and Oil Services Index ($OSX -1.20%) ended lower. The Broker/Dealer Index ($XBD -1.01%) and the Bank Index ($BKX -1.38%) both fell as financials also were negative influence on the major averages. The Biotechnology Index ($BTK -2.76%) led the tech sector lower while the Semiconductor Index ($SOX -1.00%) and the Networking Index ($NWX -0.73%) also fell. The Retail Index ($RLX -0.64%) ended with a modest loss, rounding out the widely negative session.
Charts courtesy www.stockcharts.com
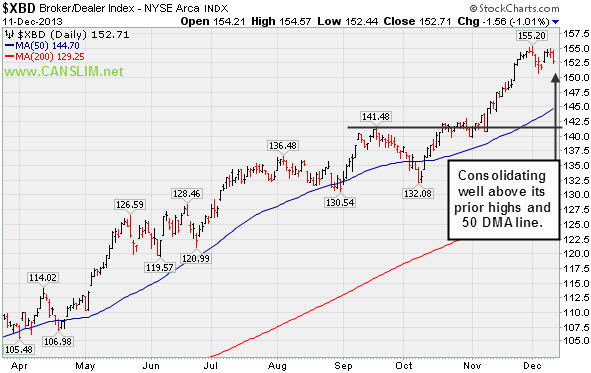
PICTURED: The Broker/Dealer Index ($XBD -1.01%) is consolidating well above prior highs and its 50-day moving average (DMA) line.
| Oil Services |
$OSX |
271.02 |
-3.29 |
-1.20% |
+23.10% |
| Integrated Oil |
$XOI |
1,446.24 |
-18.66 |
-1.27% |
+16.46% |
| Semiconductor |
$SOX |
510.17 |
-5.17 |
-1.00% |
+32.84% |
| Networking |
$NWX |
306.49 |
-2.25 |
-0.73% |
+35.29% |
| Broker/Dealer |
$XBD |
152.71 |
-1.56 |
-1.01% |
+61.89% |
| Retail |
$RLX |
915.91 |
-5.90 |
-0.64% |
+40.25% |
| Gold & Silver |
$XAU |
82.83 |
-2.96 |
-3.45% |
-49.98% |
| Bank |
$BKX |
66.48 |
-0.93 |
-1.38% |
+29.64% |
| Biotech |
$BTK |
2,201.23 |
-62.47 |
-2.76% |
+42.29% |
|
|
|
 |
Dropped Due to Weakness Following +191% Gain Since Featured
Kenneth J. Gruneisen - Passed the CAN SLIM® Master's Exam
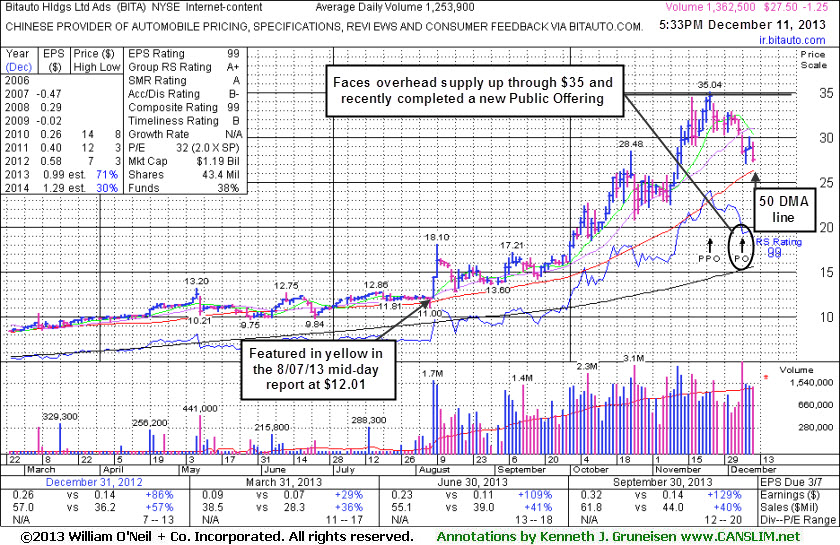
Biotauto Hldgs Ltd Ads (BITA -$1.25 -4.35% to $27.50) will be dropped from the Featured Stocks list tonight after finishing the session near its low and -21.5% off its 52-week high. It Completed a new Public Offering on 12/06/13, and it faces overhead supply that may act as resistance up through the $35 level. It gas been retreating and may test support at its 50-day moving average (DMA) line, where a violation would be a more worrisome sign. Like any stock that is dropped from the Featured Stocks list, if fundamentals remain strong while a new base forms, and strength eventually returns, it may one day return to the Featured Stocks list.
BITA was last shown in this FSU section on 11/11/13 with an annotated graph under the headline, "Consolidating After Getting Extended From Prior Base". It traded up as much as +191.7% since first highlighted in the 8/07/13 mid-day report in yellow at $12.01 with the prior pivot point based on its 5/08/13 high plus 10 cents (read here).
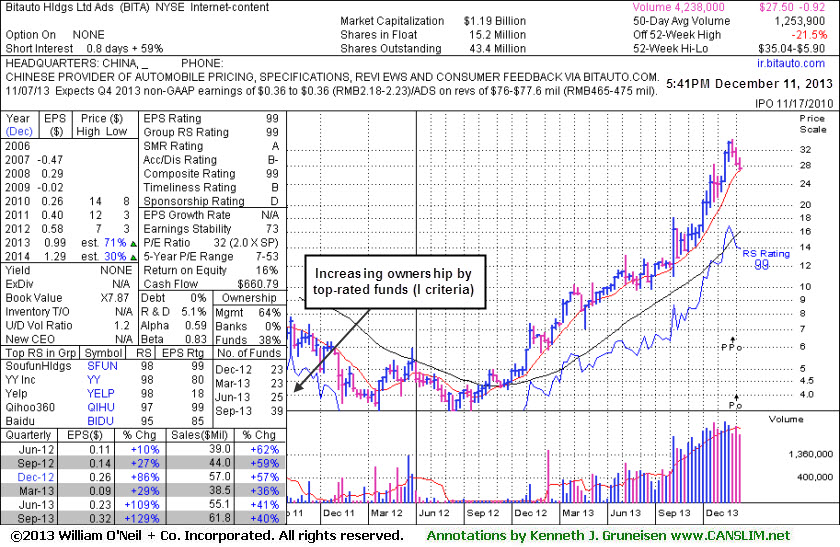
This China-based Internet-Content firm reported financial results +129% on +40% sales revenues for the Sep '13 quarter. Its quarterly and annual earnings (C and A criteria) history has been strong. Its small supply (S criteria) of only 13.9 million shares in the public float can contribute to great volatility in the event of institutional buying or selling. There are 39 top-rated mutual funds as of Sep '13 that currently own an interest in the company, up from 25 in June, a reassuring sign concerning the I criteria. Its Up/Down Volume Ratio of 1.2 is an unbiased indication that its shares have been under slight accumulation over the past 50 days.
|
|
|
Color Codes Explained :
Y - Better candidates highlighted by our
staff of experts.
G - Previously featured
in past reports as yellow but may no longer be buyable under the
guidelines.
***Last / Change / Volume data in this table is the closing quote data***
Symbol/Exchange
Company Name
Industry Group |
PRICE |
CHANGE
(%Change) |
Day High |
Volume
(% DAV)
(% 50 day avg vol) |
52 Wk Hi
% From Hi |
Featured
Date |
Price
Featured |
Pivot Featured |
|
Max Buy |
BITA
-
NYSE
Bitauto Hldgs Ltd Ads
INTERNET - Internet Information Providers
|
$27.50
|
-1.25
-4.35% |
$29.48
|
1,362,511
108.66% of 50 DAV
50 DAV is 1,253,900
|
$35.04
-21.52%
|
9/24/2013
|
$16.40
|
PP = $17.31
|
|
MB = $18.18
|
 Most Recent Note - 12/11/2013 5:04:26 PM
It will be dropped from the Featured Stocks list tonight after finishing the session near its low and -21.5% off its 52-week high. Completed a Public Offering on 12/06/13, and it faces overhead supply that may act as resistance up through the $35 level. It may test support at its 50 DMA line, where a violation would be a more worrisome sign.
>>> FEATURED STOCK ARTICLE : Dropped Due to Weakness Following +191% Gain Since Featured - 12/11/2013
View all notes |
Set NEW NOTE alert |
CANSLIM.net Company Profile |
SEC
News |
Chart |
Request a new note
C
A N
S L
I M


|
CELG
-
NASDAQ
Celgene Corp
DRUGS - Drug Manufacturers - Major
|
$166.05
|
-4.72
-2.76% |
$170.49
|
3,075,657
107.34% of 50 DAV
50 DAV is 2,865,400
|
$173.80
-4.46%
|
9/12/2013
|
$149.50
|
PP = $150.02
|
|
MB = $157.52
|
Most Recent Note - 12/11/2013 6:00:39 PM
G - Retreated from its 52-week and all-time highs with today's loss after 5 consecutive gains. Prior highs in the $161 area define initial support to watch above its 50 DMA line.
>>> FEATURED STOCK ARTICLE : Cooling Volume Totals While Hovering Near Highs - 12/4/2013
View all notes |
Set NEW NOTE alert |
CANSLIM.net Company Profile |
SEC
News |
Chart |
Request a new note
C
A N
S L
I M
|
EGOV
-
NASDAQ
N I C Inc
INTERNET - Internet Software and Services
|
$22.96
|
-0.64
-2.71% |
$23.82
|
220,797
77.50% of 50 DAV
50 DAV is 284,900
|
$25.99
-11.66%
|
10/18/2013
|
$25.17
|
PP = $23.66
|
|
MB = $24.84
|
Most Recent Note - 12/9/2013 7:09:23 PM
G - Still holding its ground stubbonrly, consolidating in a tight range just above its 50 DMA line. Disciplined investors always limit losses by selling any stock that falls more than -7% from their purchase price.
>>> FEATURED STOCK ARTICLE : Finding Support Near 50-Day Average During Distributional Pressure - 11/25/2013
View all notes |
Set NEW NOTE alert |
CANSLIM.net Company Profile |
SEC
News |
Chart |
Request a new note
C
A N
S L
I M
|
FLT
-
NYSE
Fleetcor Technologies
DIVERSIFIED SERVICES - Business/Management Services
|
$116.78
|
-1.70
-1.43% |
$118.73
|
477,678
55.43% of 50 DAV
50 DAV is 861,700
|
$123.96
-5.79%
|
8/19/2013
|
$99.01
|
PP = $100.97
|
|
MB = $106.02
|
Most Recent Note - 12/6/2013 12:51:13 PM
G - Gapped down today retreating from all-time highs, violating the previously noted steep upward trendline connecting its Oct-Nov lows defining initial support. Its 50 DMA line ($113.99 now) defines the next important near-term support level to watch.
>>> FEATURED STOCK ARTICLE : Perched Near All-Time High Tallying Quiet Gains - 11/13/2013
View all notes |
Set NEW NOTE alert |
CANSLIM.net Company Profile |
SEC
News |
Chart |
Request a new note
C
A N
S L
I M
|
GNRC
-
NYSE
Generac Hldgs Inc
CONSUMER DURABLES - Electronic Equipment
|
$51.88
|
-1.21
-2.28% |
$53.35
|
438,341
53.09% of 50 DAV
50 DAV is 825,600
|
$54.00
-3.93%
|
11/26/2013
|
$53.02
|
PP = $52.42
|
|
MB = $55.04
|
Most Recent Note - 12/6/2013 4:32:10 PM
Y - Still perched at its 52-week high today, consolidating above prior highs in the $52 area defining initial support to watch after its 11/26/13 breakout from a short flat base with +59% above average volume triggered a new (or-add on) technical buy signal.
>>> FEATURED STOCK ARTICLE : Following Latest Breakout Prior Highs Define Support - 11/29/2013
View all notes |
Set NEW NOTE alert |
CANSLIM.net Company Profile |
SEC
News |
Chart |
Request a new note
C
A N
S L
I M
|
Symbol/Exchange
Company Name
Industry Group |
PRICE |
CHANGE
(%Change) |
Day High |
Volume
(% DAV)
(% 50 day avg vol) |
52 Wk Hi
% From Hi |
Featured
Date |
Price
Featured |
Pivot Featured |
|
Max Buy |
HLF
-
NYSE
Herbalife Ltd
DRUGS - Nutrition and Weight Management
|
$69.67
|
-3.11
-4.27% |
$73.08
|
2,309,282
89.64% of 50 DAV
50 DAV is 2,576,300
|
$77.39
-9.98%
|
11/22/2013
|
$72.21
|
PP = $75.04
|
|
MB = $78.79
|
Most Recent Note - 12/11/2013 5:13:51 PM
Y - Its 50 DMA line (now $67.10) defines near-term support to watch. Slumped back into its prior base with higher volume Friday indicative of distributional pressure, and it fell further today with light volume. Stalled after volume-driven gains helped it rally above its pivot point to trigger a technical buy signal last week.
>>> FEATURED STOCK ARTICLE : Perched Near Highs Following Rebound - 11/22/2013
View all notes |
Set NEW NOTE alert |
CANSLIM.net Company Profile |
SEC
News |
Chart |
Request a new note
C
A N
S L
I M
|
JAZZ
-
NASDAQ
Jazz Pharmaceuticals Plc
DRUGS - Biotechnology
|
$115.22
|
-4.41
-3.69% |
$120.67
|
926,721
119.75% of 50 DAV
50 DAV is 773,900
|
$121.15
-4.89%
|
9/30/2013
|
$93.20
|
PP = $89.10
|
|
MB = $93.56
|
Most Recent Note - 12/11/2013 6:03:09 PM
G - Retreated from its 52-week high hit on the prior session. It is extended from any sound base and well above support at its 50 DMA line (now $99.45).
>>> FEATURED STOCK ARTICLE : Technically Extended Stock May Be a Dangerous Chase - 12/10/2013
View all notes |
Set NEW NOTE alert |
CANSLIM.net Company Profile |
SEC
News |
Chart |
Request a new note
C
A N
S L
I M
|
KORS
-
NYSE
Michael Kors Hldgs Ltd
RETAIL - Apparel Stores
|
$80.58
|
-1.23
-1.50% |
$82.07
|
2,098,742
46.49% of 50 DAV
50 DAV is 4,514,700
|
$83.13
-3.07%
|
8/6/2013
|
$69.66
|
PP = $66.28
|
|
MB = $69.59
|
Most Recent Note - 12/6/2013 5:58:00 PM
G - Pulled back on below average volume today. Prior highs in the $78 area define near-term support coinciding with its 50 DMA line. See the latest FSU analysis for more details and new annotated daily and weekly graphs.
>>> FEATURED STOCK ARTICLE : Consolidation Too Brief To Note New Pivot - 12/6/2013
View all notes |
Set NEW NOTE alert |
CANSLIM.net Company Profile |
SEC
News |
Chart |
Request a new note
C
A N
S L
I M
|
PCLN
-
NASDAQ
Priceline.Com Inc
INTERNET - Internet Software and Services
|
$1,178.11
|
-10.81
-0.91% |
$1,198.50
|
583,296
90.94% of 50 DAV
50 DAV is 641,400
|
$1,198.75
-1.72%
|
9/13/2013
|
$966.82
|
PP = $995.08
|
|
MB = $1,044.83
|
Most Recent Note - 12/11/2013 5:58:50 PM
G - Still hovering at its 52-week high. It may go on to produce more climactic gains but is currently extended from any sound base pattern. Reported earnings +40% on +33% sales revenues for the Sep '13 quarter versus the year-ago period, improving after a slightly sub par Jun '13 report.
>>> FEATURED STOCK ARTICLE : Extended From Any Sound Base Pattern - 12/3/2013
View all notes |
Set NEW NOTE alert |
CANSLIM.net Company Profile |
SEC
News |
Chart |
Request a new note
C
A N
S L
I M
|
SFUN
-
NYSE
Soufun Hldgs Ltd Ads A
INTERNET - Internet Information Providers
|
$69.02
|
-2.73
-3.80% |
$73.50
|
914,994
61.18% of 50 DAV
50 DAV is 1,495,600
|
$77.45
-10.88%
|
10/17/2013
|
$58.02
|
PP = $53.87
|
|
MB = $56.56
|
Most Recent Note - 12/11/2013 5:15:22 PM
G - Volume was light behind today's loss while still consolidating from its all-time high hit last week. It is extended from any sound base pattern yet may produce more climactic gains. Prior highs and its 50 DMA line coincide in the $59 area defining important support to watch.
>>> FEATURED STOCK ARTICLE : Extended From Base Yet May Produce More Climactic Gains - 12/9/2013
View all notes |
Set NEW NOTE alert |
CANSLIM.net Company Profile |
SEC
News |
Chart |
Request a new note
C
A N
S L
I M
|
Symbol/Exchange
Company Name
Industry Group |
PRICE |
CHANGE
(%Change) |
Day High |
Volume
(% DAV)
(% 50 day avg vol) |
52 Wk Hi
% From Hi |
Featured
Date |
Price
Featured |
Pivot Featured |
|
Max Buy |
SSNC
-
NASDAQ
S S & C Technologies
COMPUTER SOFTWARE and SERVICES - Application Software
|
$40.26
|
-0.90
-2.19% |
$41.20
|
245,808
79.29% of 50 DAV
50 DAV is 310,000
|
$43.80
-8.08%
|
10/22/2013
|
$39.17
|
PP = $40.04
|
|
MB = $42.04
|
Most Recent Note - 12/10/2013 4:38:35 PM
Y - Color code is changed to yellow while retreating below "max buy" level with less than average volume behind its streak of 3 consecutive losses. Prior highs near $41 define initial support to watch above its 50 DMA line on pullbacks.
>>> FEATURED STOCK ARTICLE : Volume Totals Cooling Following Recent Volume-Driven Breakout - 11/12/2013
View all notes |
Set NEW NOTE alert |
CANSLIM.net Company Profile |
SEC
News |
Chart |
Request a new note
C
A N
S L
I M
|
SSYS
-
NASDAQ
Stratasys Ltd
COMPUTER HARDWARE - Computer Peripherals
|
$118.76
|
-2.50
-2.06% |
$124.36
|
804,474
68.01% of 50 DAV
50 DAV is 1,182,800
|
$134.00
-11.37%
|
10/11/2013
|
$102.94
|
PP = $105.38
|
|
MB = $110.65
|
Most Recent Note - 12/10/2013 4:40:00 PM
G - Still quietly consolidating well above support at its 50 DMA line. More damaging losses would raise greater concerns and trigger worrisome technical sell signals. Previously noted with caution - "Reported earnings +13% on +153% sales revenues, below the +25% minimum earnings guideline (C criteria) raising fundamental concerns."
>>> FEATURED STOCK ARTICLE : Rallying For New Highs Despite Fundamental Flaw Raising Concern - 11/18/2013
View all notes |
Set NEW NOTE alert |
CANSLIM.net Company Profile |
SEC
News |
Chart |
Request a new note
C
A N
S L
I M
|
ULTI
-
NASDAQ
Ultimate Software Group
INTERNET - Internet Software and Services
|
$146.52
|
-4.51
-2.99% |
$151.45
|
150,447
105.95% of 50 DAV
50 DAV is 142,000
|
$162.88
-10.04%
|
10/16/2013
|
$142.95
|
PP = $151.18
|
|
MB = $158.74
|
Most Recent Note - 12/11/2013 5:56:22 PM
G - Color code is changed to green after violating its 50 DMA line and prior highs near $151 with today's 3rd consecutive loss triggering a technical sell signal. Only a prompt rebound above its 50 DMA line would help its outlook.
>>> FEATURED STOCK ARTICLE : Consolidating Above 50 DMA Line and Prior Highs Defining Support - 11/21/2013
View all notes |
Set NEW NOTE alert |
CANSLIM.net Company Profile |
SEC
News |
Chart |
Request a new note
C
A N
S L
I M
|
VRX
-
NYSE
Valeant Pharmaceuticals
DRUGS - Drug Manufacturers - Other
|
$106.49
|
-2.13
-1.96% |
$109.02
|
1,228,915
107.86% of 50 DAV
50 DAV is 1,139,400
|
$115.40
-7.72%
|
9/11/2013
|
$100.26
|
PP = $105.50
|
|
MB = $110.78
|
Most Recent Note - 12/11/2013 5:57:48 PM
G - Slumped below its 50 DMA line with higher but near average volume today and its color code is changed to green. Recent lows in the $102 area define near-term support where a violation may trigger a technical sell signal. Resilient after it reported earnings +24% on +74% sales revenues for the Sep '13 quarter, a notch below the +25% minimum guideline (C criteria).
>>> FEATURED STOCK ARTICLE : Recent Lows Define Support to Watch Below 50 Day Average - 11/15/2013
View all notes |
Set NEW NOTE alert |
CANSLIM.net Company Profile |
SEC
News |
Chart |
Request a new note
C
A N
S L
I M
|
YNDX
-
NASDAQ
Yandex N V Class A
INTERNET - Internet Information Providers
|
$37.42
|
-2.50
-6.26% |
$39.97
|
6,167,802
239.14% of 50 DAV
50 DAV is 2,579,200
|
$42.00
-10.90%
|
11/27/2013
|
$39.61
|
PP = $42.10
|
|
MB = $44.21
|
Most Recent Note - 12/11/2013 5:00:11 PM
G - Considerable loss with above average volume today violated its 50 DMA line triggering a technical sell signal. Color code is changed to green due to the deterioration while only a prompt rebound above its 50 DMA line would help its outlook improve. Challenged its 52-week high recently but did not produce the required volume-driven gains above the pivot point to trigger a proper new technical buy signal.
>>> FEATURED STOCK ARTICLE : Forming New Base Pattern With Little Resistance Remaining - 11/27/2013
View all notes |
Set NEW NOTE alert |
CANSLIM.net Company Profile |
SEC
News |
Chart |
Request a new note
C
A N
S L
I M
|
Symbol/Exchange
Company Name
Industry Group |
PRICE |
CHANGE
(%Change) |
Day High |
Volume
(% DAV)
(% 50 day avg vol) |
52 Wk Hi
% From Hi |
Featured
Date |
Price
Featured |
Pivot Featured |
|
Max Buy |
|
|
|
THESE ARE NOT BUY RECOMMENDATIONS!
Comments contained in the body of this report are technical
opinions only. The material herein has been obtained
from sources believed to be reliable and accurate, however,
its accuracy and completeness cannot be guaranteed.
This site is not an investment advisor, hence it does
not endorse or recommend any securities or other investments.
Any recommendation contained in this report may not
be suitable for all investors and it is not to be deemed
an offer or solicitation on our part with respect to
the purchase or sale of any securities. All trademarks,
service marks and trade names appearing in this report
are the property of their respective owners, and are
likewise used for identification purposes only.
This report is a service available
only to active Paid Premium Members.
You may opt-out of receiving report notifications
at any time. Questions or comments may be submitted
by writing to Premium Membership Services 665 S.E. 10 Street, Suite 201 Deerfield Beach, FL 33441-5634 or by calling 1-800-965-8307
or 954-785-1121.
|
|
|

